Bahrain
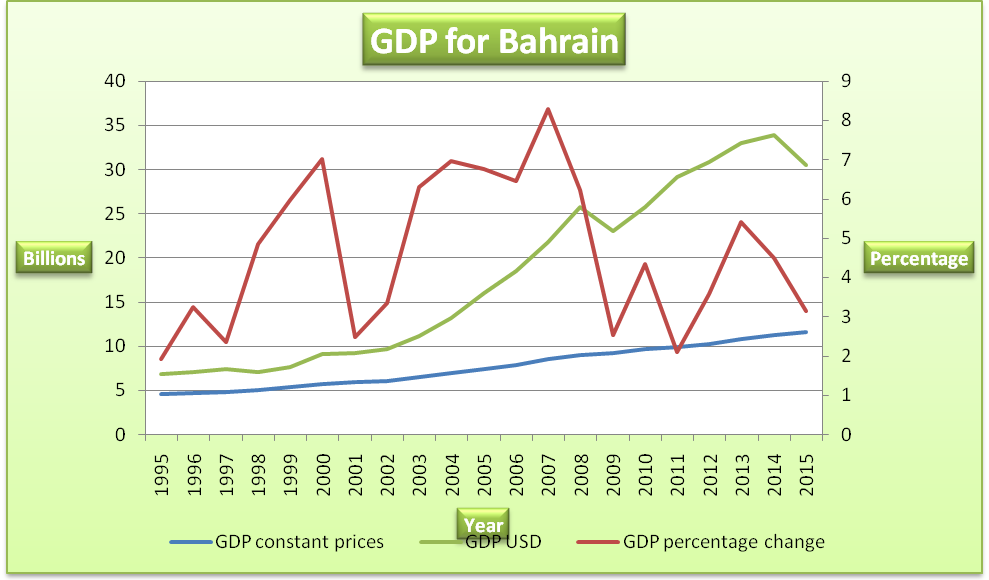
A review of real GDP and percentage change over the 20 years shows that there was a continuous growth in GDP of Bahrain. The GDP grew from BHD4.565 billion in 1995 to BHD11.617 billion in 2015. The economy did not report a decline in real GDP during the entire period. However, the percentage change fluctuated during the period as displayed in the graph above. Bahrain is the smallest country in terms of nominal GDP (USD) when compared to the GCC member countries. The major source of government revenue in Bahrain is the sale of petroleum. However, the country has little oil wealth as compared to the other GCC countries.
This created the need to exploit other sources of revenue. Thus, from the early 1990s, the country embarked on implementing diversification initiatives. The country embraced fiscal emancipation by expanding the economy to reduce overdependence on the production and sale of oil. The continuous growth of GDP that is displayed in the graph above can be attributed to expansion into banking, retail, tourism, and heavy industry. The banking industry is quite successful and is considered to be one of the major contributors to economic growth. Also, the country benefited from the oil boom that was experienced since 2001. The revenues generated during the period of oil boom were used to build infrastructure and other projects that improved the GDP and overall standard of living (Global Investment House 90).
This also contributed positively to growth in GDP. Also, the success of events such as Bahrain Grand Prix played a significant role in improving the trade relations of the Kingdom and other countries. This had a positive impact on GDP. The fluctuation of GDP in USD can be attributed to movements in the exchange rate and other economic factors.
Kuwait
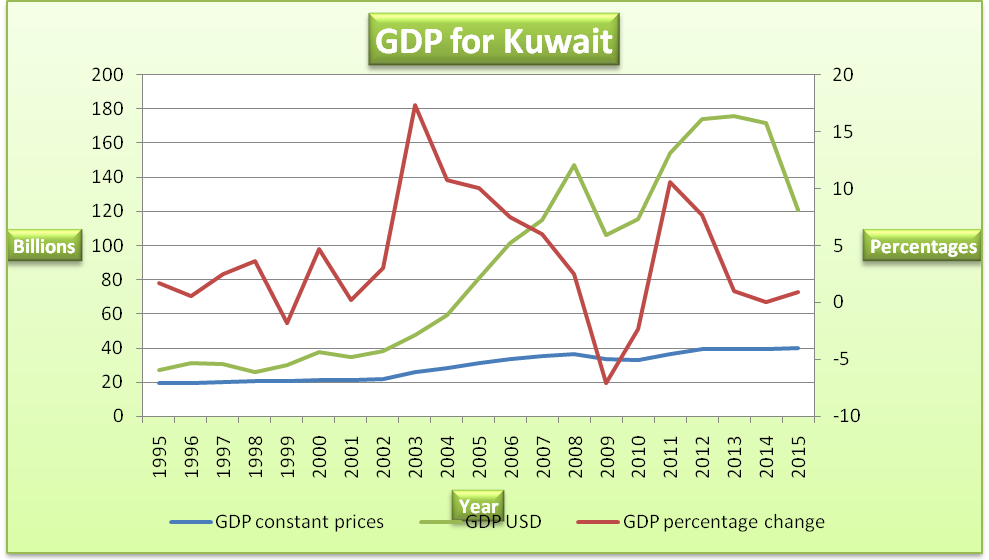
The data and chart above show that there was a general increase in the real GDP and nominal GDP in USD for Kuwait. However, there was a decline in the year 1999, 2009, and 2010. Also, GDP grew by a small percentage in 2014 and 2015. The real GDP grew from KD19.239 billion in 1995 to KD40.174 billion in 2015. The economy of Kuwait heavily depends on oil. It is estimated that the sale of oil accounts for about 95% of government revenue.
Therefore, the fluctuations that are observed in the data and the graph above can be attributed to movements in the oil market. Further, Kuwait has a well-established banking system. However, it does not contribute significantly to the GDP. The country has not been able to diversify into other sectors. This can be attributed to the upbeat financial situation and other political factors such as the inability to implement economic reforms due to an unfriendly association between the government and the parliament. The decline in GDP that was reported in 1999 can be attributed to the inauguration of the free-trade zone. This hurt GDP. The decline reported in the other years can be attributed to fluctuation in the oil market. Increasing dependence on the oil industry leaves the country susceptible to external distress. This explains the low level of growth that was reported between 2013 and 2014.
Oman
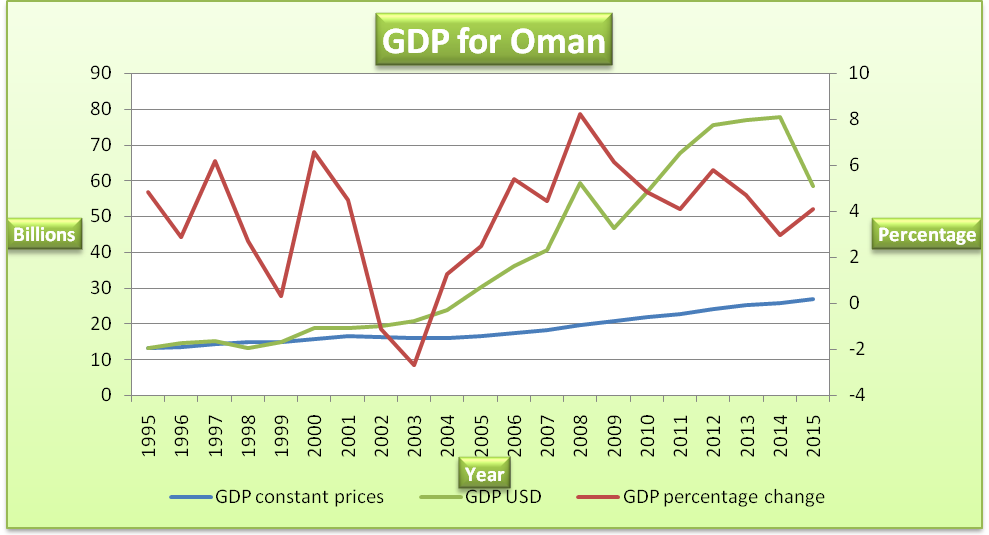
The real GDP and GDP in USD grew over the period with a slight decline in 2002 and 2003. The real GDP rose from RO13.174 billion in 1995 to RO16.993 billion in 2015. The economy heavily relies on the production and sale of oil and gas. However, overdependence on oil exposes the country to external shocks. This explains why the GDP dropped in 2002 and 2003. In recent years, the country has been keen on expanding the production and sale of natural gas. Besides, it has put in place reforms that encourage foreign investments in electric power, petrochemical, and telecommunication. Also, the government has been keen on the privatization of utility companies. Success has been reported in the implementation of economic diversification strategies. This explains the high percentage growth rate that was reported in 2012 and 2013 (Callen et al. 24).
Qatar
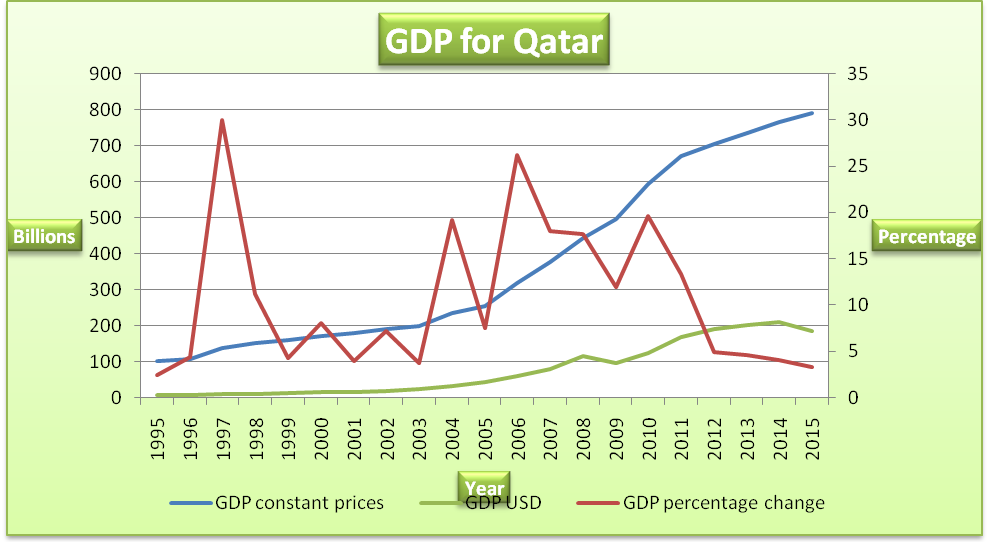
The country reported continuous growth in real GP over the period. The real GDP grew by a large margin, that is, from QR100.123 billion in 1995 to QR789 billion in 2015. Besides, all the percentage changes in GDP were positive. This implies that the country did not report a decline in real GDP during the entire 20 year period. This economy relies on oil and gas. These two products contribute about 60% to the GDP.
Apart from the oil sector, some of the key growth drivers in the non-oil sector are heavy spending on infrastructure, expansionary fiscal policies, and the incursion of workers. Even though the economy still depends on hydrocarbon revenue, the growth is currently driven by the non-hydrocarbon sectors. Further, with the preparation of the 2022 FIFA World Cup, the growth prospects for the non-oil sector look brighter.
Currently, Qatar is spending money on infrastructures such as airports, hotels, and stadiums. This has a positive impact on GDP. Thus, the government is keen on reducing reliance on hydrocarbon to a more diversified economy. Further, the country has enjoyed an extended period of political stability and peace which has created a suitable environment for investment and growth of GDP (GulfBase 19).
Saudi Arabia
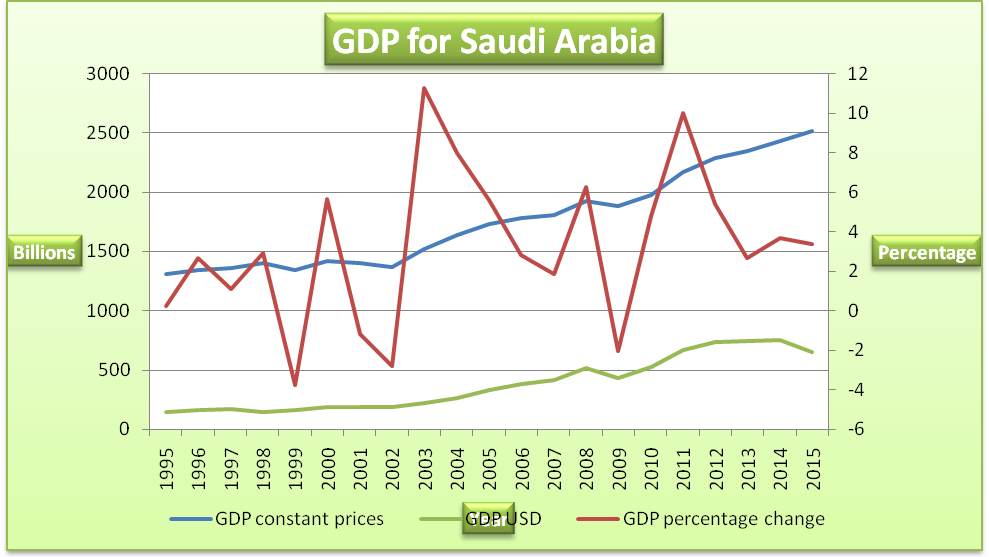
When compared to the other GCC countries, Saudi has the highest value of GDP (measured in USD). There was general growth in real GDP over the 20 years. However, the decline was reported in 1999, 2001, 2002, and 2009. The country is a major oil exporter and producer in the world. The decline reported during these periods can be attributed to low oil prices, and other factors such as East Asian economic crises, unfavorable weather conditions (El Nino), and an increase in oil production by non-OPEC countries. Oil and gas account for over 60% of the GDP. Over the years, the government has been using revenues generated from oil and gas to diversify the economy.
Besides, the company has put in place reforms that facilitate the growth of the non-oil private sector. The growth of GDP can partly be attributed to the relaxation of foreign ownership rules in the 1990s that allowed investments in crucial sectors such as financial services, telecommunication, and utilities. The Kingdom of Saudi Arabia has been successful in implementing a diversification and development plan. This has led to growth in the contribution of both the oil and non-oil sector (KAMCO Investment Company 6). Since the economy depends on oil revenue, it has experienced fluctuations in the percentage growth of real GDP. Such fluctuations are caused by instability in the global oil market and other economic conditions such as world global recessions among others.
United Arabs Emirates
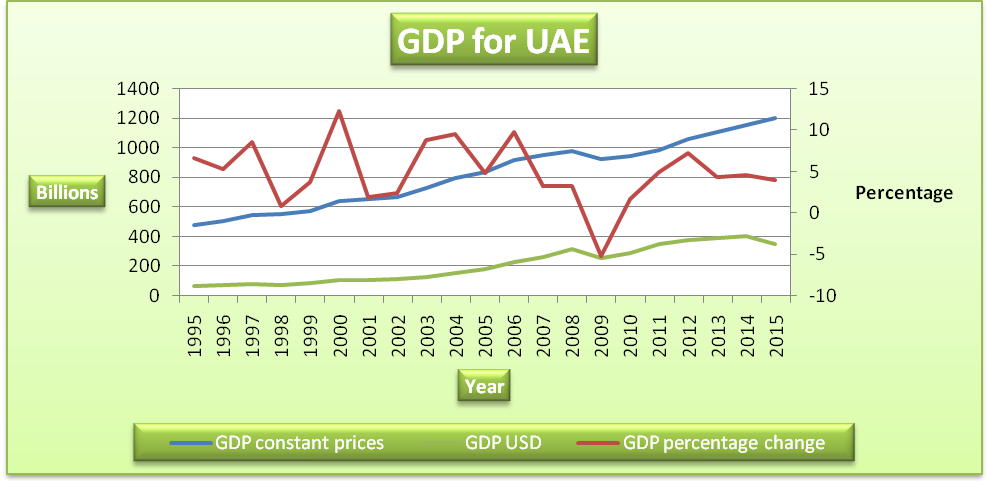
The UAE is the second-largest economy in terms of nominal GDP (USD) among the GCC member states. The percentage change in real GDP shows that the economy experienced growth apart from the year 2009. Between 2007 and 2010, the country experienced a major economic crisis. This explains the decline in GDP that was reported in 2009. The UAE is the most diversified economy when compared to the other GCC member states.
However, it still relies heavily on the oil sector. One of the most successful non-oil sectors is the tourism industry. Besides, the government is working towards reducing dependence on the oil sector. For instance, the country opened Khalifa Port in 2012. Further, the country is expected to host the 2020 World Expo. The country has continued to expand the tourism sector and international finance. Besides, the country has created a suitable environment for foreign direct investments. These initiatives have significantly contributed to the growth of GDP over the years (The World Bank Group 1).
Works Cited
Callen, Tim, Reda Cherif, Fuad Hasanov, Amgad Hegazy, and Padamja Khandelwal. Economic Diversification in the GCC: Past, Present, and Future. 2014. Web.
Global Investment House. GCC Economic Overview. 2014. Web.
GulfBase. GCC Economic Overview. 2016. Web.
International Monetary Fund. Data and Statistics. 2016. Web.
KAMCO Investment Company. GCC Economic Report. 2015. Web.
The World Bank Group. The Economic Outlook for the Middle East and North Africa. 2015. Web.