Introduction
The paper seeks to carry out a comparison of the financial performance of Microsoft Corporation and McDonald Corporation. The two companies operate in two different industries. Microsoft Corporation deals with the production and sale of software products. The company also manufactures several hardware products. The company has a presence all over the world. On the other hand, McDonald’s Corporation operates in fast food restaurants. The company has a heavy presence in the United States, Canada, and other parts of the world. The ultimate goal of this paper is to make a recommendation on whether to buy, sell or hold the shares of the two companies. The analysis will focus on carrying out a comparison of the performance of these two companies for ten years.
The analysis will concentrate on ratio analysis. Also, the intrinsic value of the shares will be compared with the market price to determine whether they are undervalued or overvalued. This will be an important aspect in determining whether to hold, sell or buy the shares of the two companies. The intrinsic value of the shares will be determined using Gordon’s growth model.
Ratio analysis
The reported financial statements of a company do not give an in-depth analysis of the financial strengths and weaknesses. Therefore, it is important to carry out further analysis of the results to have a better view of the results reported. This will provide a better understanding of the results. Further, analysis of the company helps in making an informed financial decision. It also facilitates the comparison of results for several companies. A tool that is often used to analyze the financial statement is ratio analysis. Ratio analysis breaks down the financial data into various components for better understanding (Atrill, 2009). Ratio analysis of the two companies will focus on the key aspects of the financial results of the companies.
Liquidity ratios
This category of ratios will focus on the ability of the two companies to maintain positive cash flow while satisfying immediate obligations. Businesses need to maintain optimal liquidity ratios because either low or very high ratios are not favorable. Extremely high ratios imply that a company has a high amount of current assets in its books. This might not be favorable because it shows that a lot of resources are tied into non-income generating activities. On the other hand, low liquidity ratios show that the company is unable to meet short-term obligations. The liquidity ratios for ten years are presented in table 1 in the appendix section.
The information in the table shows that Microsoft Corporation had higher levels of both current and quick ratios than McDonald’s Corporation. Further, it can be noted that both companies experienced a drop in liquidity ratios in 2007. It indicates that the drop is caused by external factors. Graph 1 in the appendix section shows that the liquidity position of McDonald’s Corporation is more volatile than that of Microsoft Corporation. Further, it can also be noted that the quick ratio for McDonald’s Corporation dropped to a level that is less than 1. This implies that the company was not able to pay the short-term obligation using quick assets (Collier, 2010). The comparison between the two companies shows that Microsoft Corporation has a better liquidity position than McDonald’s Corporation. The company is better at managing short-term solvency and working capital.
Asset utilization ratios
Asset utilization ratios focus on the internal operations of the company. These ratios show the level of activity in a company, that is, how well a company manages resources to generate a high level of sales and returns. Thus, they focus on the efficiency of the company. There is a direct connection between asset management ratios and sales. Favorable asset utilization ratios translate to high returns. Therefore, it is important for a business to closely monitor these ratios. Two asset utilization ratios will be evaluated (Graham, Smart & Meggison, 2010). The values of the ratios are presented in table 2. The receivables turnover ratio gives information on the efficiency of the company is collecting money for goods sold on credit. The receivables turnover ratios for Microsoft Corporation were lower than those of McDonald’s Corporation.
This indicates that McDonald’s Corporation is more efficient in selling goods on credit and collecting amounts due from debtors. A review of graph 2 presented below shows that the receivable turnover ratio for McDonald’s Corporation dropped during the period while that of Microsoft Corporation fluctuated during the period. This implies that the efficiency of McDonald’s Corporation is deteriorating. The average collection periods for Microsoft Corporation are higher than those of McDonald’s Corporation.
This indicates that Microsoft Corporation takes a much longer number of days to collect debts than the McDonald’s Corporation. It is worth mentioning that extremely low values of receivables such as the one reported by Microsoft Corporation could indicate that the company sells its commodities on a cash basis (Brigham & Michael, 2009). This explains why the company has a low amount of accounts receivable in the statement of financial position. The analysis shows that McDonald’s Corporation is more efficient in utilizing assets than Microsoft Corporation.
Profitability ratio
This category of ratios gives information on the earning capacity of the company. The ratio gives information on how the company makes use of available resources to generate profit. This category of ratios is quite significant to potential shareholders. Shareholders and other stakeholders prefer doing business with companies that have high profitability ratios. The value of the ratios of the two companies is presented in table 3 below. The gross profit margin for Microsoft Corporation was much higher than that of McDonald’s Corporation. This implies that the company is more efficient in managing sales and cost of sales than the McDonald’s Corporation.
The low value of gross profit margin that is observed in the case of the McDonald’s Corporation can be attributed to the high cost of sales that is inherent in the fast-food industry. Graph 3 shown below shows that the gross profit margin for Microsoft Corporation was deteriorating while that of McDonald’s had a slight increase. Microsoft Corporation had a higher level of a net profit margin than the McDonald’s Corporation. This indicates that the company is more efficient in managing the operating and non-operating segments of the business. The net profit margin for the two companies fluctuated during the period (Collier, 2010).
Finally, the return on shareholder’s equity for Microsoft was higher than that of McDonald’s. This indicates that shareholders should expect higher returns at Microsoft Corporation. From the profitability ratios, it is evident that the two companies had a fluctuating level of profitability during the ten years as shown in graph 3. Also, Microsoft Corporation is more profitable than the McDonald’s Corporation.
Debt ratio
This group of ratios gives more information on the long-term solvency of the company. That is, the amount of debt that the company has in the capital structure. This ratio is vital to potential investors because debt has a direct impact on the number of earnings that are attributed to the shareholders. A high leverage ratio is not favorable because it creates high-interest expenses. This reduces the amount of profit attributed to the equity shareholders. Further, it reduces the ability of the company to attract new capital providers. On the other hand, very low ratios are not favorable because they show that the management of the company is not quite aggressive and thus not willing to exploit the potential of the company.
Therefore, the company needs to maintain a suitable level of long-term solvency ratios. The information presented in table 4 shows that the Microsoft Corporation did not have an interest coverage ratio between the years 2005 and 2007. This can be attributed to the fact that the company did not have debt during the first three years. Graph 4 shows that the interest coverage ratio for the company dropped significantly during the six years.
This can be attributed to both an increase in debt and a decline in profit. Despite the decline, the coverage ratios were high and it shows that the company’s earnings before interest and tax are high and able to cover the interest expense. In the case of McDonald’s Corporation, the interest coverage ratio was low and the value rose by a small margin as indicated in graph 4. Despite the low values, the company has the potential of paying interest expenses. Further, the debt to equity ratio of Microsoft Corporation increased during the period (Collier, 2010).
This shows an increase in the amount of debt in the capital structure. However, the debt ratio of the company remained fairly stable during the period. In the case of McDonald’s Corporation, both the debt to equity and the debt ratio rose significantly during the period. For instance, in the year 2014, it can be noted that the amount of debt exceeded equity. The high amount of debt in the capital structure of the company can be attributed to the aggressive expansion strategy that was adopted by the company. The company has been keen on increasing the number of stores and increasing its global presence. The values were higher than those of Microsoft Corporation. This shows that the company has a higher leverage level than Microsoft Corporation. Due to the high values of McDonald’s Corporation, the company appears to be less attractive to invest in.
Gordon’s growth model
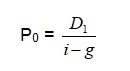
The constant dividend growth model will be used to estimate the value of shares of the two companies. The formula for the model is presented below.
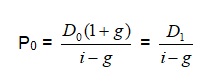
Where:
P0 – price of the share
D0 – current dividend
D1 – expected dividend in a year’s time
g – Dividend growth rate
i – Required rate of return
In this case, D1 will be the dividend that the company expects to pay in the year 2016. That is, $1.39 and $3.6 per share for Microsoft and McDonald’s Corporations respectively. Further, the required rate of return for each company will be calculated using the Capital Asset Pricing Model.
E(R) = RF + β (ERM – RF)
Where:
E (RMBC) = Expected rate of return on each stock
RF = risk free rate of return (return on LT Treasury Composite)
β = beta
ERM = Expected rate of return on the market
Further, the dividend growth rate will be equivalent to the 5-year expected future growth rate of the companies. The values are summarized in the subsequent tables.
Microsoft Corporation
(Source of data – Yahoo Finance, 2015b).
Based on the data in the table above, Microsoft Corporation is expected to grow at 9.13% over the next five years.
McDonald Corporation
(Source of data – Yahoo Finance, 2015a).
The company is expected at grow at 8.23% annually over the next five years. The calculations of intrinsic value for the two companies are presented below.
Microsoft Corporation
Required rate of return = 2.76% + 1.05 (14.77% – 2.76%) = 15.38%
= 1.39 / (15.38% – 9.13%)
= 1.39 / 6.25%
= $22.24
McDonald’s Corporation
Required rate of return
= 2.76% + 0.79 (14.77% – 2.76%)
= 12.25%
= 3.6 / (12.25% – 8.23%)
= 3.6 / 4.02%
= $89.55
The results indicate that the intrinsic values of shares of Microsoft and McDonald’s Corporations are $22.24 and $89.55 respectively. The values are estimated using the constant dividend growth model. The current market price for Microsoft’s share is $54.15 while that of McDonald’s Corporation is $110.94. It can be noted that the shares are trading at prices that are higher than their intrinsic value. This indicates that the shares are overvalued. Overvalued shares are often seen as unattractive to potential shareholders because they are likely to lose money when the share prices drop. This is based on the fact that overvalued shares have a negative margin of safety. It is worth mentioning that the method that is used to estimate the intrinsic value of the shares is quite subjective.
It depends on the values used in the calculations. Thus, different values for different periods often yield different results. Another cause of variation is the formula used. Different formulas often yield different results. Also, the market prices of the shares are controlled by the forces of demand and supply in the stock market (Collier, 2010). If the demand of the stock for a company exceeds supply (for instance, stock of a blue-chip company), then the stock prices will be higher than the equilibrium price (intrinsic value). In such cases, the stock will tend to be overvalued. Therefore, it is important to use several ratios before deciding on whether to buy, sell or hold the shares.
One alternative valuation method that can be used is the price to book ratio. The values of the ratio of the two companies were 5.6 and 12.6 for Microsoft and McDonald Corporation respectively. These values indicate that the shares are undervalued. Further, the price-to-earnings ratios were 20.1 and 21.8 for Microsoft and McDonald’s Corporations respectively (Yahoo Finance, 2015). The ratios show that the shareholders should expect higher returns in the future. The analysis shows that an investor can trade on both shares.
Conclusion and Recommendations
Even though the two companies operate in different industries, an evaluation of the performance of shares enables a potential shareholder to create a portfolio of the two stocks or to select one stock to invest in. This analysis above is quite significant. The analysis shows that Microsoft Corporation has better liquidity, profitability, and leverage position than McDonald Corporation. However, McDonald’s Corporation is more efficient in asset utilization than Microsoft Corporation. Further, the analysis above shows that the shares of both companies are trading at a price that is higher than the intrinsic value.
However, other measures of valuation show that the shares are undervalued and that the shareholders should expect higher returns in the future. Thus, as a recommendation, a potential shareholder should buy Microsoft’s shares because the company has a sound financial standing and is expected to perform much better in the future. Further, the analysis above shows that it is important to hold the shares of McDonald’s Corporation because it has an unstable financial position. The two worrying aspects of the company are the leverage position and profitability.
References
Atrill, P. (2009). Financial management for decision makers. United States: Pearson Publishers.
Brigham, E., & Michael, J. (2009). Financial management theory and practice. USA: South-Western Cengage Learning.
Collier, P. (2010). Accounting for managers. USA: John Wiley & Sons.
Graham, J., Smart, S., & Meggison, W. (2010). Corporate finance: linking theory to what companies do. USA: Cengage Learning.
Yahoo Finance. (2015a). McDonald’s corp. (MSFT). Web.
Yahoo Finance. (2015b). Microsoft corporation (MSFT). Web.
Appendices
Liquidity ratios
Table 1.
Asset utilization ratios
Table 2.
Profitability ratios
Table 3.
Table 4.