Introduction
The purpose of this paper is to make an Annual Report Analysis of Saudi Basic industries corporation. In this paper thorough review of financial statement for the last three (3) years beginning year 2005 up to 2007 of Saudi Basic industries corporation. Should be used One of the effective analyses that may be done is to analyze and compute the ratios of this company for the past three years.
These ratios are the financial indicators of Saudi Basic industries corporation distilling relevant information regarding the business entity by means of quantifying the relationship among the selected items that should be taken on the financial statements of Saudi Basic industries corporation.. The ratios are effective in order to arrive at the analysis of Annual Report because the ratios are designed for highlighting the meaningful relationships between the financial data of Saudi Basic Industries Corporation.
Methodology and sources of data
The methodology in evaluating this company will involve searching materials through internet and books. I will use books with materials on how evaluation is carried out. There are many books in areas of finance which will assist me carry out ratio analysis and company evaluation. Books will offer me general information about the topic and that will assist me to complete this project. However, internet will play the most crucial part by providing the required financial statements and reports for the company. Through the internet I will collect the relevant materials that show company evaluation. I will do funnel checking through the internet so that I can be able to get the required financial statements.
The analysis of this report will take there dimensions, first I will carry out ratio and trend analysis by calculating the ratios and historical financial reports of the company that is from 2006 to the year 2008. Then I will carry out break even analysis degree of operating leverage, cost of capital and the type of financing available.
Break even analysis
The breakeven point is the quality of output sold at which total revenues equal total costs – that is, the quantity of output sold at which the operating income is $0. Managers are interested in the breakeven point because they want to avoid operating losses. The breakeven point tells them how much output they must sell to avoid a loss.
Different choices can affect selling prices, variable cost per unit, fixed costs, units sold, and operating income. Cost volume analysis helps managers make this decision by estimating the expected long –term profitability of the choices. cost volume analysis also helps managers decide how much to advertise whether to expand into new markets, and how to price the product.
Strategic decisions invariably entail risk. Cost volume analysis evaluates how operating income will be affected if the original predicted data are not achieved – say, if sales are 10% lower than estimated. Evaluating risk affects other strategic decisions a company might make. For example, if the probability of a decline in sales seems high, a manager may take actions to shift the cost structure to have more variable costs and fewer fixed cost.
Degree of operating leverage
DOL = PERCENTAGE CHANGE IN EBIT/PERCENTAGE CHANGE IN SALES = 82.85/54.35 = 1.52 117/90 = 1.3
Financial ratio and trend analysis
The emphasis of this report is the specific uses of financial statements with respect to investors such as existing and prospective shareholders. Specifically, investors’ use financial statements and their analysis including ratio analysis to facilitate decision making on what, when and how much shares to buy, retain or sell. By using ratio analysis, investors can examine trends within the company and compare its financial performance with its peers.
Investors, in doing careful financial statement analysis, compute ratios from these statements. These ratios are generally grouped into:
- Liquidity ratios which include current, quick and cash ratios. These ratios give an indication on the ability and capability of the company to meet short term obligations.
- Activity ratios which include receivables turnover and days outstanding, inventory turnover and days outstanding, and payable turnover and days outstanding. These ratios indicate how efficient and effective the company is in using its resources to generate cash.
- Profitability ratios which include profit and gross margin percentages return on assets and equity and earnings per share. Profitability ratios help investors determine how effective and efficient a company is in generation additional shareholder wealth.
- Leverage ratios which include the ratios of debt relative to total assets and equity, interest coverage ratio and times interest earned. These ratios show how the assets of the company are financed and whether the company is highly levered or not.
However, relying too much on financial ratio analysis in deciding what, when and how much to invest is not advisable. Financial ratios by themselves have limitations. A fundamental limitation is the way financial statements themselves are prepared. Generally accepted accounting principles allow companies to choose what accounting treatment to use in recording their transactions. For example inventory can be valued by using the first-in, first-out or FIFO, weighted average and specific identification methods. Hence, comparing the financial performance of two companies which use different inventory methods is like comparing an apple with an orange. Another example is companies can also use different depreciation method – straight line, sum-of-the-years’-digits, double declining, etc. – while still not violating generally accepted accounting principles.
Moreover, managements of companies also engage in what is commonly called as window dressing. Window dressing is when the management of companies prepare financial statements with the intention of presenting the financial operations and transactions of the companies in a more attractive tone rather than merely reporting what is. Window dressed financial statements can distort the conclusions and recommendations based on the ratios calculated from such statements.
Management, having control of the operations of a company, has the discretion on its financial transactions. Management, in order to present more attractive financial results, can postpone necessary expenditures. For example, to increase net income, managers might postpone advertising expenses which, in the long run, is detrimental to the company.
Another key limitation is the characteristic of financial statements themselves. Financial statements present the results of the past and current operations of a company. Hence, the ratios based from these statements would also be on past transactions. In investment decisions, the immediate and long term prospects of the company are as important as their historical performance, sometimes even more important.
An investor must take into account all the above limitations of financial statement analysis specifically financial ratios when deciding on what companies to buy, sell or hold, and on when and how much.
The first step is to compute the liquidity or solvency ratios for the past three years such as current ratio of Saudi Basic Industries Corporation.
Current Ratio = Current Asset/Current Liabilities (figures are in dollars and millions)
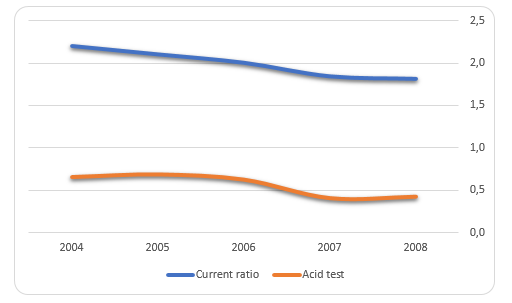
The answers were rounded off. As analyzed for the past three years (2005, 2006 & 2007), the current ratio is decreasing which means that Saudi Basic Industries Corporation is not performing well in terms of ability to meet the short-term obligations of the company. In order for the company to say that the performance is doing well, the result of the current ratio should increase every year.
Cash flow statement is also one of the vital documents which is included in the financial report of the company. According to Brealey, R; et al; (2007); Cash flow statement reflects the cash inflow and outflow of the company day to day operations. Cash flow statement includes three main activities mainly operating, investing and financing. As a result of the company’s improving current assets and good performance in 2007, its liquidity improved. Its current ratio rose to 1.2 from 0.79 times in 2007. This current ratio means that for every dollar the company owes in short term liabilities, it has a dollar and 20 cents in current assets
The next step is to observe the assets management ratio in order to measure if Saudi Basic Industries Corporation, Inc. is effective in terms of effective management when it comes to assets. Inventory Turnover Ratio and Accounts Receivable Turnover are the two asset management ratios contributing to analysis of Annual Report of Saudi Basic Industries Corporation Inc.
Inventory Turnover Ratio = Cost of Sales/Average Inventory (figures are in dollars and millions)
This means that year 2007 is better compared to year 2006 and 2005 because the ratio computed is higher which means that the number of times inventory is restocked or turned over during the period is good. Saudi Basic Industries Corporation, Inc. managed the inventory very well in year 2007.
Accounts Receivable (AR) Turnover = Credit Sales/Average AR (figures are in dollars and millions).
The result showed that year 2007 is not efficient in terms of collection process compared to year 2006 and 2005 because the computed ratio decreased every year.
Another indicator of analyzing the Annual Report of Saudi Basic Industries Corporation Inc. is the Debt Management of Leverage Ratio wherein this ratio tells about the measurement of the extent of debt financing or the so-called leverage. Financial leverage is significant to Saudi Basic Industries Corporation, Inc. because Debt is regarded as the cheapest source of capital, owners can maintain control to raise funds via debt and Equity continually provides a margin of safety for creditors. The little equity relative to debt will probably raise the cost of the debt because of riskier nature in terms of loan. An example is to compute the Debt to Equity Ratio of Saudi Basic Industries Corporation, Inc. from year 2005 to 2006.
Debt to Equity Ratio = Total Debt/Total Equity (figures are in dollars and millions).
Based on the computations above, the risk involved in 2007 is higher compared to year 2006 and 2005 in terms of usage in the areas of degree of leverage by Saudi Basic Industries Corporation, Inc.
Profitability ratios are the most exciting part of Annual Report Analysis because these ratios measure the income that is considerably relative in terms of some base. These are indeed more general for the reason that profit is a result of many factors such as leverage and the operating decisions that should be made by Saudi Basic Industries Corporation, Inc. These are Net Profit Margin on Sales and Return on Common Equity.
Net Profit Margin on sales = Net Income/Net Sales (figures are in dollars and millions)
This means that the net profit margin on sales in year 2007 has declined compared to year 2006 and 2007 because the net income of Saudi Basic Industries Corporation, Inc. decreased. This is one proof that Saudi Basic Industries Corporation, Inc. experienced financial crisis because instead of increasing the net income in year 2007, Saudi Basic Industries Corporation, Inc. failed.
Return on Common Equity = Net Income/Average Common Equity (figures in dollars & millions).
The rate of return on common equity is not better in 2007 compared to year 2006 because the percentage decreased.
Capital investment and financing
The average rate of return on investment
The average return on investment for this company can be estimated using DuPont analysis carried above. From this analysis return on investment for the year 2008 is estimated to be 9.11 %(refer return on equity).
Short Term Vs Long Term Sources Of Financing
This company has both long-term and short-term financing. Short term financing in this company include account payable and other liabilities while long term financing includes long term debts. This two form of debts consists of at most 50% of the total financing for the organizations operations.
The company also has common stock which forms the large part of financing for this company. From the financial statement it can be noted that the share capital over common equity was in the verge of growing although earnings per share was also increasing. In case the company wants to carry out further investments they have at their disposal long term debts and common equity to go for to invest for any project. It can be noted with the kind of financial performance even international venture capitalist will be willing to put their money in this company.
Debt ratios
The debt ratios calculated above indicated that the company is reducing reliance on debt. For example long term debt was on a downward trend as compared to equity. Total debt to total assets was also decreasing at a faster rate. The number of shares issued were 3billion increasing the issued capital to 30billion.
Sources and uses of funds
There are many sources of funds; they include issue of new capital to shareholders, bank loans, issues of corporate bonds.
Estimation of cost of capital
Discount rate is used to calculate present value of future cash flows. In order to calculate the Discount rate we use the Capital Asset Pricing Model (CAPM) equation. According to Saudi website; (2008); the companies Beta is 1.26.
re = rf + β (rm – rf)
There fore; re = 0.05 + 1.26(0.12 – 0.05)
re = 0.1382
re = 13.82%
Risk free market is considered to be 12%. As seen the trend of the market for the previous 10 to 15 years we can consider a risk free market of 12% to 15% so in this scenario we have considered a risk free market of 12%
Stock performance
Par value
The company shares have a par value of 10 each and they had 2.5 billion shares issued.
Book value
The current price/ book value is 1.29 meaning that the book value is 175/1.29 =135.66
Book value is normally calculated as = net worth
No of shares
But in this case we are given Price per book value.
Market value
The share price was at 175 as at 26/1/09.
EPS- in 2007 the it was 10.81 while in 2006 it was 8.12.
DPS.
The current company dividend yield is 6.77%.it is arrived at as
DPS x 100 = 6.77
Market price per share DPS = 6.77% X 175
100 = 11.85
P/E ratio
The company current price earnings ratio stands at 6.03
Summary and conclusion
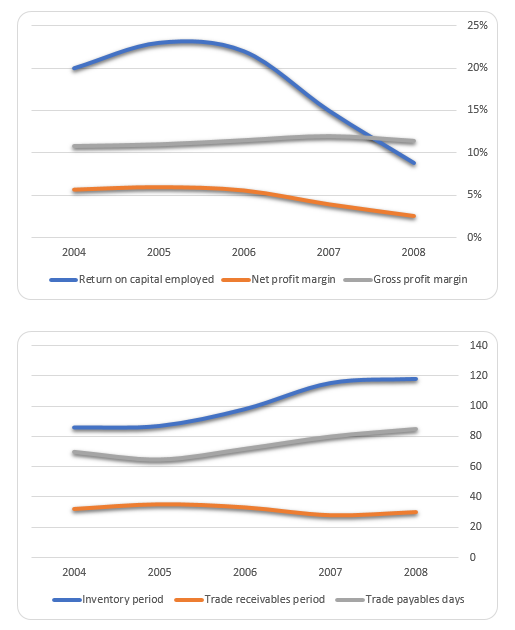
As shown in the figures above, Saudi Basic Industries Corporation revenues decrease by 30,000,000 from 2006 to 2007. This shows a 6.67 per cent drop. A look at the company’s net income for the same period shows a drop of more than 12 per cent! This, given the other ratios for Saudi Basic Industries Corporation, shows a worsening management performance and control over the company’s resources.
However, other financial ratios of the company such as its profitability, liquidity and activity ratios show a upward trend in the company’s overall performance. In spite of a relatively low decrease in the company’s gross profit margin, the net profit margin percentage and rate of return on capital employed by the company improved at a faster rate.
Furthermore, as displayed above, aside from the company’s improving profitability performance, it is also having difficulty in converting its assets, specifically inventories and receivables, into cash which it needs to pay its trade payables. As a result of its slower conversion of inventory to receivables to cash, its quick and current ratios declined during the year. Another thing is that the company pays its trade payables much earlier than it receives cash for its trade receivables. If this trend continues, the company would need additional funding to finance its working capital requirements.
Conclusion
From the above analysis, I conclude that Saudi Basic Industries Corporation is a profitable investment if the intention of the investment is to generate growth in the short term. However, if the investor intends to take an active role in the management of the company and is willing to sacrifice short term gains for the possibility of long term gains, then an investment in the company can be profitable. For a long term investment, the investor, as the new management, needs to make immediate and drastic reorganization and restructuring of Saudi Basic Industries Corporation to ensure that assets are use efficiently and effectively.
Given the above conclusion, I recommend that investment is made for Saudi Basic Industries Corporation. A long term investment, although can be profitable, is viable because of the need to take an active role in the management of the company – a role which the investor can not assume.
Limitations of the above recommendation are:
- No additional information is given with regard to Saudi Basic Industries Corporation accounting methods for inventory and depreciation. Hence, no adjustments were made on the financial statements to come up with more accurate and reliable ratios.
- No additional information is given on the immediate and long term prospects of Saudi Basic Industries Corporation. An investment recommendation based purely on the historical performance of Saudi Basic Industries Corporation is short sighted.
References
Brealey, R, Myers, S & Marcus, A 2007, ‘Fundamentals of corporate finance’, 5th edn, McGraw-hill, Sydney.
Davis, H.Z,. and Y.C Peles , Measuring Equilibrating Forces Of Financial Ratios , The Accounting Review (1993).
Eisen, P. (2003) Accounting the Easy Way; Barron’s Educational Series.
Henderson, S., Peirson, G. and Herbohn, K., (2008), Issues in Financial Accounting, 13th edition, Frenchs Forest: Pearson Education Australia.
Largay, James A III and Clyde P. Stickney, cash flows, ratio analysis and the W.T Grant Bankruptcy, Financial Analysis Journal (1980).