Introduction
Financial management implies an organization’s cash flow management system, as well as a set of parameters and metrics that follow from this. Such a system’s research is more comfortable to carry out on large companies since their data is updated regularly and is available on a variety of free services. The purpose of this research is to study Apple Inc, conduct a financial analysis of its metrics, both separately and in comparison, with its main competitors, and make recommendations regarding the company’s shares.
Apple Inc is convenient for analysis not only because of its size but also because of its rich history. It can rightfully be said that this American company has shaped the current technology market through its innovations and projects. Apple entered the market in 1976 and introduced the Apple II personal computer as one of its first products, paving the way for the PC industry (Levy, 2020). The company’s ups and downs gradually led to the fact that the corporation began to expand the list of manufactured gadgets.
Thus, color cameras, the world-famous iPod, and then the iPhone appeared on the market, which made a real revolution in the world of mobile devices. Together with the 2010 iPad, these devices determined the further direction of the company’s development, which continues to this day – the production of minicomputers and software for them.
At the moment, Apple does not have many competitors in their field. This is partly due to the uniqueness of the company’s products that have a proprietary operating system. On the other hand, the size of the corporation does not allow anyone to approach it enough to pose a severe threat. Apple currently has a capitalization of about $ 2 trillion and is one of the most valuable public companies (“AAPL Apple Inc,” n.d.).
The closest competitors, HP Inc and Lenovo Group Limited have much more modest figures of 32.3 billion and 8.9 billion, respectively (“HP Current Ratio,” n.d.). However, these corporations still have enough influence, so further Apple comparisons will be made with them. This corporation has a wide range of products, from Apple Watch and flagship smartphones iPhone to TV accessories and full-fledged workstations (“Apple,” n.d.). In addition, at the moment, users are offered a considerable number of services, including cloud storage, access to music, and various applications. HP focuses primarily on personal computers, competing with MacBooks and Macs, while Lenovo provides a similar range to Apple of personal computers, smartphones, and electronic services.
Financial Analysis
In order to conduct a high-quality financial analysis, it is necessary to use various coefficients that reflect the company’s success in the market at the moment. It is also essential to compare these indicators with opposing companies to draw a conclusion about the company’s competitiveness and its current parameters. The next section of the text will provide a comparative analysis of the Apple and HP ratios relevant to the industry.
Price-to-Earnings (PE) Ratio
This ratio, sometimes called the earnings multiplier, is calculated effortlessly and is the last closing price ratio to the previous value of the company’s earnings per share. Although this relationship is extremely simple, it is widely used in various researches since it allows quickly analyzing the situation with the company’s shares. This value helps to understand whether a stock is overvalued or undervalued, to compare the markets, and enables comparison with historical data. At the moment, Apple demonstrates a PE ratio of 37.57, which is almost four times higher than that of its competitors (“Apple Current Ratio,” n.d.). For example, HP and Lenovo have a ratio of about 10 or 11 (“HP Current Ratio,” n.d.). Therefore, it can be concluded that, at the moment, Apple shares are significantly overvalued, which may mean high expectations of investors for further growth of the company.
Price-to-Sales (P / S) Ratio
This financial indicator is calculated based on the company’s capitalization divided by the total sales or revenue for the last year, i.e., 12 months. This assessment allows us to consider how attractive investments in a corporation are since it evaluates how correctly the shares are priced. In many cases, a lower P / S ratio means more attractiveness to investors. Given Apple’s colossal capitalization, it is not surprising that their ratio is almost 8, continuing to grow steadily throughout the year (“Apple Current Ratio,” n.d.). Competitors such as HP have this figure much lower, around 0.58, due to the lower share price (“HP Current Ratio,” n.d.).
Price-to-Book (P / B) Ratio
This ratio is calculated based on the company’s capitalization divided by its book value – the company’s total assets less intangible assets and liabilities. This indicator allows, like many others, to assess the attractiveness of a company for investment. In this case, an indicator of less than one usually serves as a sign of investment reliability. At the moment, Apple has this ratio is almost as high as the previous one, reaching 32 due to high capitalization (“Apple Current Ratio,” n.d.). Given that the average is roughly one, Apple shares are highly overvalued. On the other hand, HP’s closest competitor is not in the best position since the book value of this company is negative (“HP Current Ratio,” n.d.).
Price to Free Cash Flow (P / FCF) Ratio
The price to free cash flow ratio is used as a benchmark ratio. Using this metric, researchers can analyze and compare the market price per share with the amount of free cash flow. The coefficient allows concluding the company’s ability to generate additional income and is calculated by finding the correlation between the company’s capitalization and free cash flow. Since this value is comparative, it should be average and avoid extreme values. Too low an index highlights the undervalue of a stock, and too high an overvalue. As in previous cases, this ratio, which is almost 30 for Apple, demonstrates that the stock is now too high (“Apple Current Ratio,” n.d.). Compared to this corporation, HP has a better average of 14.26, which is an indicator of fair price per share.
EBITDA Ratio
The acronym for EBITDA, which stands for Earnings Before Interest, Taxes, Depreciation, and Amortization, shows the company’s real profit and allows analyzing its debt load. This indicator takes into account, among other things, non-operating expenses; therefore, it is often used to analyze the creditworthiness of an enterprise and to compare companies. EBITDA ratio can be calculated for different periods, but in this case, an annual period is considered. Despite a slight drop in this figure over the last quarter, Apple’s revenues grew by about 1 percent year over year from the previous year, indicating the company’s success (“Apple Current Ratio,” n.d.). On the other hand, the closest competitor, HP, is in apparent trouble as the company is seeing an almost 8.5 percent drop in revenue (“HP Current Ratio,” n.d.).
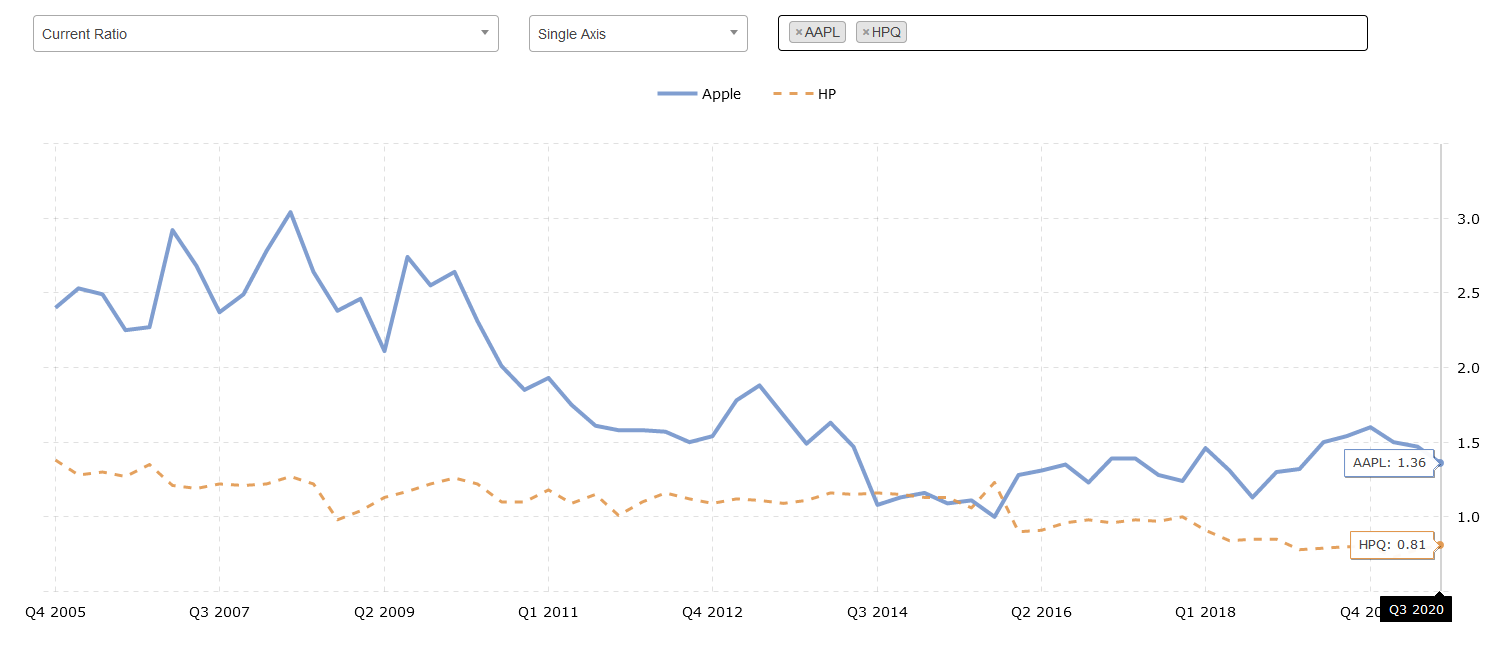
Liquidity Ratio
The quick proportion shows the ratio of current assets to short-term liabilities. The whole point of this parameter is the current assessment of the company’s ability to pay current obligations. This does not include forecasts, but rather a quick analysis of the corporation’s capabilities. In this context, Apple is definitely a reliable company, as its ratio is 1.36 (“Apple Current Ratio,” n.d.). Therefore, Apple can pay off current obligations without any problem. The situation with the closest rivals, HP and Lenovo, is a bit more depressing since they have ratios equal to 0.79 and 0.87, respectively (“HP Current Ratio,” n.d.).
Debt-to-equity (D / E) Ratio
The debt to equity proportion shows the relative ratio of the equity capital of the company in question and the funds received and used to finance current assets and operations. This metric is important because it clearly shows the ability of the company to pay its debts in the event of any financial crisis. Since the numerator of this ratio is exactly the amount of available borrowed funds, or, in other words, debt, the larger this value, the higher the existing risks of investing in this company. At the moment, Apple has a significant amount of debt, giving it its current D / E ratio of 1.51 (“Apple Current Ratio,” n.d.). However, it is in a better position as HP Inc currently has a ratio of 2.49 (“HP Current Ratio,” n.d.). On the other hand, Lenovo is suddenly a safer place to invest, with a ratio of just 0.57.
Return on Equity (ROE) Ratio
The return on equity of a company shows how profitable the business is in relation to the available capital. Also, this ratio can be considered as the return of assets at the expense of liabilities; therefore, this value, in general, can be viewed as a measure of the company’s profitability and success. Thanks to its substantial net income, Apple has a phenomenal 75.15 percent ROE at the moment (“Apple Current Ratio,” n.d.). As seen in many graphs, HP is in a disastrous position due to vast amounts of debt and negative equity values, resulting in a ratio of -172 percent (“HP Current Ratio,” n.d.) Compared to the previous two companies, Lenovo is in a centrally stable position with a solid 19 percent, being a reasonably profitable organization.
Return on Assets (ROA) Ratio
The company’s return on assets is a financial indicator that reflects the efficiency of using these assets. Its importance is related to how much income a corporation can receive using available funds and directly reflects the effectiveness of management. Therefore, the higher this value is, the more efficient the company is. In this comparison, Apple is also leading with 17.63 percent; however, this value has been maintained for quite a long time (“Apple Current Ratio,” n.d.). HP and Lenovo are in second and third places, with 8.47 and 2.43 percent respectively, and are objectively less efficient in management than Apple (“HP Current Ratio,” n.d.). Their values are also stable, which makes it possible to judge the absence of changes in companies’ management.
Return on Tangible Equity (ROTE) Ratio
The return on tangible capital is directly related to the company’s profitability and reliability, as it reflects the company’s ability to cope with potential losses. This ratio is calculated by identifying the relationship between the company’s net profit and the average monthly tangible share capital. Unlike HP and Lenovo, which have a negative tangible share capital, Apple has a stable ROTE ratio of 75.15 percent (“Apple Current Ratio,” n.d.). In addition, this value has increased by almost 20 percent over the past 12 months. It can be used to support the idea stated above that Apple’s governance is stable and profitable.
Apple and COVID-19
One of the main current events that affect the work of absolutely all companies, regardless of their focus, is COVID-19. The pandemic raging around the world has made significant changes in people’s lives. Due to the quarantine and lockdown introduced in many places, many companies’ sales have dropped significantly. Besides, citizens’ purchasing power was significantly affected by the falling incomes due to the transition to remote work at best and job loss at worst. Consequently, many companies had to adapt to the changed situation by taking additional measures and developing new projects.
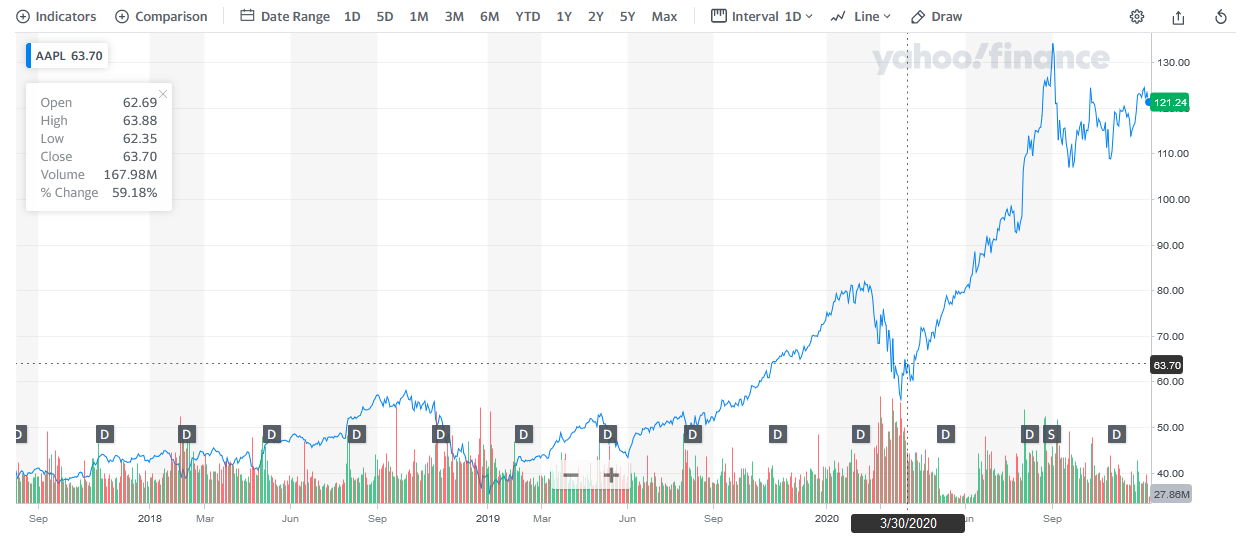
It should be noted that despite the global situation, it cannot be said that Apple’s sales have fallen dramatically. This trend is visible thanks to the financial charts and ratios discussed above. For example, Apple’s stock prices not only did not fall but almost doubled in comparison with the data in early 2020.
First of all, the undying interest in the products of this company is due to their prices and the target audience. Often, Apple products are bought by people at least in the upper-middle class because of their cost. In many cases, the iPhone of the latest brand is a status item; therefore, it is bought by people with the corresponding income. Although many people around the world have suffered from the pandemic, objectively, high-ranking people are more likely to maintain their position and their wealth, which allows them to continue using Apple services.
Besides, at the moment, there are many ways to receive the company’s products from the comfort of your home, ordering home delivery through online services. Therefore, it can be argued that Apple does not incur significant losses due to the spread of COVID-19.
However, this does not stop the company from taking various kinds of preventive measures to generally improve the situation and help the victims of the coronavirus. In addition to the general dissemination of information, alerting people to the need to maintain social distance and wear masks, and fulfill all quarantine conditions on stores’ premises, Apple has also developed a special screening tool. This suite includes a website providing up-to-date information on COVID-19, disease advice, and links to nearby resources for virus testing (“Coronavirus (COVID-19),” n.d.). In addition, an application for compatible devices has been developed and released, which allows implementing approximately the same functions.
The purpose of these resources is to disseminate relevant information, and it is in the power of Apple to convey it to the end-user as efficiently as possible due to the number of devices used. During such events, large companies’ collaboration with the resources to solve problems is needed to work together to remove existing obstacles. That is why, in this case, a partnership was made between Google and Apple, usually opposing each other. Moreover, this decision reflected the interests of both companies, as it not only addressed the public issue but also ensured the maintenance of current market shares (Michael & Abbas, 2020).
Therefore, we can conclude that Apple was not significantly affected by the pandemic due to the target audience of their services and the timely protective measures taken. Besides, social and economic projects put forward on time helped them to remain relevant. Despite the worldwide pandemic, the company continues to develop new gadgets such as the iPhone 12 (“Apple,” n.d.). Timely economic and social decisions have allowed Apple to maintain its relevance and market position.
Conclusions and Recommendations
Thus, the analysis of the above parameters allows us to conclude that, at the moment, Apple Inc is in a reasonably stable position. Despite the coronavirus pandemic and other factors, the company’s share price remains high, and most of its indicators are positive. However, the above metrics show that Apple’s price per share is highly overvalued. Compared to competitors and approximate market averages, Apple’s ratios are two to three times the norm.
As a result, a neutral policy with further analysis of the situation is recommended for the company’s shares. At the moment, they are overvalued, which can be seen using the CAP M model, which allows for an expected return of 15.85% (“Capital Asset Pricing Model,” n.d.). While Apple’s new iPhones have certainly made a good profit, the new AirPods Max is a dubious venture that may not be worth investment. Therefore, it is best to hold the stocks at the moment, focusing on the further development of the situation.
References
AAPL Apple Inc. (n.d.). Yahoo Finance. Web.
Apple Current Ratio 2006-2020 | AAPL (n.d.). Macrotrends. Web.
Apple. (n.d.). Web.
Capital Asset Pricing Model (CAPM) (n.d.) Stock Analysis on Net. Web.
Coronavirus (COVID-19) – Apple and CDC (n.d.). Apple. Web.
HP Current Ratio 2006-2020 | HPQ (n.d.). Macrotrends. Web.
Levy, S. (2020). Apple Inc. Encyclopædia Britannica. Web.
Michael, K., & Abbas, R. (2020). Behind COVID-19 contact trace apps: the Google–Apple partnership. IEEE Consumer Electronics Magazine, 9(5), 71-76.