Apple Incorporation Financial Performance

Introduction

Apple Incorporation is a publicly traded company which operates within the global personal computers industry. The firm was established in 1976 by Steve, Wozniak, Ronald Gerald and Steven Paul Jobs. Its headquarters are located in Cupertino, California. In its operation, the firm deals with designing, manufacturing and marketing diverse media and mobile communication devices such as portable digital music players, personal computers and related software. The firm also offers 3rd party digital content and networking solutions. Some of its products and services include professional and consumer software applications, iOS operating systems, iPad, iPhone, Apple TV, iCloud, Mac OS X Operating System, storage devices, headphones, printers and iPod (Market Watch, 2011, para.1).

In its operation, the firm has integrated the concept of internationalization which has enabled it to venture in different markets. By September 24, 2011, Apple Incorporation had established 357 retail stores of which 112 of the stores were located in the international market while 245 were in the US. One of the ways through which it has attained this is by establishing value-added resellers, retail and wholesale stores in different markets. Some of the markets which it has ventured include the Americas, Asia-Pacific, Japan and Europe (Yahoo Finance, 2012, para. 1). The firm has managed to develop a relatively large human resource base in an effort to attain efficiency in its operation. Currently, the firm has employed 60,400 full time employees (Yahoo Finance, 2012, para. 1). The company has an effective management team which is composed of a number of executives headed by Timothy Cook as the Chief Executive Officer. The other executives include Eddy, Cue, Scott Forstall, Jonathan, Eve, Bob Mansfield, Peter Oppenheimer, Phillip W. Schiller, Bruce Sewell and Jeff, Williams. The company’s Board of Directors is composed of Arthur, Levinson, Albert Gore, Bill Campbell, Robert A. Iger, Millard Drexler, Timothy Cook, Andrea Jung and Ronald D. Sugar (Apple Incorporation, 2012, p.1).In its operation, Apple Incorporation faces intense competition from three main industry players which include Google Incorporation, Hewlett-Packard Company and Research In Motion Limited. The objective of this paper is to evaluate the performance of Apple Incorporation with regard to its financial performance. This is achieved by comparing the firm’s performance with that of Google Incorporation.

Comparison of Financial statements

Figure 1: Apple Incorporation Income statement For the year ending September 24, 2011

Total revenue108,249,000
Cost of revenue64,431,000
Gross Profit43,818,000
Operating expenses
Research and development2,429,000
Selling and administrative cost7,599,000
Total operating expenses10,028,000
Operating Income or Loss33,790,000
Income from continuing operations
Total other income /expenses net415,000
Earnings Before Interest and Tax34,205,000
Interest expense0
Income before tax34,205,000
Income tax expense8,283,000
Minority interest
Net Income from continuing operations25,922,000
Non-recurring Events
Discontinued Operations
Extraordinary Items
Effects of Accounting Changes
Other items
Net Income25,922,000
Amount in thousand $

Figure 2: Google Incorporation Income Statement for the year ending December 31, 2011

Google Incorporation, Amount in thousand $
Total revenue37,905,000
Cost of revenue13,188,000
Gross Profit24,717,000
Operating expenses
Research and development5,162,000
Selling and administrative cost7,813,000
Total operating expenses0
Operating Income or Loss11,742,000
Income from continuing operations
Total other income /expenses net584,000
Earnings Before Interest and Tax12,326,000
Interest expense0
Income before tax12,326,000
Income tax expense2,589,000
Minority interest0
Net Income from continuing operations9,737,000
Non-recurring Events0
Discontinued Operations
Extraordinary Items0
Effects of Accounting Changes0
Other items0
Net Income9,737,000

Figure 3: Apple Incorporation Balance Sheet

Period EndingSep 24, 2011Sep 25, 2010Sep 26, 2009
Assets
Current Assets
Cash And Cash Equivalents9,815,00011,261,0005,263,000
Short Term Investments16,137,00014,359,00018,201,000
Net Receivables13,731,00011,560,0006,192,000
Inventory776,0001,051,000455,000
Other Current Assets4,529,0003,447,0001,444,000
Total Current Assets44,988,00041,678,00031,555,000
Long Term Investments55,618,00025,391,00010,528,000
Property Plant and Equipment7,777,0004,768,0002,954,000
Goodwill896,000741,000206,000
Intangible Assets3,536,000342,000247,000
Accumulated Amortization
Other Assets3,556,0002,263,0002,011,000
Deferred Long Term Asset Charges1,727,000
Total Assets116,371,00075,183,00047,501,000
Liabilities
Current Liabilities
Accounts Payable23,879,00017,738,0009,453,000
Short/Current Long Term Debt
Other Current Liabilities4,091,0002,984,0002,053,000
Total Current Liabilities27,970,00020,722,00011,506,000
Long Term Debt
Other Liabilities10,100,0005,531,0003,502,000
Deferred Long Term Liability Charges1,686,0001,139,000853,000
Minority Interest
Negative Goodwill
Total Liabilities39,756,00027,392,00015,861,000
Stockholders’ Equity
Misc. Stocks Options Warrants
Redeemable Preferred Stock
Preferred Stock
Common Stock13,331,00010,668,0008,210,000
Retained Earnings62,841,00037,169,00023,353,000
Treasury Stock
Capital Surplus
Other Stockholder Equity443,000-46,00077,000
Total Stockholder Equity76,615,00047,791,00031,640,000
Net Tangible Assets72,183,00046,708,00031,187,000

Figure 4: Google Incorporation Balance Sheet

Period EndingDec 31, 2011Dec 31, 2010Dec 31, 2009
Assets
Current Assets
Cash And Cash Equivalents9,983,00013,630,00010,198,000
Short Term Investments34,643,00021,345,00014,287,000
Net Receivables6,387,0005,261,0003,845,000
Inventory
Other Current Assets1,745,0001,326,000837,000
Total Current Assets52,758,00041,562,00029,167,000
Long Term Investments790,000523,000129,000
Property Plant and Equipment9,603,0007,759,0004,845,000
Goodwill7,346,0006,256,0004,903,000
Intangible Assets1,578,0001,044,000775,000
Accumulated Amortization
Other Assets499,000442,000415,000
Deferred Long Term Asset Charges265,000263,000
Total Assets72,574,00057,851,00040,497,000
Liabilities
Current Liabilities
Accounts Payable7,148,0006,137,0002,462,000
Short/Current Long Term Debt1,218,0003,465,000
Other Current Liabilities547,000394,000285,000
Total Current Liabilities8,913,0009,996,0002,747,000
Long Term Debt2,986,000
Other Liabilities2,199,0001,579,0001,704,000
Deferred Long Term Liability Charges331,00035,00042,000
Minority Interest
Negative Goodwill
Total Liabilities14,429,00011,610,0004,493,000
Stockholders’ Equity
Misc. Stocks Options Warrants
Redeemable Preferred Stock
Preferred Stock
Common Stock20,264,00018,235,00015,817,000
Retained Earnings37,605,00027,868,00020,082,000
Treasury Stock
Capital Surplus
Other Stockholder Equity276,000138,000105,000
Total Stockholder Equity58,145,00046,241,00036,004,000
Net Tangible Assets49,221,00038,941,00030,326,000

Figure 5: Cash flow statement

Apple Incorporation, Amount in thousand $
Period EndingSep 24, 2011Sep 25, 2010Sep 26, 2009
Net Income25,922,00014,013,0008,235,000
Operating Activities, Cash Flows Provided By or Used In
Depreciation1,814,0001,027,000734,000
Adjustments To Net Income4,036,0002,319,0001,750,000
Changes In Accounts Receivables-1,791,000-4,860,000-353,000
Changes In Liabilities8,664,0008,302,000452,000
Changes In Inventories275,000-596,00054,000
Changes In Other Operating Activities-1,391,000-1,610,000-713,000
Total Cash Flow From Operating Activities37,529,00018,595,00010,159,000
Investing Activities, Cash Flows Provided By or Used In
Capital Expenditures-4,260,000-2,005,000-1,144,000
Investments-32,464,000-11,075,000-16,046,000
Other Cash flows from Investing Activities-3,695,000-774,000-244,000
Total Cash Flows From Investing Activities-40,419,000-13,854,000-17,434,000
Financing Activities, Cash Flows Provided By or Used In
Dividends Paid
Sale Purchase of Stock831,000912,000475,000
Net Borrowings
Other Cash Flows from Financing Activities-520,000-406,000-82,000
Total Cash Flows From Financing Activities1,444,0001,257,000663,000
Effect Of Exchange Rate Changes
Change In Cash and Cash Equivalents-1,446,0005,998,000-6,612,000
Currency in USD.

Figure 6: Cash flow statement Google Incorporation

Dec 31, 2011Dec 31, 2010Dec 31, 2009
Net Income9,737,0008,505,0006,520,000
Operating Activities, Cash Flows Provided By or Used In
Depreciation1,851,0001,396,0001,524,000
Adjustments To Net Income2,347,0001,279,000786,000
Changes In Accounts Receivables-1,156,000-1,129,000-504,000
Changes In Liabilities2,048,0001,444,000728,000
Changes In Inventories
Changes In Other Operating Activities-262,000-414,000262,000
Total Cash Flow From Operating Activities14,565,00011,081,0009,316,000
Investing Activities, Cash Flows Provided By or Used In
Capital Expenditures-3,438,000-4,018,000-810,000
Investments-13,349,000-7,956,000-7,101,000
Other Cash flows from Investing Activities-2,254,0001,294,000-108,000
Total Cash Flows From Investing Activities-19,041,000-10,680,000-8,019,000
Financing Activities, Cash Flows Provided By or Used In
Dividends Paid
Sale Purchase of Stock-801,000
Net Borrowings726,0003,463,000
Other Cash Flows from Financing Activities-5,000294,000143,000
Total Cash Flows From Financing Activities807,0003,050,000233,000
Effect Of Exchange Rate Changes22,000-19,00011,000
Change In Cash and Cash Equivalents-3,647,0003,432,0001,541,000
Currency in USD.

From figure 1, Apple Incorporation’s total revenue during its 2011 fiscal year amounted to $108.249 billion while its cost of revenue amounted to $64.431 billion. As a result, the firm earned a gross profit of $ 43.818 billion. The firm’s operating income amounted to $ 33.79 billion which was obtained after subtracting operating expenses which amounted to $10.028 billion. After subtracting the income tax expense, the firm’s net income amounted to $ 25.922 billion.

On the other hand, figure 2 shows that Google’s total revenue amounted to $ 37.905 billion while its cost of revenue amounted to $13.188 billion giving a gross profit of $ 24.717 billion. The gross profit was further reduced to $ 11.742 billion as the operating income after subtracting operating expenses amounting to $12.975 billion. After subtracting interest and taxes from earnings before interest and tax, Google’s net income amounted to $ 9.737 billion.

From figure 3, it is evident that Apple Incorporation experienced an increment in the size of its total assets from $ 75.183 billion in 2010 to $ 116.371 billion in 2011. This represents a growth with a margin of 54.78%. The firm’s total liabilities increased from $ 27.392 billion to $ 39.756 billion during the same period which represents a 31.1% growth. Similarly, total stockholders’ equity increased with a margin of 60.3% from $47.791 billion in 2010 to $ 76.615 billion in 2011. Google’s total assets increased from $57.851 billion in 2010 to $72.574 billion in 2011 as illustrated figure 4. This represents a 25.4% growth. Its total liabilities increased from $ 11.61billion in 2010 to $14.429 billion in 2011 which represents a 24.3% growth. Google’s total stockholders’ equity amounted to $ 58.145 billion in 2011 up from $ 46.241 in 2010 which represents a 25.7% growth.

During their 2011 fiscal year, both Apple and Google experienced negative cash flows as illustrated by the cash flow statements in figure 5 and 6. This is evidenced by the change in their cash and cash equivalent for the year. Apple Incorporation’s change in cash and cash equivalent amounted to $(1.446) billion while that of Google Incorporation amounted to $(3.647). This means that the rate of earning to spending by the two companies was low. However, Apple Incorporations rate of earning to spending was relatively high compared to that of Google.

Financial ratios

RatioCompany200920102011
Liquidity ratio (Dollars are in billions)
Cash ratio(Cash+ Cash equivalent) ÷ Current LiabilitiesApple$5.263÷$11.506
=0.46
$11.261/$ 20.722
=0.54
$9.81÷$27.970
=0.35
Google$10.198/$2.747
=3.71
$13.63/$9.996 =1.36$9.983/$8.913
=1.12
Current ratioCurrent Asset ÷ (Current Liabilities)Apple$31.555/$47.501
= 0.66
$41.678/$20.722
=2.01
$44.988/$27.97
=1.61
Google$29.167/$2.747
=10.62
$41.562/$9.996
=4.16
$52.758/$ 8.913=
5.92
Quick ratio(Cash and equivalents + short term investment + account receivable)/Current LiabilitiesApple$29.656/$11.506= 2.6$37.18/$20.722=1.8$39.683/$27.97=1.4
Google$28.33/$2.747=10$40.236/$9.996=4$51.013/$8.913= 5.7
Profitability ratio
Return on Asset(Net income + Interest expense ) ÷ Total assetsApple$8.235/$47.501
=0.17
$14.013/$75.183
0.19
$25.922/$116.371
=0.22
Google$6.52/$40.4497=0.16$8.505/$57.851=0.15$9.737/$72.574=0.13
Return on equityNet Income /Shareholder’s equityApple Inc.$8.235/$31.64=0.26$14.013/$47.791=0.29$25.922/$76.615=0.34
Google$6.52/$36.004=0.18$8.505/$46.241=0.18$9.737/$58.145=0.17
Profit marginNet income/SalesApple$8.235/$42.905
=0.19
$14.013/$65.225
=0.21
$25.922/$108.249
=0.24
Google$6.52/$23.651=0.28$8.505/$29.321=0.29$9.737/$37.905=0.26
Debt Ratio
Debt to equityTotal liabilities/Share-holders’ equityApple$15.861/$31.64=
0.12
$27.392/$47.791=0.57$37.756/$76.615=0.49
Google$4.493/$36.004=0.12$11.61/$46.241=0.25$14.429/$58.145=0.25
Debt ratioTotal assets/Total debtsApple32.54
Google21.43
Asset utilization
Inventory turnoverCost of goods sold/Current period inventoryApple$25.683/$455
=0.06
$ 39.541/$1,051=0.04$64.431/$776
=0.08
Google
Accounts receivable turnoverNet credit sales /Average accounts receivables

Comparison of Five year averages

Google IncorporationApple Incorporation
Return on equity17.3%29.5%
Return on assets14.6%18.6%
Gross profit margin68.7%40.5%
Total Debt to equity ratio0.020.00
Post profit tax margin25.7%20.7%

By comparing the five year averages of the two companies, it is evident that Apple Incorporations’ performance over the past five years has been very effective. Apple Incorporation has a beta value of 0.92 compared to that of Google Incorporation which is 0.97. This means that the Apple Incorporation’s shares have a relatively low degree of market risk compared to that of Google.

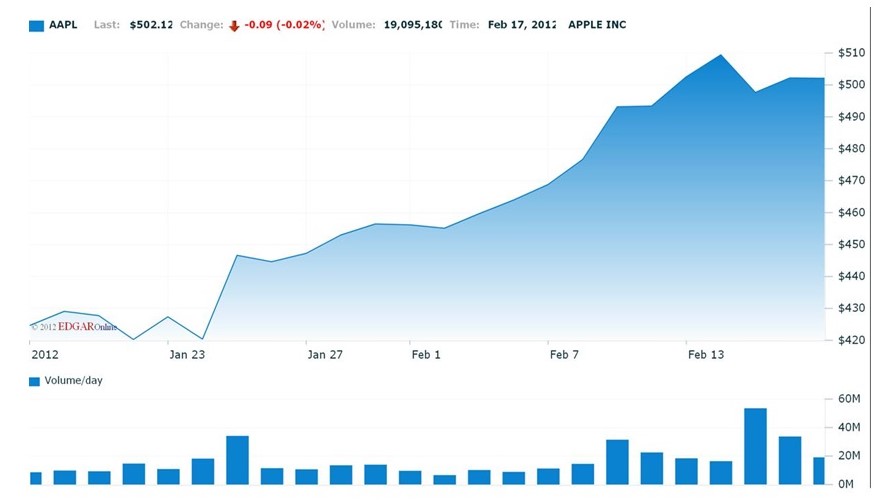
Additionally, the price of Apple Incorporation’s share has been increasing over the past few years as illustrated in appendix 1. Currently, Apple’s share price has been on an upward trend as illustrated by the chart below. The graph below shows that the price of Apple’s shares has been on an upward trend during the first few months of 2012.

Apple’s shares

Conclusion

Analysis of the two company’s financial statements shows that Apple’s financial performance is better than that of Google Incorporation. This is further enhanced by analysis of the financial ratios. For example, Apple Incorporation’s rate of return on equity is relatively high compared to that of Google Incorporation. This means that Apple Incorporation is more effective in utilizing the shareholder’s equity thus translating to a higher profitability compared to Google. Apple’s return on assets is relatively high compared to that of Google. This shows that the management team of Apple Incorporation is effective in ensuring that the firm’s assets are effectively utilized in order to generate high returns. Analysis’ of the companies’ liquidity ratios shows that the two companies can be able to meet their current financial obligations more effectively. Additionally, an analysis of the historical share price indicates that the price of Apple Incorporation share has been increasing over the years as illustrated by appendix 1.

Recommendations

From the analysis of Apple Incorporation financial performance, I would advise investors to consider purchasing Apple Incorporation’s shares. This arises from the fact that there is a high probability of the shares continuing to experience positive performance considering the firm’s current financial performance. As a result, investors will be able to maximize their wealth.

Reference List

Market Watch. (2011). Annual financial for Apple Incorporation. Web.

Yahoo Finance. (2012). Google Incorporation. Web.

Yahoo Finance. (2012). Apple Incorporation. Web.

Cite this paper

Select style

Reference

BusinessEssay. (2024, April 13). Apple Incorporation Financial Performance. https://business-essay.com/apple-incorporation-financial-performance/

Work Cited

"Apple Incorporation Financial Performance." BusinessEssay, 13 Apr. 2024, business-essay.com/apple-incorporation-financial-performance/.

References

BusinessEssay. (2024) 'Apple Incorporation Financial Performance'. 13 April.

References

BusinessEssay. 2024. "Apple Incorporation Financial Performance." April 13, 2024. https://business-essay.com/apple-incorporation-financial-performance/.

1. BusinessEssay. "Apple Incorporation Financial Performance." April 13, 2024. https://business-essay.com/apple-incorporation-financial-performance/.


Bibliography


BusinessEssay. "Apple Incorporation Financial Performance." April 13, 2024. https://business-essay.com/apple-incorporation-financial-performance/.