Introduction
The main aim of cost management is to reduce operational costs alongside improving customers’ satisfaction; to attain this objective, management accountant’s needs to come up with programs and policies that enhance the attainment of the two agendas. When coming up with the cost management strategies, they need to follow a deductive approach of thinking where they reason from the known position to the unknown or expected better position. This implies that when making costing decisions, the managers involved should be conversant with the costs incurred and how they relate to the business at hand (Ray, Eric, Brewer, 2009). Different costs applications are referred to as cost drivers; cost drivers are the areas of summing up where costs can be ascertained from. Samsung has two main cost drivers classified under their products nature: laptop and mobile phones sector. The laptop segment was introduced recently as an effort to meet the rising demands for laptops in the world; the age and development of the sector make it venerable to high costs (Horngren, 2009). This paper addresses how the company can use cost management tools to reduce its costs as it enhances quality products development and creates customer satisfaction.
Routine cost reports
At Samsung, production of laptops is done using batches where a certain period of time is expected to accomplish a certain volume of work; management accountants are expected to make regular route cost reports that analyse how different processes are faring or the usage of resources in a certain segment. The routine reporting is made on structured forms that determine the flow of processes within the production plants; the following is a hypothetical route report that can be used in the company for the manufacture of a bunch of fifty laptops:
(Please see appendix 2 for sample product cost management chart).
With the above analysis made periodically, the management will be able to analyse the situation in the company and determine the effect or the areas of inefficiency: in the above routine cost report the following can be interpolated and offer a good background to improve the costs in the company:
Units produced
The units produced are lesser than the expected units that the segment should be producing: the reasons behind this production should be ascertained, some of the possible reasons for the low production assuming that the department had the potential include low motivated staffs, inefficient machinery, high wastage and poor-quality inputs.
Materials used
The above routine cost report shows that the materials that had been allocated for the manufacture of 50 units of laptops have been utilized to make only 45; this implies that there has been a wastage of materials that would have been used to make 5 laptops. This is an indication of a manufacturing process that is inefficient, has high wattage or the quality of the materials was not up to the required standard (Jawahar, 2008).
Labour units
One interesting parameter noted in the routine cost report above is that the segment utilized low units of labour than it had been allocated; this is an indication that the allocation of duties was not effective thus some people have minimal input they are making. The management should ensure that it understands the input by its human capital to match them with the task they are to undertake, overstaffing increases the cost of production.
Machine hours
The machine hours by the unit are higher than the allocated time despite having produced lesser products; this is an indication that the efficiency of the machinery is wanting; it is upon the management to improve the production rate of the machines to avoid such moves in the future; improvement may mean embarking on high maintenance or getting mew machinery all together (Jiambalvo, 2007).
Indicators of productivity, efficiency, and effectiveness
To evaluate the rate of productivity of a business, there are different productivity, efficiency and effectiveness indicators; in the case of Samsung (as the case would be for any other company), the following are the main key indicators:
Production capacity
In an ideal situation, a company’s productivity should meet the expectations set by its goals and objectives; the expectations are made after careful analysis of the potential of a company by the management. With effectiveness and enhanced productivity, the rate at which the set targets are attained should be improved and made easier. For instance, in the routine cost report above, with effective management, then the department should have been able to make 50 laptops using 400 units of labour. This would have indicated efficiency and specialisation by the human capital. Care should be taken when evaluating productivity not to concentrate on the reduction of materials since some products may call for the use of certain units of materials at any one time. However, with time there should be innovation and invention of better combinations and better materials to be used in production (Weygandt, Kimmel and Kieso, 2009).
Output quality
Cost management has the task of ensuring that costs have been reduced as the quality of products improves; when quality is increasing at decreasing rate of costs or at a constant rate of costs, then the productivity, efficiency and effectiveness of the processes are improving. Output quality can be learnt from the response that the customers are giving to the company; when the customers are satisfied then the productivity is effective, this can be seen from improved demand for the products and positive responses.
Usage charges and staff’s outputs
With improved productivity, effectiveness and efficiency, company usage charges are more likely to go downwards; this means that the company is benefiting from effectiveness and flow of activities. In the case of Samsung, the labour units required for the production of a unit product (laptop) may be reduced; this is an indication that the company has an improved production.
Revenue and contribution margin
The contribution margin of a unit product can be improved by increasing the price of the product or reducing the cost of production:
Contribution = price of the commodity fewer variable costs
If the price that the commodities are sold remains constant, yet the contribution margin increases, then the company is having an improved production efficiency.
For example, if one unit of laptop has a contribution margin of $100 when sold at $2000, then with efficiency the same unit should be able to have a contribution margin of say $150 when sold at the same cost (Don and Mowen, 2006).
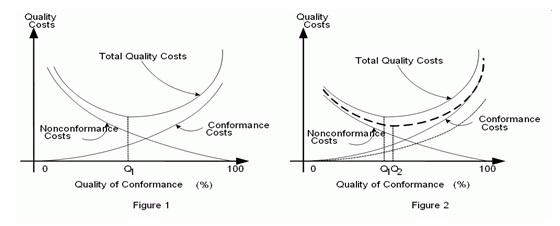
The principle of quality and value
Management scholars agree that quality is not an accident, it is the result of deliberate moves of high intentions, intelligent direction, skilful execution and sincere efforts by management to ensure that the quality at a particular time is better than the quality that future products will have.
In manufacturing or service companies, the equation for quality and value remains the same as:
Quality= Cost + Satisfaction + outcome = Value.
The above equation gives the main components and variable for costs they are as follow:
Costs
To come up with finished products, there is a cost that a company has to incur as a result; for quality, the costs attributed to certain commodities should be the exact costs that were incurred in the production of the commodity; with time it is crucial to improve the efficiency of the production method so as to reduce the cost of production. In the case of Samsung, the management should come up with policies that reduce the costs of inputs to improve on the cost incurred in the production (Maher, Stickney and Roman, 2006).
Satisfaction
When deciding on the commodity to buy, customers are more concerned with the level of utility they are likely to derive from the quality of the products is only improved when the customer’s needs have been satisfied; for quality and value improvement a company should always aim at offering products that offer higher utility than the utility expected by the customer.
Outcomes
The outcome is in relation to the product nature and quality; an effective quality management system should ensure that the final products are of higher quality than the case was in the previous production. Products should easily be differentiated from those offered by a competitor in terms of the utility that the customer gets from them. For instance, Samsung should ensure it has products with longer battery life than the case is with other companies in the same industry; this will enhance product differentiation (Carter, 2005).
When the above three parameters of quality are looked into, then the company can be said to be on track to improving its quality (please see appendix 3 for quality-value relationship).
Identify and propose potential improvements
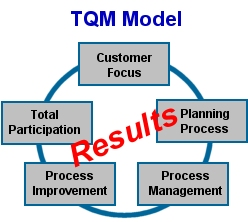
To enhance improved costs management systems, Samsung should employ total quality management systems and have a Six Sigma policy within its operational frameworks. Total Quality Management (TQM) and Six Sigma policy are the activities in the management function that influence the quality of policies, cost management, waste reduction, managerial responsibilities, objectives and their implementation through quality control, quality planning and quality improvement. Most organizations are focusing on the quality improvement process than on the product itself. In other terms, a quality management system is the process of quality improvement where skills are used to add value to the quality of the products and enhance their future. This is done to retain present customers and welcome new ones (Warren, James and Duchac, 2008).
In almost all organizations, the production process has been modified in order to ensure quality improvement as costs are managed. Total quality management involves managing processes for the desired benefit. It involves structuring and controlling all processes involved in an organization so that they give effective results. Large and complex processes are normally broken down into small and inter-related processes for easy management. In doing this, one has to take into consideration, the time and the budget allocated to the specific processes (please see the model of TQM in appendix 1).
Six Sigma and total quality management consist of competitive moves and business approaches aimed at producing successful performance; it is a management’s “game plan” for running the business, strengthening a firm’s competitive position, satisfying the customers, the stakeholders, shareholders, and the staffs. It seeks to develop the way into which all those that are a party to the business get satisfied. It aims at going a step further and satisfying the customers beyond their expectations. There is a lot of focus on the customer; the customer is the greatest asset that an organization can have. To get customers loyalty is the dream of every business and that’s what most businesses target. Compliance with TQM is one of the key factors required for the improvement of quality (Bragg, 2001).
Conclusion
For effective cost control with enhanced value addition, leaders should develop appropriate strategies that suit their organisational needs; an effective cost management policy leads to efficiency in production and improves customer satisfaction through the production of affordable high-quality commodities. In a contemporary business environment, leaders need to approach cost management issues from a wholesome angle where they focus on improving all sectors that have costs regardless of whether the cost is fixed or flexible.
References
Bragg, M.(2001).Cost accounting: a comprehensive guide. New York: John Wiley and Sons.
Carter, K. (2005). Cost Accounting. New Jersey: Cengage Learning.
Don, R. and Mowen, M. (2006). Managerial Accounting. New Jersey: Cengage Learning.
Horngren, T. (2009). Cost accounting: a managerial emphasis. Pearson Prentice Hall.
Jawahar, L. (2008). Cost Accounting. New Jersey: Tata McGraw-Hill Education.
Jiambalvo, J. (2007). Managerial Accounting. New York: John Wiley and Sons.
Maher, M., Stickney, P. and Roman, L. (2006). Managerial accounting: an introduction to concepts, methods, and uses. New Jersey: Cengage Learning.
Ray, H., Eric, W., Brewer, P.(2009). Managerial Accounting London: McGraw-Hill/Irwin.
Warren, C., James, M. and Duchac, J.(2008). Managerial Accounting. New Jersey: Cengage Learning.
Weygandt, J., Kimmel, P. and Kieso, D. (2009). Managerial Accounting: Tools for Business Decision Making. New York: John Wiley and Sons.
Appendixes
Appendix 1
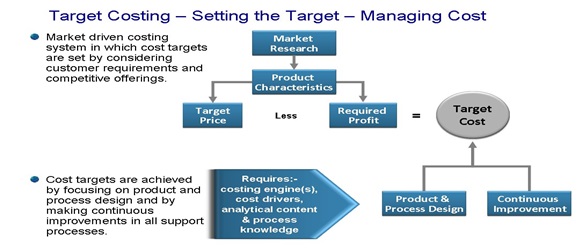
Appendix 2: sample of target costing approach
Appendix 3: quality and cost management