Introduction
David Jones Limited is a leading chain of high-end departmental stores. The corporate history dates back to 1838. Its head office is located in Sydney, Australia. The company presently operates 35 stores. It has a strong distribution network with two warehouses. The company also sells high-end products through its online portal. The company sells fashion, beauty, home décor, and gift products (The Story of David Jones, 2014). The company is a publicly listed company and its shares are listed on the Australian Securities Exchange (ASX). The ticker symbol of the company is DJS. The current share price is $3.94 (David Jones Ltd (DJS.AX), 2014).
The company reported revenues of $1,845 million and profit after tax of $101.55 million in 2013. In the last few decades, the company experienced phenomenal growth in the luxury retailing industry. However, its success was not without trials and tribulations.
Like every other business, the company’s operations face risks that require careful handling through effective and efficient risk management policies and practices (Petty, et al., 2012). The current report discusses different types of risks and provides examples of risks faced by David Jones Limited in recent years. Moreover, it evaluates the relationship between return and risks using the price data of DJS and the S&P/ASX 200 index. The analysis also provides recommendations for shareholders for investing in the company’s stocks.
Systematic and Unsystematic Risks
There are two types of risks that shareholders must consider when making investment decisions. Firstly, unsystematic risk is the risk related to a stock that could be diversified away by holding a diversified portfolio. Since a diversified portfolio consists of many stocks at a time, therefore, the risk associated with one stock can be diversified away (Petty, et al., 2012). Therefore, it could be suggested unsystematic risk is related to a single entity or an industry. Unsystematic risk is also referred to as diversifiable risk and residual risk. A well diversified portfolio consists of stocks of different companies that are operating in different industries. Moreover, a diversified portfolio may contain other types of securities such as treasury bills and municipal bonds (Gitman, Juchau, & Flanagan, 2011).
Some examples of unsystematic risk include an entry of a new competitor in the industry, changes in the industry regulation and policy, a legal complaint lodged by the plaintiff, product recalls, etc. Fouque & Langsam (2013) made a distinction between observed and unobserved risk factors. They indicated that unobserved risk factors are related to unsystematic risks. These factors do not affect the entire market. They are specifically related to one company and its stocks listed on the equity market. Such factors are not observed by the entire market and only those holding the company’s stocks are affected by them.
Secondly, systematic risk is referred to the risk that is related to the entire market that could not be diversified away. It is also known as undiversifiable risk or market risk (Petty, et al., 2012). The risk cannot be completely diversified away because it is not related to a particular stock or an industry. It s not possible to predict systematic risks and, therefore, they could not be avoided even within a diversified portfolio. Some analysts suggest that changes in the value of a portfolio resulting from systematic risks can be somewhat limited by investing in different financial instruments. For example, it can be managed by investing in bonds and stocks (Peirson, Brown, Easton, Howard, & Pinder, 2011).
In this case, the interest rate change that will lower the value of bonds will make an investment in stocks more attractive to investors. Fouque & Langsam (2013) are of the view that observed risk factors are related to systematic risks that affect the entire market segment. Therefore, systematic risk factors are related to the entire market that is observed by all participants. Some of these factors include adverse economic and monetary conditions, unfavorable changes in interest rates, an increase in inflation, and wars.
Examples of Systematic and Unsystematic Risks
Unsystematic Risk
- In 2013, the company faced unsystematic risk as to its competitor, Myer Holdings Ltd., attempted its hostile takeover. Myer Holdings Ltd. is a direct competitor of David Jones Limited. In recent years, David Jones Limited experienced a decline in its store sales and it failed to rejuvenate customers’ interests in the company and its offerings. Its weak business pushed down its stock value (Janda, 2013), which allowed Myers Holdings Ltd. to launch a hostile takeover against the company.
- In recent years, the company faced tough competition from international retailers. In 2012, an international fashion retailer ‘TopShop” made an entry into the Australian market (Topshop’s top-notch entry into the Australian market, 2012). It is considered an unsystematic risk faced by David Jones Limited, which was already experiencing a decline in its sales. Moreover, there are several other international retailers that have planned to open up their stores in Australia including H&M, Banana Republic, Zara, etc. These international retailers are threatening the future of David Jones Limited’s business.
Systematic Risk
- In 2009, the Reserve Bank of Australia increased its cash rate by 25 points to 3.25% (Wssener & Foley, 2009). The increase in the cash rate increased the cost of borrowing by banks. The increase in the cash rate did not have any direct effect on the capital market. Instead, it affected individuals and businesses. The increase in the cash rate led to high borrowing costs that reduced consumers’ spending on credit cards. It affected all companies and their stocks listed on the capital market (Petty, et al., 2012).
- After the recent financial crisis in the US, the Australian Dollar gained value against the US Dollar. Its value reached USD-AUD parity in 2011 (Morley, 2012). The increase in the value of the Australian Dollar not only affected retailers but also exporters and the local tourism industry (Morley, 2012). In particular, rising Australian Dollar value made online shopping cheaper for customers, which negatively affected companies including David Jones Limited.
Comparison of Return and Risks
David Jones Limited is listed on ASX. This section of the report evaluates returns and risks associated with DJS and the S&P/ASX 200 index. The S&P/ASX 200 index is based on “weighted and float-adjusted market capitalization” of the 200 largest stocks that are eligible for listing (S&P/ASX 200, 2014). The data pertaining to DJS and the S&P/ASX 200 index was collected on a monthly basis for an eight-year period starting from January 2006 to January 2014. The descriptive analysis of data is summarized in the following table. These findings are discussed in this report to investigate the relationship between return and risks.
Table 1: Descriptives of DJS and S&P/ASX 200.
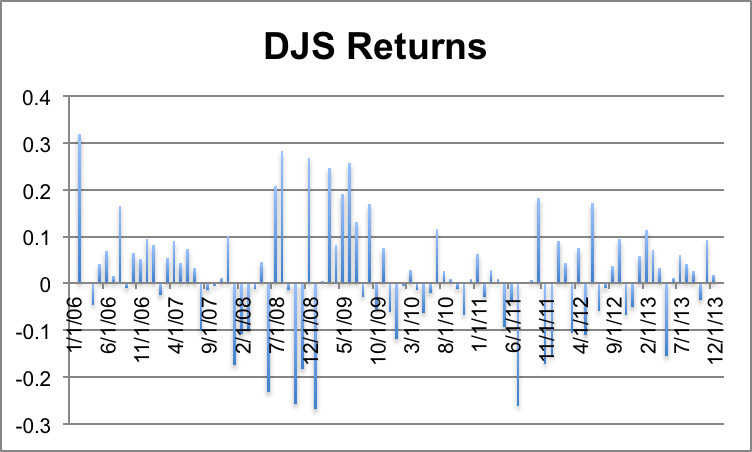
The prices of DJS were $1.32 and $3.02 on January 2, 2006 and January 1, 2014 respectively. The highest recorded price of DJS was $4.40 on November 2, 2009. Therefore, the range of the company’s stock price was $1.32 – $4.40. The standard deviation (beta) of the company’s stock return was 11.4591%. The average monthly return calculated in an eight-year period was 1.5191%. The monthly returns indicated a largest positive change of 31.82% in the share price recorded on February 1, 2006.
The corresponding change in the S&P/ASX 200 index level was 4.23% on February 1, 2006. Similarly, a significant negative change of $26.25% was recorded on July 1, 2011. The corresponding change in the S&P/ASX 200 index level was -3.98% on July 1, 2011. The changes observed in the stock price and the market index reflected a positive correlation between them. The positive correlation implied that when there was a positive change in the market index level then an increase in the share price was also recorded (Peirson, Brown, Easton, Howard, & Pinder, 2011). The following graphs show the company’s stock prices over an eight-year period.
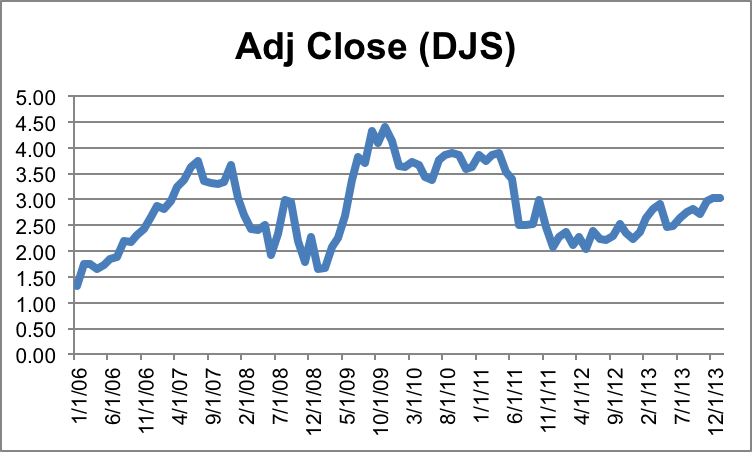
The following graph depicts changes in stock prices of David Jones Limited in the last eight years.
The above graph indicates a sharp decline in the company’s stock in 2008 as the retail sector of Australia was badly affected by the financial crisis in the US.
The levels of S&P/ASX 200 index were recorded at 4929.60 and 5367.20 on January 2, 2006, and January 1, 2014, respectively. The highest index level was 6754.10 recorded on October 1, 2007. The corresponding price of DJS was $3.29 on the same date that indicating a decline of -0.60% on a monthly basis. The lowest index level was 3344.50 recorded on February 2, 2009. The corresponding price of DJS was $1.67 on the same date that indicating an increase of 0.60% on a monthly basis.
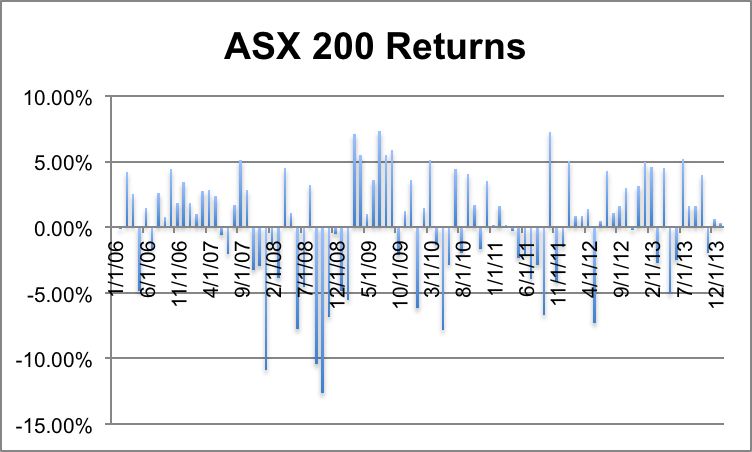
The range of the index level in the last eight years was 3344.50-6754.10. The monthly returns indicated a major positive change of 7.31% in the index level price on July 1, 2009. The corresponding change in the price of DJS was 13.06% on July 1, 2009. Similarly, the biggest negative change of $12.25% was recorded on October 1, 2008. The corresponding change in the price of DJS was -25.76% on October 1, 2008. The average monthly return on the S&P/ASX 200 level was 0.1772% and the standard deviation was 4.1850%. The following graphs show the index level and percentage changes in the index level of the S&P/ASX 200 in the last eight years.
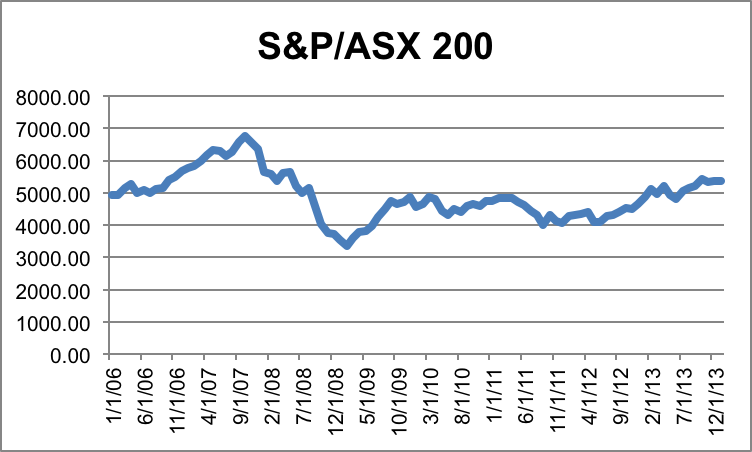
The figure highlights a major decline in 2008 as an outcome of the recent financial crisis in the US and poor economic conditions in leading economies.
Earlier studies including Sharpe (1964), Lintner (1965), and Black (1972) suggested that there is a positive linear relationship between average stock returns and beta. However, recent evidence suggested that there is no clear relationship between average stock returns and beta (Nimal & Fernando, 2013). The risk-return ratio of DJS was 7.54. Similarly, it was 23.61 for the market index. The risk-return ratio identified a trade-off between risk and return. The trade-off between risk and return suggests that stocks with low beta (riskiness) offer low returns. On the other hand, stocks with higher beta offer a high return to shareholders (Gitman, Juchau, & Flanagan, 2011).
On the basis of risk-return analysis, it could be suggested that there be a positive relationship between average return and standard deviation (Ibbett, 2012). Moreover, it could be noted that the S&P/ASX 200 index, which has 200 leading stocks of companies from different industries, had a low beta value. The low beta value of the market index supported the discussion of unsystematic risk included in this report, which highlighted that a well-diversified portfolio helps in reducing the overall risk.
Conclusion and Recommendation
In order to conclude the above discussion, it could be highlighted that there are two types of risks faced by individuals, investors, and businesses. These are namely systematic and unsystematic risks. Systematic risk is non-diversifiable and unsystematic risk is diversifiable. On the basis of return and risks analysis of David Jones Limited and S&P/ASX 200, it could be concluded DJS offered a higher return on investment to shareholders as compared to the diversified portfolio. However, investment in DJS could be considered riskier as compared to the diversified portfolio as its beta value was higher than the market index. On the basis of the investor type and the limited amount available for investment, the following recommendations are made.
- Risk-averse Investor: It is recommended that the investor would be better off by putting all of his/her money in a diversified portfolio. The decision will generate low returns and also limit his/her risk (Petty, et al., 2012).
- Risk-taker investor: It is recommended that the investor would be better off by putting all of his/her money in DJS. The decision will generate high returns at a high-risk level (Petty, et al., 2012).
References
David Jones Ltd (DJS.AX). (2014). Web.
Fouque, J.P., & Langsam, J.A. (2013). Handbook on Systemic Risk. Cambridge: Cambridge University Press.
Gitman, L., Juchau, R., & Flanagan, J. (2011). Principles of managerial finance (6th ed.). Frenchs Forest: Pearson Education Australia.
Ibbett, N. (2012). Financial mathematics for decision making (1st ed.). Australia: Cengage Learning.
Janda, M. (2013). David Jones reports a further fall in sales. Web.
Nimal, P.D., & Fernando, S. (2013). The conditional relation between beta and return: Evidence from Japan and Sri Lanka. The Hikone Ronso, 395, pp. 94-105.
Morley, C. (2012). What part does the Aussie Dollar play in retail’s ‘perfect storm’?. Web.
Peirson, G., Brown, R., Easton, S., Howard, P., & Pinder, S. (2011). Business finance (11th ed.). Sydney: McGraw Hill.
Petty, W., Titman, S., Keown, A., Martin, J., Martin, P., Burrow, M., et al. (2012). Financial management: Principles and applications (6th ed.). Australia: Pearson.
S&P/ASX 200. (2014). Web.
The Story of David Jones. (2014). Web.
Topshop’s top-notch entry into the Australian market. (2012). Web.
Wssener, B., & Foley, M. (2009). Changing course, Australia raises the interest rate. Web.