Introduction
Corporate financial ratios are essential components of financial statement analysis, particularly in security valuation reports. It’s however not clear what constitutes a good financial ratio but in this regard, the essay lists a number of ratios and valuation techniques used across different companies. I included dynamics of internal, operating performance, risks analysis and growth analysis for Foster Company in Australia. As our primary indicator, we empirically investigate three companies; Foster Group limited, AWB and Coca-cola and their and their effects on security valuations. Using financial accounting data from Foster’s operating performance and financial cash flows; we categorized items as available liquidity. In this regard we categorise operating performance (obligatory payments) to include interest payments, income taxes and a net increase (available liquidity) on accounts payables. Net decrease in total debts is on the other hand regarded as obligatory payments while net increase in total debts viewed as available liquidity. Accrued expenses are regarded adjustments to the operating cash flows (Pagan 1996).
To test the effect of Foster’s internal liquidity on security valuations, data from three companies; Foster, AWB and Coca-cola will be examined along with their effects on key economic indicators. In this section we describe key ratios of the sample we studied, demonstrate some useful statistics and discuss the major variables used in the later analysis. Our criterion follows a sample selected from a 10 year period (2000-2009). Our sample from Foster provided information we needed such as cash ratios, free cash flow valuation, Capital Asset Pricing Model and growth analysis (Liao & Tsai 2005; Zivney &Thompson1989).
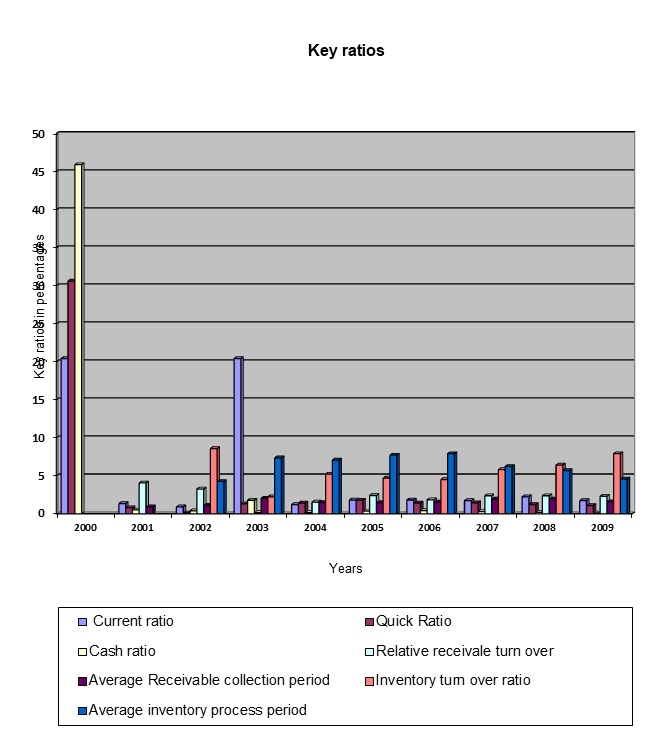
Key ratios
Financial ratios comprise of many different, but related ratios in explaining the relation between their concentration, institutional and efficiency. Internal Liquidity ratios include, Receivable Turnover Ratio, current ratios, inventory turn over ration, quick ratios, average receivable collection period, cash ratios, cash flow from operating ratio, receivable turn over ration, and average inventory ratio among others. To determine their application and effectiveness, industry analysts argue that effective management of resources is very crucial in determining how well companies manage their competitors. In order to mitigate the contradictions of key ratios, data collected from various organisations help explain the impacts of ratios on different levels of the same economy, the importance of their application (if any) and their effects across various sectors of the economy. The analysts add that rations and valuation techniques are important in shaping the regulations and market structure. Since regulations have a great impact on a firm’s margin and overhead expenditures, policy makers and researchers should address the concentration and performance issues to eliminate the imbalances that exist in different companies (Bruner 2009).
Current Ratios
Current Ratio measures a firm’s ability pay its short term debts. Under normal circumstances, 2:3 is considered a good ration and for Foster’s case, current rations between since 2000 and 2001 were 1:3, which indicated the company was in a better position to meet its short term obligations including paying its creditors. Subsequently, when the ratio is higher, for example 3:2 may mean that a company is unable to meet its short tem obligations and a lot of the money may be assets tied up to current assets which is not adequately exploited. The formular is applied as;
Current ration=Current assets/current liabilities
Quick Ratio
Also known as acid-test ratio, Quick Ratio measures only liquidity assets, while excluding inventories to pay its current liabilities. The formular is applied as;
Quick ration= (Cash+ marketable securities +accounts receivables)/Current liabilities.
Quick ratio indicates company’s short term liquidity that be easily converted into cash. It measures a company’s ability to use its quick assets such as cash and cash equivalents, marketable securities and accounts receivables. Quick ratio indicates that a company can easily convert its liabilities into cash to pay its current liabilities. An ideal quick ratio would be 1:1 and in this case, Foster’s quick ratios from 2000 to 2009 remained constant at 1:1 to 1:1.2. If the quick ration is high, then the company is keeping too much cash on hand or may have a problem collecting account receivable. And it may also mean that the company has difficulties borrowing on short-term notes. A quick ratio higher than 1:1indicates that the company can meet its current financial obligations with the available cash on hand. Foster’s quick ratio was lower between 2001 and 2002, a clear indication that the company was relying so much on short tem stock to pay its short term liabilities (Foster’s Brewing Group Limited 2000)
Cash ratio
Cash ratio formular is applied as;
Cash ratio= (Cash+ marketable securities)/current liabilities
Cash ratio indicates company’s short-term liability and its ability to meet them. A company’s ability to use its cash to pay its current financial obligators is however important in company’s daily operations. A preferred ratio would be 0.5:1 or higher (Urbancic 2003). Creditors use this ratio to determine how much credit they would be willing to extend to the company. Foster’s cash ratio was established as 0.5:1 between 2003 and 2004- which simply implied that the company able to pay its financial obligatory within those years.
Cash Flow from Operating Ratio
Urbancic (2003) states that Cash Flow from Operating Ratio “indicates a company’s ability to pay its short term liabilities with cash it produced from current operations” (p.1). Poor receivables or inventory turn over on current and quick ratios would reflect negatively on a firm’s operating ratios. The formular is applied as;
Cash flow from operating ration=cash flow from operations/current liability (Urbancic 2003).
Operating Performance
Operating Performance is measured by dividing operating profit by net sales to arrive and operating profit margin. Provides a more robust indicator of performance based on cash generating ability as based on accrual accounting income. It highlights the timing of cash flows with respect to the timing of sales. Operating performance is used in evaluating cash management performance, credit granting policies and receivable collections. Operating performance also serves as a comparative analysis on companies within the same industry (Urbancic 2003, p.5).
Since a number of variable factors contribute to operating performances, policy makers should monitor these factors that influence performances within company’s industry levels and as well as local levels to eliminate the accumulation of monopoly power which will subsequently slow down the economy. Since the analysis uses net interest margins to measure firm’s competitive advantage, the economic magnitude between companies in our analysis do not show such huge differences. For example, if a company that charge high interest rates decided to cut down on their concentration, net interest would reduce significantly and they would be the same level as local markets
Measuring operation performance of a company is comparatively tied to security concentration and regulatory restrictions which confirm that employing two variables; overhead expenditure and company’s share assets. On a theoretical proposition, the analysis measures of operating performance indicate a relationship between several measures of bank concentration and regulatory restriction, which influence the performances of companies within a given country. Moreover, the linkage that links the correlation between company’s operation performance and return on interest rates runs from increasing firm’s concentration to increasing bank profitability, subsequently boosting the economy. These observations imply that the market-power is a dominating factor in the companies rather the efficient-structure depicted by various researchers and their concentrations rely heavily on their net interest margins and their profitability does not correlate with positively with company’s concentrations Urbancic 2003, p.5).
Accounting ratios analysis helps us build a picture of a company. And in this regard, the quality of the financial information on which ratios are drawn upon is necessary. Poor estimates of depreciation, bad debts may not yield conclusive results to base our analysis on and make accounting ratios to be flaws. Past company performance, form example 10 year accounting period in our analysis may not necessary be best indicator for future performance. It’s also important for investors to see how much profit a company is making in terms of value of assets and level of cash revenues. These figures are useful to an investor who completely rely on the for investment decisions. Therefore financial ratios need to be properly analysed using accounting ratios, then compared to other companies or measured against averages for the same company (Bjerring et al 1983).
Growth analysis
Emery &Garry (2000) states growth analysis as”the maximum rate at which a company grows without changing its financial policies or operations” (p.5). Profitability is the important measure of a company’s success. In this case, my analysis Foster’s income statement/profit and loss account for gross profit and net profit mean very little by themselves but when I expressed them as a percentage of sales, they then become more useful as illustrated below.
A decrease in gross profit percentage ratio may indicate greater competition in the market forcing Foster to sell at lower prices and lower gross profit and probably an increase in the cost of purchase. However, an increase in the gross profit margin means that the company is dominating the markets and may be in a position to exploit the market and probably charge higher prices for its securities or rather its Initial Public Offer (IPO). Between 2000 and 2002, Foster gross profit margin increased tremendously but dropped in 2003, that later picked in the subsequent years. Secondly, the relationship between gross profit margin and net profit margin percentages indicates how well Foster is managing its business expenses. In this case, Foster’s net profit margin decreased for the year ended 2003 and 2008 while gross profit remaining the same during the same years indicated lack of internal control over expenses (Emery &Garry, 2000; Foster’s group Limited 2003; Foster’s group Limited 2008). A company measures its profitability by calculating its sales and earnings growth. Emery &Garry, (2000) further adds that “in order to sustain growth, a company requires to identify its target growth rate at which these pressures arise” (p.6). A company’s sustainable growth rate yield’s investor to invest in a certain company as it’s used as an assessment routine for credit analysis.
Risk Analysis
Emery &Garry (2000) identifies risk Analysis as “factors that may affect the success of a company operation in achieving its goal” (p.7). They add that “risk analysis is computed by first identify the risk then identifying controls identifies the controls that could mitigate the risks” (p.7).
Altman’s Z score
Altman’s Z score also known as Insolvency predictor helps a firm in predicting bankruptcy. It’s a formular that predicts a company will go into bankruptcy within two years. Its formular is computed by using corporate income and balance sheet values as variables for evaluating financial welfare of a company. It’s a linear combination of four to five common business ratios which are weighted by coefficients. Altman’s Z score ability to measure company’s financial strength uses a weighted sum of several factors.
Altman’s Z score= Z = 1.2T1 + 1.4T2 + 3.3T3 + 0.6T4 +.999T5.
Where;
B. Capital Asset Pricing Model (CAPM)
Capital Asset Pricing Model (CAPM) uses variations of discounted cash flows. The formular defines risks in terms of volatility and measure by beta coefficient (Rate of risky returns.
Kc = Rf + beta x (Km – Rf)
Where;
Kc is the risk-adjusted discount rate
Rf is the rate of a “risk-free” investment, i.e. cash;
Km is the return rate of a market benchmark
Beta as denoted by Rf measures returns on risk free investment that is then added to risk of premium then subtracted by Rf
The resultant value which is denoted by Kc is the expected return rate subsequently used for speculation purposes for investment decisions
Key Economic Indicators
Key economic indicators include GDP, money supply, stock options and employment. For example on employment aspect, individual businesses expect high employment figures to increase the purchasing power of its products hence increment in customer base which subsequently increases sales. They have more money to spend and the economy is likely in a growth cycle. High unemployment rates signify low money supply into the markets and company’s sells may decline as a result (Statistics Directorate1996).
GDP
Gross Domestic product is valuable in calculating economic trends. It Indicates how available domestic product will be oversees. Is serves a comparative advantage when a company is likely to have more goods and services to compete more domestically and abroad. In this case, high GDP indicates growth (Statistics Directorate1996).
Stock Option
A publicly traded with upward trends signifies growth and may boost investors’ confidence into investing into the company. This trend however leads to rapid growth attributed from gains invested by stock holders. Foster’s balance date indicated a substantial growth in dividends between 2009 and 2010. Downward trends rapidly loose stockholders and my need to cut down employees and operational costs to stay in business (Statistics Directorate1996; Barber et al 2001, p.533). The accounting theory of stock option represents the operating costs of the company and often considered as a form of compensation. The FASB conceptual framework therefore requires the cost of stock option compensation to be reflected in the income statement and matched against the employee benefits over their service period.
Money Supply
Increase in money supply may indicate an increase in sales and subsequently impact of the firm future growth. Money supply helps in predicting future economic growth. Inflation attributed floating cash in the markets increases pressure on interest rates and lowers the rate of borrowing. Lower interest rates on the other hand may signify high competition in the markets subsequently lowering the cost of borrowing. Statistics Directorate (1996) states that
growth in money supply may also mean increased personal income, which ideally translates to increased personal consumption, and consumer spending will be critical to economic recovery and expansion because additional consumption increases demand and supply. Here inventories become depleted and employers have to hire additional units to keep up with high demand (p.1).
On a theoretical proposition, the analysis measures of interest rates indicate that there is a relationship between several measures of bank concentration and regulatory restriction, which influence the performances of banks within a given State. Moreover, the linkage that links the correlation between money supply and return on interest rates runs from increasing company concentration to increasing firm’s profitability, subsequently boosting the economy. These observations imply that the market-power is a dominating factor in the industry rather the efficient-structure depicted by various researchers and their concentrations rely heavily on their net interest margins and their profitability does not correlate with positively with firms’ concentrations (Bruner 2009).
Industry’s Life Cycle
Stages of industry life cycle starts from introduction stage, growth and maturity stages. Introduction stage is where a company introduces their product to the market. It tries to establish early perception of product quality and aspects such as establishing stronger relationship with its vendors to achieve a competitive advantage and adding technological superiority to build that first image. Foster’s Brewing group first introduced itself into the markets maintained a sustainable value creation by delivering superior qualities in its three products; Beer, Wine and Spirits. The growth stage follows the introduction stage and here changes are made to the product to satisfy customers’ needs and suggestions. Successful implementation of these strategies may yield to growing demand of goods subsequently increasing earnings and profits. Foster Group limited made changes to its products in the year 2000 since its first Balance sheet in 1999 as an internet based order system to increase customer data base. It was also reported to be utilising technology that enabled newer and better business models driven at satisfying customers needs (Foster’s Brewing Group Limited 2000, p.10). These changes had great impacts on sales since the Foster recorded 5.8% increases in earnings before interest and tax 2000 in beer and 28.7% in wine (Foster’s Brewing Group Limited 2000, p.7). Maturity stage however indicates slow or even stagnant growth which could be a clear indication of new entrants in the market steering competition and stealing the company’s market share. Between 2004 and 2006, Foster Group limited net profits remained stagnant while picked up between 2007 and 2008 with an increase of 854,500 in net profits (Foster’s Brewing Group Limited 2008, p.37).
Valuation Methods
Dividend Discount Models
Dividend Discounted Model is the present value expected on dividends is the value of stock. Damodaran (2005) states that “many analysts view discounted discount model as outdated, the model remains a useful took for estimating value A market price of the stock would be replaced by the cumulative market value of all stocks in the market” (p.3). Damodaran (2005) replicates this analysis by further quoting that
the expected dividends would be the cumulative dividends of all the stocks and could be expanded to include stock buybacks by all firms. The expected growth rate would be the growth rate in cumulative earnings of the index. Analysts would in this case not require betas since the method is valuing the entire market and we could add the risk premium to risk free rate to estimate the cost of equity (p.5).
Damodaran (2005) adds that when valuing the entire market using dividend discount model, we can use for example an index rating at 700 with the average dividend yield of stocks estimated at 5% index. Earnings and dividends can be expected to grow at 4% a year forever and the risk rate is 5.4%. Therefore if you use market risk premium of 4%, the value of the index can be estimated” (p.5)
The formular is computed by;
Cost of equity= Riskless rate+ Risk premium=5.4%+ 4%=9.4%
Expected dividends next year= (Dividend yield* Value of the index) (1+ growth rate) = (0.05*700 (1.04) = 36.4
Value of Index= Expected dividends next year/Cost of equity-expected growth rate
=36.6/0.094-0.04=674
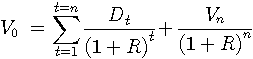
Simply expressed as;
Where;
T=n………the year
V………………The value of stock
D….dividend
R….discount rate
Damodaran (2005) in his example continues that.
At its existing level of 700, the market is slightly over priced. In estimating the value of growth is very valuable to a company since investors pay higher premium when they acquire companies with growth potential. Examining the value of growth and provides a benchmark that can be used to compare the actual prices paid for growth (p.5).
Dividend Discount Model avoids problems associated with the growth rate dropping precipitously from high growth to the stable growth phase, and large deviations used in this model can cause problems. It also uses the assumption that payout ratio is constant through both phases of growth which exposes analyst to inconsistency. Dividend Discount Model works best for gradual decrease in growth rates over time and new firms may find this method useful. But in cases where growth is expected to decline gradually over time as the firm gets larger. Also, the assumption that payout ratio is constant makes it inappropriate to use for any firm with low or no dividends currently.
Dividend Discount Model also works best for firms growing at an extra ordinary rate and are expected to maintain this rate at an initial period after which its expected to decline in the growth rate to a stable growth rate. It applies where changing growth over time is expected to change on other dimensions such as payout policies and risks. Recommended for firms whose earnings are growing at very high rates, and expected to continue growing at those rates for an initial period and expected to start declining towards a stable rate as the firm grows bigger and losses its competitive advantage. Analysts argue that this model is not useful in valuation, except for of-course limited number of stable, high dividends paying stocks. Analysts add that this method provides too conservative an estimate of value since the value is determined by more than the present value of expected dividends. It does not also reflect the value of unutilized assets—supposedly ignored by dividend discounting model. The method does not also incorporate other ways of returning cash to stockholders such as stock buybacks. However, discounted model provides impressive results in the long term by outperforming the markets over five-year time periods (Statistics Directorate1996, p.33).

Where; FC= Fress cash flow in year i
N=The forecast period in years
R=Discount rate
RV= Residual value in years
ADJ=Adjustment (Surplus assets-debts).
II. Free Cash Flow Valuation
Free cash flow is the amount of cash available to pay firm’s investors and cash operating expenses and for making short-and long-term investment (Schweser 2008). Its computed by;
Relative Valuation
Damodaran (2005) defines relative valuation as “is the value of any asset that is estimated by looking at how the market prices are similar or comparable assets” (p.11). In relative valuation, we need identical assets, standardized measure of value by dividing the price of earnings by current cash flow multiplied by WACC or book value and when assets are not perfectly comparable (Damodaran 2005, p.11).
Damodaran (2005) adds that “relative valuation method is more likely to reflect market perception and moods compared to discounted dividend model (p.11). Relative valuation always provides significant proportion of securities that are undervalued and over valued. Damodaran (2005) in his analysis adds that “since portfolio managers are judged upon on how well they perform on a relative basis, relative valuation method is tailored to meet their needs” (p.11). Lastly, relative valuation requires less information especially when multiplying figures (Damodaran 2005, p.11).
Short coming of the method is however that stocks that are undervalued on relative basis may still be overvalued, even if the analysts’ judgements are right. Damodaran (2005) adds that
this may mean that these securities will be less overvalued than other securities in the markets. Relative valuation built on assumption that markets are correct in the aggregates, but makes mistakes on individual securities to the degree that markets can be either over or under valued in the aggregate, will mean that relative valuation will fail (p.11).
Relative valuation requires less information since their valuations are only done on judgements that rely on implicit assumptions about other variables, to the extend that if the implicit assumptions are wrong then the relative valuation will be wrong (Damodaran 2005, p.11).
Residual Income Model (RI)
Residual Income Model uses the anticipated excess future earnings for future payouts. To arrive at the result, the formular discounted by using the cost of equity as discount rate to arrive at the intrinsic value of equity (Damodaran 2005, p.11).
Economic Value Added Model (EVA)
Economic Value Added Model (EVA) uses future economic value to estimate future payoffs and uses the weighted average cost of capital (WACC) as the appropriate discount rate (Damodaran 2005, p.11).
Price Multiples Estimation
Price Multiples Estimation uses the present ratio of the value of stock from discounted cash flow which is then divided by earnings per share (Damodaran 2005, p.11).
Conclusion
The relationship between key economic indicators and performance of companies greatly relies on firms’ profitability. Their performance dictates whether an economy would be stable or not. The variables that should be given careful consideration include GDP, Stock Option and Money supply among other others. The theory that stipulates that higher interest margins equals higher profits provides evidence to support the relationship that does exists between stocks and performance of a company. In addition, higher inflation rates brought about by money supply correlate positively with net interest margins, and companies should in this case consider the relationship that exists between national and local markets. Conclusively, key ratios very important in shaping market structure and stabilising the economy.
List of References
Barber, B. M., Lehavy, M., & Trueman. W. 2001, Security analyst recommendations and stock returns, Journal of Finance, vol.56, pp. 533-563.
Bjerring, J. H., Lakonishok, J., & Vermaelen. T. 1983, Stock prices and financial analysts recommendations, Journal of Finance, vol. 38, pp.187-204.
Bruner, R. F. 2009, Case studies in finance. 6th ed. Mc-Graw-Hill Higher Education Damodaran, A. 2005, An Introduction to Valuation, Journal of Finance, spring, pp.1-21.
Emery, G.W. 2000, Sustainable Growth for Credit Analysis, All Business, vol.1, pp.1.
Foster’s Brewing Group Limited. 2000, What’s Different…and What’s not different: Yet another great year, Concise Annual Report, pp.1-131.
Foster’s Brewing Group Limited. 2003, A robust and globally recognised premium blended, well balanced and vigorous, with smooth finish, Concise Annual Report, pp.1-52.
Foster’s Brewing Group Limited. 2008, Foster’s Group Limited Annual Report for the Year Ended 2008, The Foster’s Business Review, pp.1-117.
Liao, H.,& Tsai, P. 2005, Internal liquidity Risk in Corporate Bond Credit Spreads, College of Management, vol.1, pp.1-47.
Pagan, A., 1996, The econometrics of financial markets, Journal of Empirical Finance 3, pp.15-102.
Reilly,F., Brown,K. 2009, Investment Analysis and Portfolio Management, 9th Edition, Cengage-Education.
Schweser, K. 2008, Free Cash Flow Valuation, Cross Reference to CFA Institute Assigned Reading, 42, vol.1, pp.1-45
Statistics Directorate.1996, Main Economic Indicators, Organisation for Economic Co-operation and Development, pp.1-68.
Urbancic, F. R. 2003,The power of cash flow ratios, Department of Accounting, vol.1, pp. 1-6.
Zivney, T. L. and D. J. Thompson, II, 1989, The specification and power of the sign test in measuring security price performance: comments and analysis, The Financial.