Balance Sheet
The two companies, General Mills and Meiji Holdings Co., Ltd., disclose different components of stockholders’ equity. Meiji Holdings Co., Ltd’s financial statement, for instance, contains common stock – split further into authorized and issued stock, capital surplus, retained earnings, as well as treasury stock. Conversely, General Mills stockholders’ equity is made up of common stock, accumulated other comprehensive loss, common stock in treasury, retained earnings, and additional paid-in capital. The “preferred stock shares outstanding” are not part of the stockholders’ equity. On the other hand, both firms report treasury shares alongside the reason behind their reacquisition. For instance, Meiji Holdings Co., Ltd. reacquires those shares whose value is less than a unit. The reason for reacquisition at General Mills is purposely to help meet the requirement of an existing Accelerated Share Repurchase (ASR) agreement.
Income Statement
General Mills Inc.’s basic and diluted earnings per share are equivalent to $2.83 and $2.9 respectively. On the other hand, Meiji Holdings Co. books do not include the computations related to the two financial indexes. There is no evidence of discontinued operations in the two firms. Alternatively, General Mills has disclosed its stock compensation plans. The reporting is based on the intrinsic value approach. The value of compensation expense corresponding to the firm’s plan is $243 million. On the contrary, Meiji Holdings Co. has not reported any stock compensation plans.
Financial Ratios
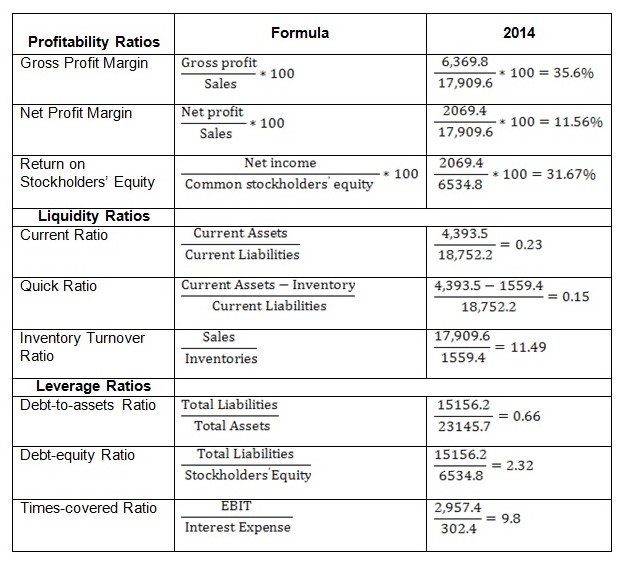
General Mills financial ratios computation
Interpretation of the Ratios
The company’s profitability ratios reveal that the organization recorded positive profits in 2014. In particular, the gross profit margin is estimated at 35.6%, while the net profit margin is approximately 11.56%. On the other hand, the return on stockholders’ equity is 31.67%. This is a relatively high figure meaning that the company’s stockholders expect a very high rate of return.
The liquidity ratios send the signal that there is a high likelihood the firm may fail to meet some of its short-term obligations. For instance, the current ratio is 0.23:1, which is less than the recommended 2:1, implying that the company does not have sufficient funds to finance short-term liabilities. Moreover, the quick ratio is also less than the benchmark. This is an indication that General Mills has liquidity issues. Conversely, the inventory turnover ratio is quite high. The implication is that the firm has invested in an ideal inventory management system.
The debt-to-asset ratio of 0.66 implies that 66% of the resources are backed by debt and 44% by assets. Conversely, the debt-equity ratio of 2.32 means that a very large portion of the firm’s assets is backed by debt and that shareholders have a little claim in the assets. Lastly, the times-covered ratio of 9.8 indicates that the firm is easily in a position to repay its interest and debts. The ratio of 9.8 is quite high, which is a signal that the firm can easily attract additional external sources of financing.
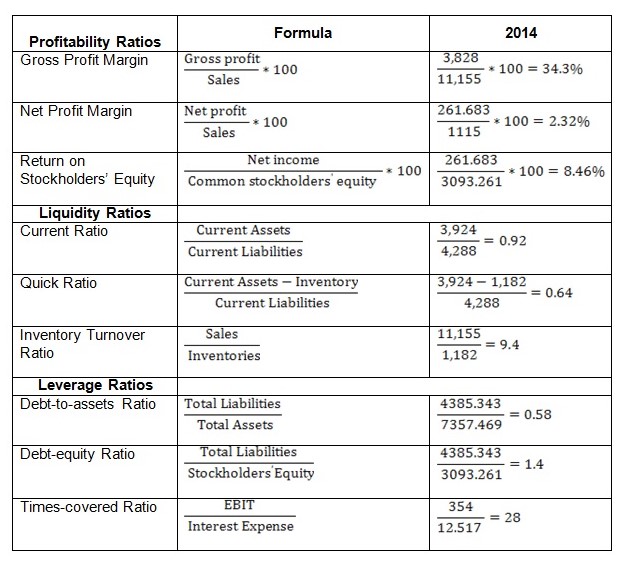
Meiji Holdings Co. financial ratios computation
Interpretation of the Ratios
The company’s profitability ratios indicate that it recorded high profits in 2014. A gross profit margin figure of 34.3% is quite high meaning that the firm’s operations are efficient. However, although the net profit margin is positive (=2.32%), there is a wide range between this figure and the gross profit margin. The interpretation is that there is high inefficiency in the management of operating expenses at Meiji Holdings Co. The company’s return on stockholders’ equity is approximately 8.46%. The number appears quite low, especially in comparison to the 31.67% recorded by General Mills. The great disparity is probably due to the fact that Meiji Holdings Co. main operations are located in Japan, a country renowned for communism.
The company’s current and quick ratios fall below the benchmark. A current ratio of 0.92:1 is an indication that Meiji Holdings Co. may be in financial distress. The firm may thus experience difficulties meeting some of its short-term financial obligations. Similarly, a 0.64:1 quick ratio is also quite low indicating that the firm does not have adequate cash to finance its short-term financial obligations. In contrast, inventory turnover of 9.4 times signifies the firm is able to manage its inventory in a good manner.
Debt-to-assets ratio of 0.58 implies that the firm has a high level of debt than the total assets in place. In simple terms, it means that the firm’s debt level is 58%. On the other hand, the debt-equity ratio is highly recommendable largely because it is more than 1. Lastly, Meiji Holdings Co.’s times-covered ratio is 28, a very high figure by all standards. This is an indication that the organization is currently in a position to repay its debts and interests. It is a positive signal to the creditors.
The two companies have not made use of footnotes in their financial statements. However, there is considerable use of endnotes in the financial statements of the two organizations. These provide explanations of some of the calculations or/and information contained in the main financial statements.
Balance sheet, income statement, or other indicators are not highly informative. One of the reasons is that most of the figures are quoted at nominal rate. This implies that they disregard one highly essential variable: inflation. The figures cannot thus be relied upon to make future predictions. In addition, the management may have colluded to “doctor” the results in order to please the investors.
Ratios present a number of advantages and disadvantages. One of the advantages is that they help interested parties compare performance between different periods or/and companies. In particular, investors consider them as vital tools in decision making. In addition, ratios are also efficient trend analysis tools. For instance, they may help an investor examine an organization’s past or/and future performance. Moreover, they are also easy to compute and interpret. A large number of people believe they are user-friendly. This explains their popularity.
One of the notable disadvantages is that ratios rely on historical data. This means that they may be vulnerable to inaccuracies. Again, most users are interested in current and future trends. In addition, firms employ different accounting methods. This creates difficulties, especially when using ratios to make comparison between different companies. It is for this reason that an analyst cannot reliably compare General Mills and Meiji Holdings Co. ratios.