Introduction
GlaxoSmithKline (GSK) is a world-famous discoverer, developer, and manufacturer of healthcare products. The company operates in three areas, including pharmaceutical, vaccine, and consumer product businesses (GSK, 2020a). The company is valued for its intellectual property, as research and development (R&D) of pharmaceutical products is a significant part of the company’s business.
Currently, the company is actively working on the creation and development of several vaccines against COVID-19 in a cooperative endeavour with Sanofi (GSK, 2020b). GSK uses its innovative technology of vaccine adjuvant, which is a substance that increases the effectiveness of vaccines helping to decrease the reduce the amount of vaccine protein required per dose, which crucial during the pandemic (GSK, 2020b). Thus, the firm sees innovation as its business advantage among its competitors.
GSK employs 99 thousand employees in 95 countries around the globe (GSK, 2020a). In 2019, the company manufactured 2.3 billion packs of medicines, 701 million vaccine doses and 4.2 billion consumer healthcare products (GSK, 2020a). These products helped to generate £6,961 of operating profit, which a significant increase in comparison with £5,483 generated in 2018 (GSK, 2020a). The company paid a dividend of £80 per share, which confirms its determination to provide returns to shareholders (GSK, 2020a).
The present report aims at conducting an analysis of the current position of the company in three key areas of development. First, financial statements for the past five years are used to assess profitability, efficiency, liquidity, and financial gearing. Second, the report compares and contrasts two investment opportunities using NPV, IRR, and ENPV to select the best scenario. Third, the report critically evaluates an acquisition possibility by assessing the possible benefits, risks, and payment method. The report is concluded with an overview of key findings.
Financial Performance
The first objective of the present report is to assess GSK’s financial performance to help the company make financial decisions in the future. Financial reports are used as the central source of information for financial analysis, as it provided all the required data in a strictly organised manner. Financial statements can be assessed both vertically (against the competitors) and horizontally (against the performance of the company in previous years). The performance is evaluated in five key dimensions, including profitability, efficiency, liquidity, financial gearing, and investment (Andjelic and Vesic, 2017).
The present report will focus on four of the dimensions for assessing the financial performance of GSK. The results of the ratio analysis are provided in Appendix A. All the data for ratio calculations were extracted from GSK’s annual reports (GSK, 2016; GSK, 2018; GSK, 2020a). The performance was compared to three competitors, including Johnson & Johnson (J&J), MERCK, and Abbott Laboratories. The financial data for these companies was extracted from Yahoo Finance.
Profitability
Profitability is a company’s ability to generate income to its revenues, assets, shareholder equity, or operating. In other words, profitability analysis demonstrates how efficiently the company uses its resources to generate value for shareholders (Husain and Sunardi, 2020). There are several ratios that can be used for assessing the profitability, including Return on Assets (ROA), Return on Equity (ROE), and profit margin ratios. The present report will use net profit margin (NPM) ratio as the key metric for profitability.
NPM demonstrates the percentage of net profit received by the company from the total revenues. Ultimately, a high percentage of NPM shows that the company is efficient in its operations. According to Kusmayadi, Rahman, and Abdullah (2020), there is a strong positive correlation between NPM and stock return. Thus, higher NPM increases investors’ confidence and improves relations. NPM is calculated using the following formula: NPM = Net Profit/Total Revenues
GSK’s NPM in 2019 was 13.8%, which is higher than in 2018, 2017, and 2016 (11.8%, 5.1%, and 3.3% respectively). However, the ratio is considerably lower than NPM of 35.2% achieved in 2015. The tendency in NPM is demonstrated in Figure 1 below.
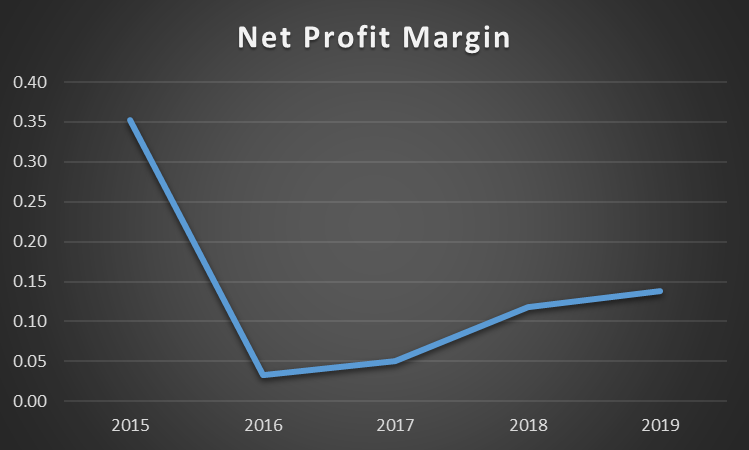
As can be seen from Figure 1, GSK experienced a drastic decline in NPM in 2016. This was associated with a significant decrease in other operating income from £7,715 million to – £3,405 million. The increase in income was due to the start of GSK’s merger with Pfizer and Shionogi (GSK, 2017). Since 2016, GSK pays to Pfizer and Shionogi in preferred dividends, which can be considered as payment towards liabilities (GSK, 2017). Since 2016, the company has been steadily improving its NPM, which can be considered as evidence of its stable profitability. In comparison with its competitors, GSK is behind J&J (0.207) and MERCK (0.246), but ahead of Abbott (0.116). Thus, even though GSK demonstrated significant improvement in terms of profitability, some issues still remain.
Efficiency
Efficiency ratios help to determine a firm’s ability to manage its assets and liabilities in the short-term (Hays, De Lurgio, and Gilbert, 2009). All the efficiency ratios measure how much time it takes to generate cash. Common efficiency ratios include inventory turnover, asset turnover, and receivables turnover ratios (Hays, De Lurgio, and Gilbert, 2009). The present report will focus on the analysis of asset turnover ratio (ATR).
ATR demonstrates how efficiently a company is using its assets to generate cash (Sunjoko and Arilyn, 2016). In particular, the ratio measures how much money is earned from every pound of assets. High ATR shows that the firm manages its assets effectively (Sunjoko and Arilyn, 2016). ATR is calculated using the following formula: ATR = Total REvenues / Average Assets.
Where: Average Assets = Beginning Assets + Ending Assets/2
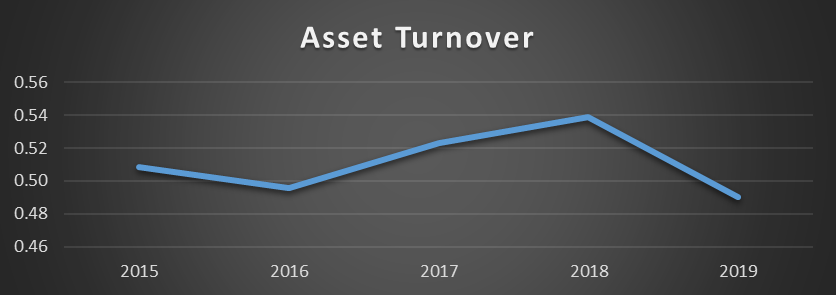
Current GKS has managed to maintain stable performance in terms of ATR throughout the past five years. The company’s ATR varied between 0.49 and 0.54, which is not a significant deviation. This implies that there have been no considerable changes in GSK’s efficiency during the past year, which is a sign of stability. The tendency in GSK’s ATR is presented in Figure 2 below. GSK’s performance in terms of efficiency is comparable with the three identified competitors. J&J (ATR= 0.528) and MERCK (ATR= 0.561) are slightly ahead, while Abbott Laboratories (ATR= 0.472) is behind.
Liquidity
Liquidity ratios help to determine a debtor ability to cover its liabilities without raising external capital (Saleem and Rehman, 2011). The present report will use the current ratio for evaluating the liquidity of the company, which is calculated using the following formula: Current Ratio = Current Assets/Current Liabilities.
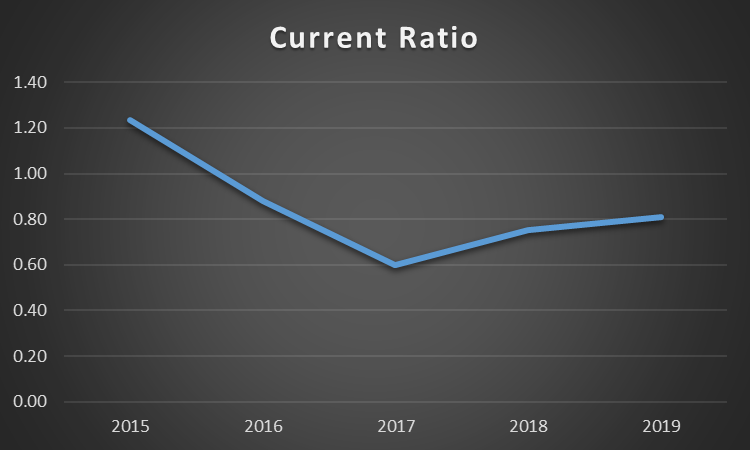
The calculations demonstrate that the company experienced a significant decline in its ability to pay off the current debt in 2016 and 2017 (see Figure 3 below). Even though, since 2017, GSK is steadily improving in terms of liquidity, the ratio is still below 1, which implies that the company needs to raise external capital to pay its debts. All the three identified competitors have current ratios above 1, which demonstrates that GSP is underperforming in terms of liquidity. This is associated with a decrease in net income and an increase in liabilities due to the merger with Pfizer and Shionogi mention in Section 2.1 of the present report.
Financial Gearing
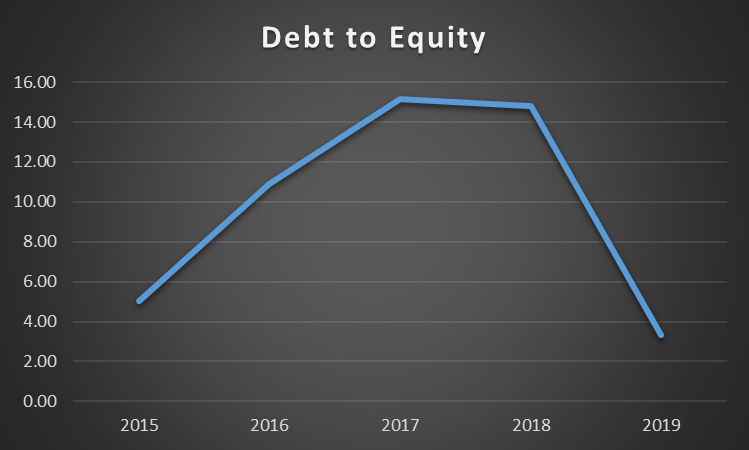
Financial gearing is usually measured by the debt-to-equity (D/E) ratio. It demonstrates how much the company is financed by lenders in comparison with shareholders. It also demonstrates how aggressively the company uses debt to finance its assets. The ratio is calculated by dividing total debt by total equity. High D/E ratio is usually associated with an increased sensibility to external factors such as economic downturns. In 2019, GSK’s D/E ratio decreased considerably, which implies that the company became less sensitive to the changes in the outside environment. The trends in D/E are demonstrated in Figure 4 below. The company’s D/E ratio in 2019 was significantly higher than that of the competitors.
Investment Appraisal
Available Options
The second objective of the present report is to provide recommendations for investment of £40 million into a project. In order to provide suggestions, it is crucial to consider the current needs in the pharmaceutical, vaccine, and consumer product industries. Currently, the demands in the pharmaceutical market are dominated by the need to address the COVID-19 pandemic. In particular, Mahase (2020) insists that the production of dexamethasone should be increased to meet the global need. World Health Organization considers dexamethasone a life-saving drug for coronavirus patients (Mahase, 2020). Thus, the first option is to invest £40 million into increasing the ability of the company to produce dexamethasone. The second option was to invest in the manufacturing of vaccines against coronavirus, which is also expected to have a great demand. Two options need to be evaluated to make final recommendations.
NPV and IRR
There are two discounted cash flow methods that help to evaluate the project in terms of their profitability. These techniques are net present value (NPV) and internal rate of return (IRR). NPV is the difference between the present value of all inflows and outflows (Cheng, Kite, and Radtke, 1994). The method helps to determine how much cash investment is expected to generate over a set period (Cheng, Kite, and Radtke, 1994). The calculations of NPV requires accurate predictions of all incomes and expenses as well as the discount rate. IRR is closely connected to the NPV techniques, as its goal is to calculate the discount rate that will be needed so that NPV is equal to zero. If IRR is below the current discount rate, the project is not worth taking.
Both methods have its benefits and flaws. On the one hand, IRR can compare investments of different calibre, as it is a ratio rather than an absolute value (Cheng, Kite, and Radtke, 1994). However, utilisation of IRR may prevent a company from choosing the project that brings the most money. On the other hand, while NPV can help to select the profitable project in absolute values, it does not allow comparing large and small investments (Cheng, Kite, and Radtke, 1994). The current case requires to determine which is the best option to invest £30 million, which implies that using NPV will be the most appropriate approach to evaluation.
Applying NPV and IRR
The current price of dexamethasone is around £5, which implies that the demand needs to be high during the following years. However, due to increased demand for medicine, it is expected that GSK will be able to sell 2.5 million units annually during the following five years. Thus, the investment is expected to have an NPV of £5,060,000 over five years and an IRR of 17%, which is above the expected discount rate of 12%. The calculations for the first option are presented in Appendix C (see Outcome 2).
As for the second option, GSK can sell up to 800 thousand doses of the coronavirus vaccine in 2021. However, the demand for the vaccine is expected to decrease over time. The price of the vaccines is expected to be around £25 per dose, which implies that the NPV of the second option is expected to be £8,107,000 with an IRR of 22%, which is over the current discount rate of 12%. The calculations for the first option are presented in Appendix D (see Outcome 2).
Risk Assessment and Final Recommendations
Risk assessment is crucial in capital budgeting as it helps to select the most appropriate option for investment considering various factors. All the risks can be classified into project, firm, and environmental uncertainties. Common project uncertainties are associated with the suppliers’ force, market instability, and production (Atrill and McLaney, 2015). Firm uncertainty is associated with the evaluation of its strength, strategy, and personnel (Atrill and McLaney, 2015). Environmental uncertainties consider macroeconomics, governmental policies, and technology (Atrill and McLaney, 2015). In the first option, the highest risks are associated with demand, as other drugs of similar type can be produced. However, considering past demand for dexamethasone, it risks are comparatively low. The highest source of uncertainty concerning the second option is the ability of the company to create the vaccine, which may lead to losing the investment almost entirely.
The best way to make the decision is to use expected NPV (ENPV) metrics. The calculations of ENPV are provided in Appendix E. Considering the results, the company should select Option 1, as its ENPV (£5,510,300) is higher than the ENPV for Option 2 (-£1,413,060).
Merger and Acquisition Suggestions
Mergers and acquisitions (M&As) are complicated processes associated with various risks. However, despite the complexity of the procedure, GSK invested almost £11 billion in 12 acquisitions of various types (GSK, 2020a). The latest M&A deal was closed in 2018, which ended in the acquisition of Tesaro for almost £4 billion GSK, 2020a). During the COVID-19 pandemic, GSK can benefit from both vertical and horizontal acquisitions that will help to increase the company’s market share, effectiveness, and revenues.
Rationale for Choosing the Target
Currently, the central threat that pharmaceutical companies aim to address the novel coronavirus infection. In particular, the world has entered the crucial stage in the development of a vaccine for COVID-19. The Guardian reports that the majority of clinical trials for the vaccines are almost finished with the third stage (Boseley, 2020). GSK has a high potential to be successful in the creation of the vaccine (Boseley, 2020). Additionally, it has the potential to create the highest number of doses due to the unique adjuvant technology that helps to use fewer materials by increasing the immunological response of the body to the vaccine (GSK, 2020a). However, the company may face the problem that it will not have enough production power to meet current demand.
An acquisition is required to increase GSK’s vaccine manufacturing potential. According to Horner (2020), India has the potential to become the key for global access to the COVID-19 vaccines due to high production power of the country and the low cost of production. Currently, seven companies in the country compete in the race to development of the vaccine (Horner, 2020). After analysing all seven companies, Aurobindo Pharma seems the most promising candidate for acquisition. The central advantage of the company is that it has 25 facilities with the carefully aligned supply chain that can boost GSK’s potential in terms of COVID-19 production (Aurobindo Pharma, 2020). Acquisition of Aurobindo Pharma contributes to GSK’s purpose, which is to help people do more, feel better, and live longer (GSK, 2020a). The acquisition adheres to GSK’s long-term strategy to provide healthcare products to as many people as possible. Additionally, Aurobindo Pharma has similar values of innovation, performance, and trust (Aurobindo Pharma, 2020; GSK, 2020a). Thus, Aurobindo Pharma seems to be the most promising option in terms of potential M&A deals.
Expected Gains
The acquisition of Aurobindo Pharma is expected to lead to synergetic gains for both companies, as it has the potential to decrease costs and increase sales. The synergetic gains will include:
- The central gain for both companies will be increasing the chance to beat the competition in developing and distributing a working COVID-19 vaccine.
- Resource distribution will become more effective, as the companies utilise similar resources to achieve their goals (Watson and Head, 2013). GSK will benefit by acquiring an ability to serve more customers, while Aurobindo Pharma will benefit by improving their supply chain management strategy.
- Due to the synergy in long-term priorities, both companies will improve their ability to innovate, gain the trust of customers, and improve the overall performance of companies through developing the employees and improving management efficiency.
Proposed Deal Value and Finance of the Acquisition
The present report uses an asset-based approach to valuate the target company. Aurobindo Pharma’s book value is 130,255 million rupees, which around £1,352 million, which implies that the acquisition deal will be around this number. GSK should finance the deal with debt for the following reasons:
- Current interest rate is low, which is crucial for deal-financing decision (Watson and Head, 2013).
- GSK can afford to increase the current leverage level due to a recent decrease in the D/E ratio (see Section 2.4).
- Aurobindo Pharma’s D/E ratio is low (0.51) and liquidity is high (current ratio = 75.4), which implies that the deal will not burden GSK with additional debt (Aurobindo Pharma, 2020).
Potential Implications
The deal is expected to have several positive implications for GSK. First, it will improve the international presence of the company and help it acquire a larger market share. Second, it will help to decrease the risks of unsuccessful development of the COVID-19 vaccine. Third, GSK will be able to lower average costs and increase sales, which will lead to increased profits (Atrill and McLaney, 2015). Fourth, due to the fact that both companies are from the same industry, GSK will be able to keep all the employees, which will improve the company’s reputation. Finally, GSK will increase the ability to invest in innovation due to optimisation of costs (Atrill and McLaney, 2015). In summary, the M&A deal will contribute to the achievement of GSK’s long-term goals.
Risk Assessment
The deal is associated with a variety of risks, including the following:
- GSK may face the risk of overpaying for the company, which will lead to a loss in efficiency (Watson and Head, 2013).
- GSK will need to manage the problem of cultural integrity. The clash of cultures may lead to loss of productivity, decreased job satisfaction of employees, and inadequate management, which will lead to economic losses (Atrill and McLaney, 2015).
- The problem of the regulatory environment will lead to problems in achieving the central goal of creating and producing a COVID-19 vaccine. In particular, the Indian government issued a law that requires selling no less than 50% of coronavirus vaccines inside India (Economic Times, 2020).
Conclusion
Company evaluations are crucial for determining the current problems and planning future development. The evaluation of the financial performance revealed a problem with liquidity. In particular, GSK’s current ratio reveals that the company does not have enough cash to cover its current liabilities without attracting additional capital. In terms of other assessed ratios, the company demonstrates positive results. The company demonstrates a steady performance in terms of profitability and efficiency. At the same time, GSK managed to decrease its dependency on debt, which led to a drastic fall in the D/E ratio. In general, the company is financially healthy, and no emergencies should be addressed in the nearest future.
The evaluation of investment opportunities led to the conclusion that the company should invest £40 million into producing dexamethasone. However, if the company can lower the risks of not creating an effective COVID-19 vaccine, it should consider changing the current decision. GSK can improve the chances of creating a vaccine by purchasing Aurobindo Pharma, an India-based company. Despite regulatory and culture-associated risks, the proposed M&A deal is associated with significant financial benefits, improved reputation, and increased chances of creating a working vaccine. Thus, Aurobindo Pharma is a viable target for acquisition.
Reference List
Amba, S. M. (2014) ‘Corporate governance and firms’ financial performance’, Journal of Academic and Business Ethics, 8(1), pp. 1-11.
Andjelic, S., and Vesic, T. (2017) ‘The importance of financial analysis for business decision making’, in Book of proceedings from Sixth International Scientific Conference Employment, Education and Entrepreneurship (pp. 9-25).
Atrill, P., and McLaney, E. (2015) Accounting and finance for non-specialists. Harlow: Pearson Education.
Aurobindo Pharma (2020) Annual report 2019-20. Web.
Boseley, S. (2020) ‘It’s possible’: The race to approve a Covid vaccine by Christmas. Web.
Cheng, C. A., Kite, D., and Radtke, R. (1994) ‘The applicability and usage of NPV and IRR capital budgeting techniques’, Managerial Finance, 20(7), pp. 10-36.
Economic Times (2020). Seven Indian pharmaceutical companies race to develop vaccine for deadly coronavirus. Web.
GlaxoSmithKline (2016). Annual report: 2015. Web.
GlaxoSmithKline (2017). Annual report: 2016. Web.
GlaxoSmithKline (2018). Annual report: 2017. Web.
GlaxoSmithKline (2020a). Annual report: 2019. Web.
GlaxoSmithKline (2020b). GSK actions to support the global response to COVID-19.
Hays, F. H., De Lurgio, S. A., and Gilbert, A. H. (2009). ‘Efficiency ratios and community bank performance’, Journal of Finance and Accountancy, 1(1), 1-15.
Horner, R. (2020) India is key for global access to a COVID-19 vaccine – Here’s why. Web.
Husain, T. and Sunardi, N. (2020). ‘Firm’s value prediction based on profitability ratios and dividend policy’, Finance & Economics Review, 2(2), pp. 13-26.
Kusmayadi, D., Rahman, R., and Abdullah, Y. (2018). ‘Analysis of the effect of Net Profit Margin, Price to Book Value, and Debt to Equity Ratio on stock return’, International Journal of Recent Scientific Research, 9(7), pp. 28091-28095.
Mahase, E. (2020). Covid-19: Demand for dexamethasone surges as RECOVERY trial publishes preprint. BMJ, m2512.
Saleem, Q. and Rehman, R. U. (2011). ‘Impacts of liquidity ratios on profitability’, Interdisciplinary Journal of Research in Business, 1(7), pp. 95-98.
Sunjoko, M. I. and Arilyn, E. J. (2016) ‘Effects of inventory turnover, total asset turnover, fixed asset turnover, current ratio and average collection period on profitability’, Jurnal Bisnis dan Akuntansi, 18(1), pp. 79-83.
Watson, D. and Head, A. (2013) Corporate finance. London: Pearson.