Microsoft Corporation is a technology syndicate which manufacturers, progresses, and authorizes computer software and other application. World-renowned business mogul Bill Gates founded this consortium along with his colleague Paul Allen in 1975 (Kozlovska & Vinnik, 2017). Initially, its establishment started as a well-known mainframe computer encoding languages used in earlier versions of personal processors (Kozlovska & Vinnik, 2017).
Its strategic growth underwent significant transformations, such as entering a partnership with International Business Machine (IBM), resulting in the development of a significant Operating System referred to as (DOS) (Kozlovska & Vinnik, 2017). It primarily operates in the software segment, where it offers several products in categories such as consumer electronics, cloud computing, personal computers, and gaming consoles (Kozlovska & Vinnik, 2017). Its major rivals are corporations such as Apple, Facebook, Google, Oracle, and IBM (Kozlovska & Vinnik, 2017). This paper explores Microsoft’s operations while also using various accounting ratios to conduct a financial analysis of its monetary landscape.
Liquidity Ratios
Quick ratio = (Current Assets – Inventory)/Current Liabilities
Table 1. The quick ratio of Microsoft Corporation (June 2020).
This metric is essential in helping accounting managers to determine an organization’s position in managing its obligations. In essence, a declining quick ratio implies that a firm is insolvent and struggles to drive sales, pay expenses, and gather receivables slowly (Silaban, 2018). In contrast, an appreciating value suggests that a business is undergoing consistent, exceptional growth, changing receivables into cash, and can freely meet its commercial debts (Silaban, 2018). In the case of Microsoft, its quick ratio indicates that it has a short-term financial advantage.
Current ratio = (current assets/current liabilities)
Table 2. The current ratio of Microsoft Corporation (June 2020).
This metric is significant is determining a firm’s ability to satisfy its debt obligations. In essence, an increasing current ratio implies that a corporation can meet its obligations, whereas a decreasing working capital suggests an organization cannot pay its debts (Irman & Purwati, 2020). While it means that the firm will not become insolvent, it has several options for acquiring financial assistance. In the case of Microsoft, it is commercially capable of meeting its debt requirements.
Days Sales Outstanding (DOS)
DOS = (Accounts receivable/revenue*days in period)
Table 3. DOS of Microsoft Corporation (June 2020).
This accounting component is used to evaluate the scope of a corporation’s credit practices. It is computed by multiplying the quotient of accounts receivable and revenue by the days in the period (Siekelova, Kliestik, Svabova, Androniceanu & Schonfeld, 2017). Generally, this metric specifies the number of days a firm requires to collect payment after a sales transaction has been completed. Therefore, due to the value of cash in running an enterprise, it is in the best interests of a firm to gather receivable balances.
Total Asset Turnover Ratio
Microsoft’s Asset turnover = {Revenue/ (Total assets as of 6/19 + Total assets as of 6/20)/count}
Table 4. Asset Turnover of Microsoft Corporation (June 2020).
This multinational corporation recorded the figures, as indicated in table 4. According to researchers, the average percentage of asset turnover in the technology segment is approximately 0.58. Microsoft’s ATR is 0.49 in its 2019/2020 financial year, as indicated in table 4 (Lessambo, 2018). This fact implies that the value is below the industry’s average, suggesting that its assets are not being effectively utilized in generating revenue (Lessambo, 2018). Therefore, the business can consider minimizing excess or redundant inventories to match its stock supply with demand.
Debt to Equity Ratio (D/E)
D/E = (Total liabilities/shareholder equity)
Table 5. Microsoft’s D/E (June 2020).
Financial analysis is essential for any multinational conglomerate in long-term planning. In essence, a low ratio implies that the organization barely depends on debts to finance its operation compared to financing through stockholders’ equity (Irman & Purwati, 2020). In contrast, a high P/E suggests the syndicate primarily depends on borrowed money to support its processes (Irman & Purwati, 2020). Therefore, Microsoft had a debt-to-equity ratio of 0.60 at the end of its financial year in 2020 (Lessambo, 2018). It implies that the company is not financially burdened because it has more assets than debts. Moreover, its financial health is more likely to attract investors since it utilizes its debt percentage to make decisions.
Times Interest Earned Ratio (TIE)
TIE = -1(Operating income/Interest expense)
Table 6. Microsoft’s Time Interest Earned Ratio (June 2020).
Table 6 above indicates various figures recorded by the software company as of June 2020. The syndicate has a time interest earned percentage of 20.44, which implies that it is financially robust. Both investors and creditors use this metric to determine the commercial health of a corporation before considering its investment options (Irman & Purwati, 2020). Generally, from their perspective, a ratio greater than 2.5 is regarded as a promising venture option, whereas a fraction of less than 2.5 is considered to have a higher risk of insolvency (Irman & Purwati, 2020). Therefore, while Microsoft is financially stable, it is also able to fulfill its outlays obligation.
Return on Total Assets Ratio (ROA)
ROA = (Net income/average total assets)
Table 7. Microsoft’s Return on Total Assets Ratio (June 2020).
This measure plays a vital role in the analysis of a corporation’s investments and profitability. It shows the consistency of a firm’s investment in generating value, thereby making it a significant output metric for an enterprise (Siekelova et al., 2017). Microsoft’s ROA is 15.06% for the year ended June 2020, as indicated in table 7 above. Different industries have their specific ROA, and a value above 5% is regarded as significant (Lessambo, 2018). Therefore, Microsoft is efficient enough to yield profits from its stockholder’s equity, including its liabilities.
Return on Common Equity (ROE)
Table 8. Microsoft’s ROE (June 2020).
This financial metric is used to determine the profit a corporation generates from its stockholders’ equity. It is essential for investors because it gives them a clear view and projection of a firm’s profitability patterns from investment funds (Siekelova et al., 2017). ROE varies as per the industry in which a company operates; therefore, Microsoft’s 40.14% implies a good investment option for more shareholders (Silaban, 2018). In essence, this syndicate is one of the leading options which venture capitalists should consider in the software and technology sector.
Price/Earnings Ratio (P/E)
P/E = (Share price/Earnings per share)
Table 9. Microsoft’ P/E (December 2020).
A company’s price/earnings ratio describes the relationship between its share price and its yearly net income yielded by the corporation per share. It helps investors evaluate a firm’s stock market value compared to its revenues (Silaban, 2018). Therefore, a high ratio suggests an increase in demand because stockholders expect a rise in growth (Irman & Purwati, 2020). Microsoft’s PE is currently valued at 34.2, and it means its venture capitalists anticipate a high level of income.
Price/Cash Flow Ratio (P/CF)
P/CF = (Share price/Cash flow per share)
Table 10. Microsoft’s P/CF (December 2020).
The P/CF also plays a vital role in helping investors to conduct a corporation’s stock valuation. It is also beneficial to organizations because it is used to assess shares which have positive cash flow but are not lucrative due to large non-financial expenses (Irman & Purwati, 2020). Microsoft’s P/CF is valued at 32.94, and it is considered more significant than revenues by value shareholders. Therefore, the free cash flow can be utilized by the technology syndicate to minimize its debt.
Market to Book Ratio (P/B)
P/B = (Share Price/Book Value per Share)
Table 11. Microsoft’s P/B Ratio (December 2020).
This metric is used to assess the relationship between a corporation’s present market value and the enterprises’ net assets. Therefore, a high P/B suggests that shareholders anticipate a company’s administration to establish more significance from assets. Microsoft has a ratio of 12.94, which means that the market is willing to make premium payments above its tangible assets (Lessambo, 2018). As such, investors should exploit this accounting tool to make informed decisions for better outcomes.
Benchmark Comparison of the Company Against its Competitor
Table 12. Benchmark Comparison of Microsoft Corporation.
A current ratio is a metric used to evaluate an enterprise’s ability to satisfy its short-range debts, which are due within a year. This formula considers the impact of total current assets and the overall present liabilities (Irman & Purwati, 2020). Therefore, it suggests the firm’s financial strengths and how it can increase its liquid assets to pay its obligations. Both Microsoft and Oracle (ORCL) can adopt this mathematical model to evaluate their immediate financial position in the industry. While Microsoft (MSFT) has a lower current ratio than Oracle, it can still manage its short-range obligations.
In regard to day sales outstanding, Oracle takes a short period to collect payments after the completion of sales transactions than Microsoft. This fact implies that the corporation is more efficient and profitable than the former. However, in regard to asset turnover ratio, Microsoft outperformed Oracle with a value of 0.49 against the former’s 0.35 (Lessambo, 2018). It means that MSFT is more efficient in utilizing its assets in making revenue than ORCL (Lessambo, 2018). Based on the debt-to-equity ratio, Oracle has a high D/E fraction, which implies that it has been aggressive in funding its processes with debt. Therefore, it is considered a more financial risk than its close competitor Microsoft.
Both the software companies have a TIE, which is below the industry’s benchmark. However, Microsoft’s time interest earned percentage is more than that of Oracle, and this suggests that it is financially stable and capable of fulfilling its debt obligations, whereas its close rival has fewer operating profits (Irman & Purwati, 2020). Moreover, its ROA is above the industry’s median, and Oracle’s signifying that it is more effective in converting investors’ contributions to net profit than the former. Both corporation’s ROE is above the sector’s average, but Oracle’s values are above Microsoft’s (Lessambo, 2018). While the former is capable of generating cash, ORCL is considered much more effective in making profits.
A P/E ratio is vital in helping investors measure a corporation’s stock market price compared to its income. Therefore, Oracle’s low value implies that the shareholders are getting more returns from their investment, while Microsoft’s high P/E suggests paying high prices per share (Lessambo, 2018). Microsoft has a high P/CF than Oracle, and it indicates that it is trading at a high price and not making enough cash flows. Finally, ORCL’s P/B ratio implies that its share price is overvalued than MSFT’s.
COVID-19 and How the Corporation is Dealing With it
The coronavirus outbreak has brought detrimental effects on transnational communities as well as multinational enterprises. Microsoft is an example of a business which has been impacted by the pandemic.
For example, it has led to more establishments and individuals using the company’s cloud computing services, such as Azure. According to several experts from the corporation, the syndicate anticipates more capital spending later in the year, which implies heavy investment in data warehouses which offer cloud services (Venter, Gordon & Street, 2018). However, it also participates in several efforts to find a solution to the current situation. For example, it collects data to assist in an informed understanding of the transmission of the viral disease. It also works with healthcare institutions by providing them with real-time response technologies. Lastly, it uses Azure technologies to suppress how the virus spreads.
Recommendation
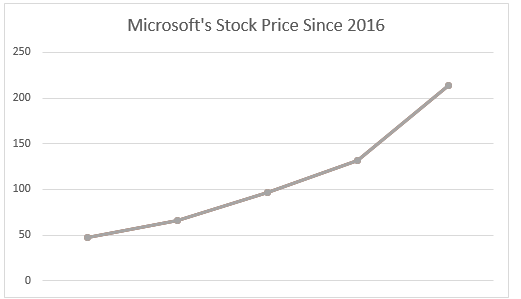
Since 2016, Microsoft’s stock has been appreciating due to several reasons. Currently, its share price is approximated at 213.26 USD. Therefore, it is not the right time to purchase its shares, but investors recommend it to become lucrative in the future. It is because, over the last 14 years, the corporation’s stock price has been merging with a purchase point of 232.96 USD (Shah, Isah & Zulkernine, 2019). According to the Capital Asset Pricing Model, its stock price is considered fairly priced because it matches its value. Therefore, while it is currently not a lucrative stock to consider, it is an excellent long-term investment option.
Conclusion
This paper has explored the financial practices of the world’s renowned software corporation, Microsoft. Various accounting ratios have been used to analyze this company’s financial performance, and therefore, while some figures may indicate negative aspects of the firm, it remains one of the leading organizations in the software industry. The company has a solid foundation, which has enabled it to remain one of the most competitive players offering computing products to other enterprises and consumers.
References
Irman, M., & Purwati, A. A. (2020). Analysis of the influence of current ratio, debt to equity ratio and total asset turnover toward return on assets on the automotive and component company registered in Indonesia Stock Exchange within 2011-2017. International Journal of Economics Development Research, 1(1), 296486. Web.
Kozlovska, H. B., & Vinnik, M. (2017). Microsoft Corporation: Historical insight and importance of innovations in contemporary language and information world [Ph.D. Thesis]. Web.
Lessambo, F. I. (2018). Apple and Microsoft case study. In Financial statements (pp. 331–351). Springer. Web.
Shah, D., Isah, H., & Zulkernine, F. (2019). Stock market analysis: A review and taxonomy of prediction techniques. International Journal of Financial Studies, 7(2), 1-26. Web.
Siekelova, A., Kliestik, T., Svabova, L., Androniceanu, A., & Schonfeld, J. (2017). Receivables management: The importance of financial indicators in assessing the creditworthiness. Polish Journal of Management Studies, 15(2), 217-228. Web.
Silaban, P. (2018). The effect of capital adequacy ratio, net interest margin, and non-performing loans on bank profitability: The case of Indonesia. International Journal of Economics and Business Administration, 5(3), 58–69. Web.
Venter, E. R., Gordon, E. A., & Street, D. L. (2018). The role of accounting and the accountancy profession in economic development: A research agenda. Journal of International Financial Management & Accounting, 29(2), 195-218. Web.