Introduction
This financial analysis of Microsoft has presented a forward-looking statement in context of the present financial condition of the company, the business operations of the company and its appropriate plans and objectives have facilitated to reduce risk and uncertainty at a necessary level, but not sufficient for the ongoing to events and circumstances and may face in the near future. The quick recovery of share price following the global financial crisis, rising total assets and reducing aggregate liabilities as well as increasing shareholder’s equity in the balance sheet, accelerated cost of revenue, enhanced total cash flow, destabilized liquidity poses of the company demonstrated by current ratio indicates that the company need to have coordination between technological changes and future plan.
Background of the Company
Bill Gates and Paul Allen founded Microsoft in April 1975 in Albuquerque, New Mexico, the United States; however, today, with the head office in Redmond, Washington; Microsoft is now serving people worldwide with products such as Windows, Office, Skype, Xbox, Dynamics, Azure, Surface, Bing, and so on; moreover, in June 2014, the number of its workers were 128,076. In 1993, Microsoft was incorporated with the aim of building, authorizing and endorsing a variety of software-based items; however, it is important to note that it also invents and sells hardware, and distributes online advertising to the clients by operating through five sections, namely, Online Services Department, Server & Tools, Windows Department, Entertainment & Devices Department, and Microsoft Business Department.
Share price of Microsoft
The share price of Microsoft had reduced significantly in February 2009 due to global financial crisis; however, this company was enable to revive its financial position; however, the stock price was quite stable from January 2010 to the third quarter of 2014 (Google Finance, 2014). The next figure shows share price of Microsoft:
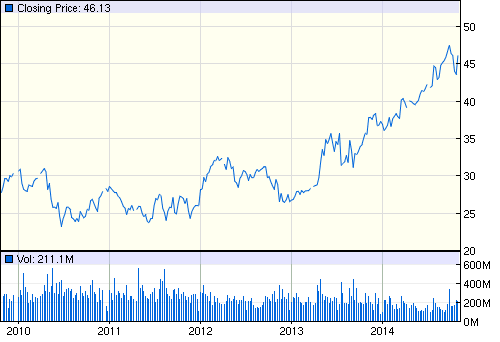
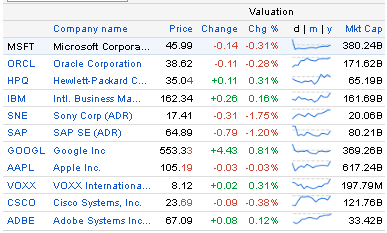
Here, it is important to note that stock price of the competitors of this company is too high, for instance, Google, Apple and IBM dominate share market; however, the subsequent figure demonstrates share price of competitors:
Financial Statement Analysis
Balance Sheet Analysis
Balance sheet is one of the three financial-statements that could be applied to evaluate fiscal performance of Microsoft; however, it is notable from the balance sheet below that in 2014, the business had total current assets of 114,246,000, total current liabilities of 45,625,000, total liabilities of 82,600,000, total stockholder’s equity of 89,784,000, and net tangible assets of 62,676,000. Moreover, from an overall viewpoint, in 2014, the business has been able to show some promising sectors of development where it can further emphasize to improve its balance sheets and other financial statements.

Assets
It has been noted from the financial statements of the company that from an overall point of view, the assets of the business have improved, expanded, and enhanced in all the sectors as a whole. To be precise, the position of the business in terms of assets possessed has developed in a way that the cash and cash equivalents, short-term investments, net receivables, inventory, other current assets, total current assets, long-term investments, property plant and equipment, goodwill, intangible assets, other assets, and total assets, all have increased in 2014 as compared to 2013 and 2012.
Liabilities
Total liabilities include current liabilities, long-tern debts, deferred long-term liability charges and so on; however, total liabilities of this company had increased by $27692 million from 2012 to 2014.
Net Worth
It has been noted from the financial statements of the company that the net worth of the company has increased in 2014 as compared to 2013 and 2012; to be precise, in 2014, the net worth was 89,784, whereas in 2013 and 2012, it was 78,944 and 66,363 respectively, which is indeed good sign, as it indicates good financial health.
Table 1: Net worth of Microsoft Corporation.
Income Statement Analysis
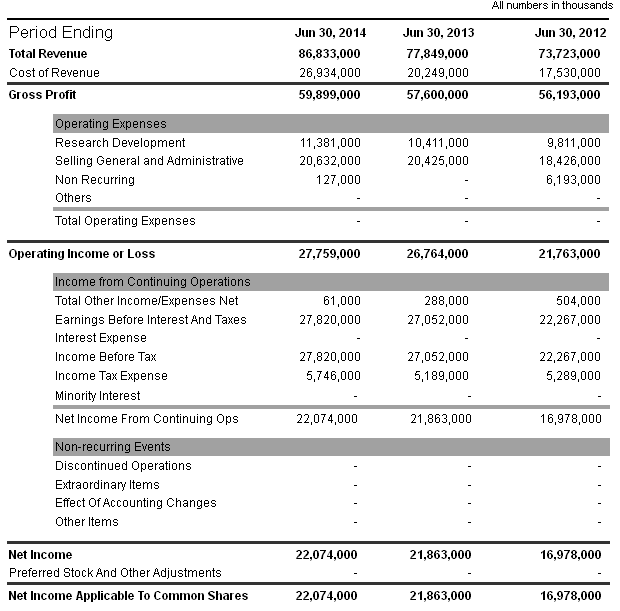
According to the annual report of this company, cost of revenue had accelerated by $9404 million from 2012 to 2014 while gross profit has boosted by $3706 in this period; on the other hand, net income had risen by $5096. Microsoft had not faced any loss in aggregate business operation because the revenue grown has been increasing at a rate of 5% per year on average; however, the next figure provides more details in this regard:
Cash Flow Statement Analysis
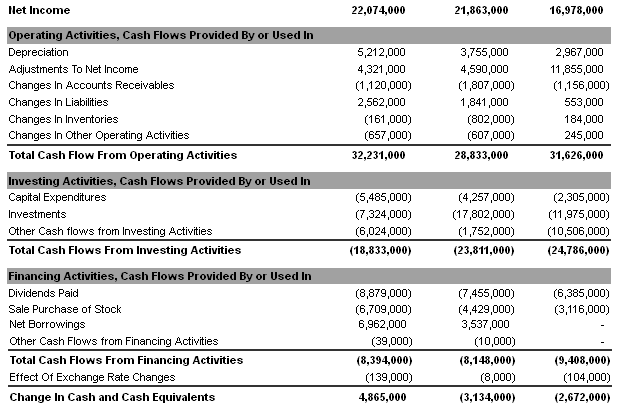
According to the report of Yahoo Finance (2014), total cash flow from operating activities had accelerated by $605 million from 2012 to 2014 while total cash flow from investing activities had decreased by ($5953) million in this period; on the other hand, total cash flows from financing activities had changed by ($1014 million). However, the next figure provides more details in this regard:
SWOT Analysis of Microsoft Corporation
Strengths
Brand Awareness and Product Portfolio: Microsoft Corporation has strong brand image in the global market for its comprehensive range of product and service that enable this company to enjoy a leading market position; however, it makes profit through manufacturing products, focusing development of systems, licensing, and supporting software, server applications and other services (GlobalData, 2013 and Microsoft, 2013).
Consistent Increase in Sales Revenue: In accordance with the annual report 2013 of Microsoft, it enables to achieve financial stability for consistent boost in sales revenue; however, the following table shows total sales revenue of Microsoft from products and services:
Table 2: Total sales revenue of Microsoft.
Table 32: Percentage change.
The above tables show that Microsoft is efficiently using the shareholders’ equity to generate high returns and hold market-leading position.
Financial position: At the same time, financial stability of this company enhanced business function to diversify product and service range to increase profitability level; furthermore, this company decreases its operating expenses in different sector; however, the next table shows net profit of Microsoft from business operation:
Table 4: Net income from operation of Microsoft.
Experience: It is highly essential to note that starting its journey in 1975, the Microsoft Corporation designs and develops both application and system software for personal computer including computer language products, communication, graphics, and project management and markets them in the home and abroad.
Strong Intellectual Property and Other: Microsoft is trying to securing patent rights in national and international market in order to ensure the enforcement of copyright, trademark, trade secret; however, other strengths include SCM system, prioritize innovation and optimization, R&D activities, strong administrative control, and corporate governance, human resources, and so on.
Weaknesses
Legal Proceedings: According to the annual report 2013 of Microsoft, it is a defendant in many unresolved cases connected with product designing, manufacturing, complying contractual and performance liability, human resource, patent rights and so on; therefore, it needs to spend large amount to settle the cases to conduct business with reputation.
Other factors: In spite of having financial stability, Microsoft faced some internal problems related with financial risks because brand equity declined by 2% in 2012 and debt increased by 101% in 2012 while major competitor Apple recorded an increase of 19% in its brand value.
Opportunities
Demand for Smartphones: Microsoft has opportunity to concentrate on the global smartphone market to increase its market presence since this industry is expected to grow about 35% by 2014; in this case, it can introduce products for the smart phone users of the global market using 3G and 4G network technologies and modernized operating systems to gain better market coverage.
Developing Cloud Computing Markets: The growth rate of this sector is too high and it is expected that global cloud computing market will experience growth from $38 billion in 2010 to $121 billion in 2015, which influences this company to expand service ranges to capture this market; however, Microsoft has already addressed this segment through the Microsoft Online Services platform.
Joint venture: Microsoft can expand business function in the global market and increase customer base through using joint venture acquisitions; however, Microsoft acquired PhoneFactor in 2012, and it is going to acquire ‘StorSimple’ (a provider of Cloud-integrated Storage solutions) and ‘Yammer’ (a provider of enterprise social networks) to enter in new geographical regions.
Threats
Highly Competitive Environment: Intense competition across business segments is one of the key threats for Microsoft Corporation because the competitors have strong brand image with financial stability and technological strength; however, direct competitors of this company include Apple, BMC, Hewlett-Packard, IBM, Google, Oracle and so on; it has indirect competitors in different segments (Worstall, 2012; and Microsoft, 2013). According to the annual report 2013 of Microsoft, Google and Yahoo are dominating the online search engine sector while the Windows operating system faces competition from different commercial software solutions; however, the following table illustrates direct competitor comparison:
Table 5: Direct Competitor Comparison.
Availability of Pirated Versions of its Products: The availability of pirated versions is a challenging factor since this company loses billions of dollars because of manufacturing or developing the plagiarize products though the damage is limited in the US; however, most of the developing countries have not concentrated on intellectual property laws, which affecting its business growth.
Fast Technological Changes: Furthermore, the technology market is subject to rapid changes and Microsoft needs to adapt quickly altering business atmosphere; thus, the launch of products applying new technologies or the implementation of new industry standards can make the existing products outdated or unmarketable (Worstall, 2012; GlobalData, 2013; and Microsoft, 2013)
Other External Threats: As it operates in more than 100 countries, Microsoft Corporation needs to focus on the external financial risk factors, such as, exchange rate volatility, global financial crisis and so on.
Financial Ratio Analysis
Current ratio
Table 6: Current Ratio analysis of Microsoft Corporation.
It is important to note that as current ratio exemplifies margin of security or moderation accessible to creditors, this is one of the most recognizable and rapid assessment of business’s liquidity; in addition, it must be kept in mind that it is a fact sheet for Microsoft’s monetary fidelity and realistic solvency and manifestation of potency of the working capital. It is clearly visible from the chart above that from 2012 to 2014, Microsoft Corporation has seen a sudden decrease in its current ratio; even though the ratio had increased in 2013, in 2014, it has lowered unexpectedly.
It is highly essential to note that such an unexpected plunge in the current ratio of the company exhibits the corrosion of the liquidity pose of this firm, and indeed, it is noteworthy that the liquidity position of Microsoft has destabilized in the last financial annum; as a result, in order to improve this, the firm should deploy more emphasize.
Table 7: Current Ratio analysis of Microsoft.
As shown in the table, there has been a sudden decrease in the current ratio of Apple Inc from 2011 to 2014, a gradual decrease in the current ratio of Google Inc, but a gradual increase in the current ratio of Oracle. These figures indicate that it were not just Microsoft that suffered from shrinking current ratio in 2014, but some of its major competitors are suffering too.
Quick Ratio
Table 8: Quick Ratio analysis of Microsoft.
It is notable that the quick ratio is a precise assessment mechanism that finds out whether a firm possesses enough short- term resources to swathe its imperative liabilities devoid of trading stock; fundamentally, this assessment is more grueling than any other ratios, for example the working capital ratio, mainly because working-capital ratio allows the adding together of stock assets.
This has been suggested by academicians that firms that possesses a quick ratio of less than ‘1’ will not be able to reimburse their current-liabilities and so, those firms should be seen with deep caution; additionally, if the acid test ratio is considerably lesser than working-capital ratio, this would indicate that current-assets are exceptionally reliant on inventory. As shown in the table above, from 2012 to 2014, there has been a decline in the quick ratio of Microsoft; however, the ratio is still much higher then ‘one’, which is indeed a positive sign.
Table 9: Quick Ratio analysis of the competitors of Microsoft.
In case of Apple Inc, Google, and Oracle, the quick ratio is also above ‘one’; however, Apple’s position is weaker than Microsoft, and the position of Google and Oracle is must better than Microsoft.
Working Capital
Table 10: Working Capital of Microsoft.
The working capital of Microsoft has increased gradually from 2012 to 2014, which means that the company is not running in the most well- organized way nowadays
Table 11: Working Capital analysis of the competitors of Microsoft.
The working capital of Apple Inc, Google, and Oracle also increased gradually from 2012 to 2014, which means that the competitor companies of Microsoft are also not running in the most well- organized ways these days.
Debt/Worth Ratio
Table 12: Debt/Worth Ratio of Microsoft Corporation.
Debt/worth ratio of Microsoft Corporation has increased gradually from 2012 to 2014, which indicates that the firm has been hostile to fund its growth with debt throughout the last few years.
Table 13: Debt/Worth Ratio analysis of the competitors of Microsoft.
The debt/worth ratio analysis of the competitors of Microsoft shows that during the period of 2011 to 2014, Apple Inc and Oracle has also observed an unwanted increase in this ratio, where as only Google had been capable to keep it under control.
Profitability Ratio
Gross profit margin
Table 14: Gross profit margin of Microsoft Corporation.
Gross profit margin of Microsoft Corporation has gradually decreased during the period of 2012 to 2014, which shows that variable costs had escalated whilst selling price had remained stable; this might also signify that Microsoft Corporation has slashed prices to create an expansion in sales.
Table 15: Gross profit margin of the competitors of Microsoft.
Gross profit margins of the competitors of Microsoft reveal that in case of Apple Inc and Google, this ratio has lowered; however, in case of Oracle only, it has increased, indicating that only Oracle has been able to improve its sales efficiency.
Net profit margin
Table 16: Net profit margin of Microsoft Corporation.
It is important to note that net profit margin is one of the most necessary features for deciding the situation of the company at present in order to review its general performance in a year; however, it is quite surprising that for Microsoft Corporation, throughout 2009, 2010, and 2011, the net profit margin has decreased a lot than past year. Elevated net profit margin ratio shows how victorious the company has remained in altering sales into profit, and that the company is capitalizing on several competitive-advantages that can provide it some extra ability and agility during the hard fiscal periods; equally, stumpy net margin means Microsoft is not engendering ample sales or it is not keeping its operating-costs in control.
Such a decline in the net profit margin ratio might point out cost splurges that demand aptitude improvement; additionally, Microsoft, having a poorer ratio, might need to take on debt to pay its everyday expenditure; all these issues specify that it is extremely decisive for the business to sincerely deal with increasing its strategies to augment the yearly turnovers.
Table 17: Net profit margin of the competitors of Microsoft.
Net profit margin of the competitors of Microsoft show that it is not just Microsoft that has suffered from falling NPM, but Apple Inc and Google Inc and also faced a decline in this context; however, in case of Oracle, this ratio has developed than the previous year.
Return on assets (ROA)
Table 18: Return on assets of Microsoft Corporation.
It is notable that ROA is a chief profitability-ratio that decides the amount of earnings engendered per dollar of assets; this further evaluates firm’s ability to form income before leverage with assets instead of exploiting leverage in form of shareholders-equity or other debt-liabilities; normally, the superior this figure is the greater proficient the company is in exploiting its assets. ROA is a gauge of how rewarding a business is in contrast to its total-assets, and growing ROA provides a suggestion that the company is ably using its assets to produce income; however, in case of Microsoft, ROA has decreased; therefore, here, it is not quite striking because falling ROA symbolizes that difficulty exists in Microsoft, mainly in growth sectors.
Table 19: Return on assets of the competitors of Microsoft.
Even though the ROA of Microsoft has fallen recently, the comparison table above of its competitors shows that the figures of Google Inc and Oracle are much lower than Microsoft, although Apple’s ROA in 2014 was much higher than Microsoft.
Return on capital employed (ROCE)
Table 20: ROCE of Microsoft.
ROCE reviews how much proceeds have been generated from shareholders’ investments, finding out whether or not the firm is generating sales and sufficient revenues to make best exploitation of capital assets; ROCE can be augmented by cutting expenses to strengthen profit margin ratio, or by purchasing materials at lower-expenses; however, ROCE of Microsoft has lowered from 2012 to 2014. Falling ROCE points to the fact that Microsoft is now inefficiently utilizing its capitals:
Table 21: ROCE of the competitors of Microsoft.
Though the ROCE of Microsoft has plunged lately, the evaluation chart above of its rivals shows that the figures of Google Inc and Oracle are much lesser than Microsoft, even though Apple’s ROCE in 2014 was a bit higher.
Activity ratios
Asset turnover
Table 22: Asset turnover of Microsoft Corporation.
Assets turnover ratio appraises a firm’s ability to utilize its assets to stimulate sales and revenue; this symbolizes its operational-effectiveness or capacity-utilization; if this ratio is lower, it means unskilled management of assets, and if it is elevated, it means rigorous use of assets; however, in case of Microsoft, assets turnover ratio has fallen consecutively from 2012 to 2014. This indicates to the fact that the company in the last few years has remained quite inefficient in managing its operations effectively and there has been poor capacity- utilization inside Microsoft.
Table 23: Asset turnover of the competitors of Microsoft.
Even though the assets turnover ratio of Google Inc has remained constant, the table above shows that in case of Apple Inc and Oracle, there has been a decline in this ratio as well; however, this ratio is still very strong in case of Apple.
Conclusion
The present illustration of the financial management of the Microsoft has delivered a positive rating based on the present financial condition in relation to the presiding few years experiencing the recessionary economy. The share price of the company, balance sheet, and cash flow and ratio analysis along with ROA and ROCE demonstrated that the company is going through tremendous growth prospect with symbolizes that difficulties in the growth sectors and suggest to reduce inefficiently to utilizing its capitals while the benchmarking in relation to the competitors suggested it as an attractive portfolio.
Reference List
GlobalData. (2013). Microsoft Corporation – Financial and Strategic Analysis Review. Web.
Google Finance. (2014). Stock Price of Microsoft Corporation. Web.
Microsoft. (2013). Annual report 2013 of Microsoft Corporation. Web.
Worstall, T. (2012). Microsoft’s Market Share Drops From 97% to 20% In Just Over A Decade. Web.
Yahoo Finance. (2014). Financial Analysis of Microsoft Corporation. Web.