Introduction
Background Information
The current total quality management (TQM) strategies within the production unit of Nestlé are effective in balancing the expected level of efficiency for each bundle of input and output. The linear efficiency feedback model has been effective in tracking the performance matrix of the production operations strategies to facilitate and manage the entire production line as a compressed unit. However, this linear approach has its challenges due to its inability to proactively and holistically engage the factors of production as dependent units (Talib, Ali & Idris 2014). As a result, incidences of wastes and inability to meet the demand at an optimal production level have increased the cost of production. This research paper reviews the current TQM strategies within the production department of the Nestlé in terms of their efficiency and proposes a modification of the current six-sigma tool to ensure that the production department operates optimally. The proposed six-sigma tool is effective in guaranteeing a sustainable balance in efficiency matrices such as cost, dependability, and speed to internalize a self-sustaining production process.
Research Problem
The Nestlé has an effective TQM framework characterised by a proactive quality certification model managed from a centralised production system. The matrix is the same for all sub-production departments and managed through a centralised decision-making process. Despite the high level of effectiveness, the company is currently facing a myriad of challenges in sustaining its production matrix due to the constant paradigm shift in the market dynamics, effective productivity, and relatively inaccurate forecasting strategies. For instance, despite operating in the predictable food industry, the company has been unable to meet its targeted production efficiency as the cost implications continue to surpass the market standards. Moreover, Nestlé is over-dependent on its current fixed production tools for engaging a series of quality elements in tracking the sustainability of the productivity matrix. As a result, the ever-changing production dynamics of the business environment has caused difficulties inaccurate identification of the sources of inefficiencies, especially under a centralised production system. At present, it is challenging to track the strategies facilitating efficiency in the product segments due to the generalised nature of the macro productivity model that cannot effectively examine the dynamics in each unit.
Nestlé has been unable to institutionalise a sustainable and effective efficiency tracker within its production department since the present matrix is generalised across different sub-departments. For instance, all the production segments use similar production sustainability and efficiency strategies despite the differences in the dynamics affecting each production unit. According to Suma and Lesha (2013), overreliance on a linear-based operational efficiency tracking makes it difficult to replicate the production matrix in scenarios with variances in the production indicators or requirements. Specifically, the Nestlé’s nutrition production line has been ineffective in replicating the production strategies for baby food and adult food sub-departments. Although these challenges in the TQM management have existed for more than a decade, the company has been unable to modify its linear efficiency tracking strategies to integrate the current and future dynamics in each productivity sub-units.
As a result, Nestlé continues to grapple with the consequences of inaccuracy in forecasting, poor decision-making process, and management of the dynamics in each production front. For instance, in the last financial year, the company was forced to suspend its dairy products plant in the UK due to unsustainable production costs. The company was not able to balance the requirements, dynamics, and elements of productivity in each sub-production front. According to Stubbs, Higgins and Milne (2013, p. 461), “an imbalance created by a linear productivity matrix might have serious long-term impacts on the general operations management.” For instance, despite the positive revenues, the company’s profitability level continues to dwindle notwithstanding the aggressive expansion strategies across the UK. In relation to the TQM prepositions, a linear productivity scanner is not effective in integrating the quality management variables such as speed, cost, dependability, and sustainability in the entire production matrix (Strom, Sears & Kelly 2013). In application, these TQM variables guarantee faster, on-time, balanced, and minimal errors in the entire production cycle as instruments for cost management.
Research Rationale and Significance
The current high cost of productions has made the productivity matrix ineffective at Nestlé. For instance, balancing process design and capacity in different sections of the production department is very difficult. Although the productivity decision process is dynamic and consultative, the linear model is ineffective in integrating the realities and externalities that are associated with the increased cost of production and imperfect mix of the factors of production. As a result, the inputs of the highly skilled workforce at Nestlé have not translated into an optimal performance of the productivity matrix. Therefore, the proposed research is focused on addressing the problem of linear-based productivity as an impediment to the total quality management strategies within the production department at Nestlé. The paper will explore the best strategies Nestlé could introduce in its current productivity module to create a dynamic, replicable, and multifaceted alternative. The rationale for this study is to address the challenge of unsustainable productivity matrix within Nestlé’s food production department in the UK.
Literature Review
Total Quality Management Practices in the UK
The concept of quality management is broad and includes value and results of processes aimed at people and business strategies. Academicians, quality gurus, and practitioners have present different definitions of TQM. For instance, Spinelli and McGowan (2014) defined TQM “as the mutual co-operation of everyone in an organization and associated business process to produce products and services which meet the needs and expectations of customers” (Spinelli & McGowan 2014, p. 29). This means that TQM could be a production philosophy and a guiding principle for the proactive management of an organization on the basis of specific principles for improvement. In application, the implementation of TQM strategies involves the transformation of strategic priorities, organisational processes, and beliefs. In the UK, there has been a paradigm shift in quality management strategies and activities over the last three decades. The intensity of the shift could be attributed to the increased integration of the problem-solving technique, 5S and statistical sampling as a determinant of a decision-making process (Sostrin 2013; Gordon 2013).
Theoretical Literature Review
There are several tools and frameworks for effective TQM in an organization. According to Singh and Singh (2014), the ideal tools include the FMS and Six-Sigma. These lean quality management applications enable organizations to proactively and effectively track their production processes within the margins of optimal performance (Habib et al. 2014). For instance, according to Searcy and Buslovich (2014), the FMS framework is effective in balancing the cost, reliability, speed, and dependability variables when managing the production process. In application, integration of a FMS framework is a prerequisite for managing cost elements in a production cycle since it aids in evidence-based decision-making (Scherer & Stefano 2014).
Moreover, Rebelo, Matias and Carrasco (2013) noted that the FMS framework is capable of tracking the cost elements through an elaborate efficiency balance to increase the revenues streams for every bundle of inputs and outputs (Monks & Minow 2014; Guiso, Sapienza & Zingales 2015). In the dynamic food processing industry, the FMS application is an integral part of logistics management through the balancing of the concurrent short-term and long-term goals (Osterwalder & Pigneur 2013). Fundamentally, the FMS framework is known to catalyse systematic adjustments for effectiveness in the management of the entire production process (Hahn & Kühnen 2013). The resulting increment in the productivity matrix guarantees an effective process for micromanaging the efficiency policies of an organisation (Nunes & Machado 2014). In relation to Nestlé, holistic and systematic integration of the FMS framework might improve on the systems for tracking quality and effectiveness of each production process within the dynamic department.
Another theoretical framework that has been put forward to explore the TQM concept is the ‘Lean Six-Sigma’ (KIP Institute 2013). The Six-Sigma tool is a quality management instrument that integrates the production strategies onto the aspect of sustainability to ensure a smooth flow in the productivity processes (Nobes 2014). Through the application of this framework, an organisation is empowered to operate within an effective and self-sustaining decision-making process (Harrison & Wicks 2013). At present, Nestlé has a Six-Sigma tool. However, it has not been effectively institutionalised in the production module. An effective Six-Sigma integration involves balancing the aspects of planning and diversification through a synchronised productivity system (Kiran 2016). According to Myerson (2015), lean Six-Sigma tool is an effective instrument for accurate forecasting the present and future production dynamics, externalities, and obstacles to ensure timely interventions.
Empirical Literature Review
A lot of empirical literature exists on the TQM concept and its application in areas of research, evaluation modelling, and general quality in the decision-making processes. For instance, Milios et al. (2013) integrated the Deming 14-point model to develop 32 elements and 8 factors as instruments for modelling an effective TQM strategy. The instruments were tested in more than 50 firms in the UK. The findings revealed that the critical constructs of an effective TQM strategy are relevant to a specific organization and the same process may not give similar results when applied in other sectors. On the other hand, Martelo, Barroso and Cepeda (2013) carried out a study on the critical constructs of total quality management within the food manufacturing industry in the UK through reviewing conceptual, empirical, and prescriptive literature. The findings indicated that TQM instruments vary from one organization to another, depending on the size, dynamics in the management processes, and operational management strategies (Eman, Ayman & El-Nahas 2013).
Manning and Soon (2013) carried out another study on the appropriate quality management modelling in the context of Malaysia’s food manufacturing industry. This study covered the existing quality management strategies within the borders of TQM. The findings revealed that the proactive application of TQM strategies is dependent on the management approaches and general organisational focus on balancing the factors of production. Manning (2013) established that the driving factors for effective TQM are management leadership, quality data, and process facilitation. The factor of management leadership within a production matrix determines the applicability of the TQM. For instance, the decision process is an integral element of productivity matrix since it determines the how, when, and why factors of production are mixed for a targeted outcome (Mangan, Lalwani & Lalwani 2016).
Another study by Kim-Soon, Rahman and Ahmed (2014) highlighted management levels as significant in the certification of the processes involved in the completion of a single production cycle. The findings further revealed that effective management leadership is an instrumental influencer of the decision process in the selection of the factors of production, balancing the matrices in the productivity cycle, and tracking the progress of each bundle of inputs and outputs. Kim-Soon, Hui and Ahmad (2017) concurred that an effective management process is essential in monitoring the customer needs, market demands, and product design during the process of production. The authors concluded that focused management on the module of efficiency guarantees sustainable organizational operation processes, especially in terms of allocation of activities, resources, and design management.
Another study by Karatepe (2013) highlighted quality in data reporting and use within a productivity matrix as an integral part of the TQM. Specifically, the study established that a good reporting and data system can correctly and timely reflect the existing or situational level of managing of each production process. In application, the quality data application empowers the decision-making process since it integrates a series of scientific tools for problem identification (Hyland, Lee & Mills 2015). Most TQM strategies are directed towards building quality through products. Thus, effective design management is a critical mix for facilitating support function, supply function, procurement function, and other functions associated with production (Abusa & Gibson 2013a). Efficient data design and reporting system have positive implications on enforcing sustainable management of all production functions (Liu, Shang & Han 2017). The empirical studies confirmed that there is a positive correlation between design management and effectiveness in the productivity cycle (Kafetzopoulos, Gotzamani & Psomas 2013). In addition, the studies have suggested that quality in the production process management is instrumental towards reducing the variations through building sustainable quality in each product bundle (Horner 2013). As a result, the outputs will be of high quality while the unnecessary costs are eliminated (Abusa & Gibson 2013b).
Literature Review Significance and Gap
The empirical and theoretical literature review suggests that the concept of TQM is dynamic and multifaceted, especially when applied in a complex production process of an organization. The frameworks of Six-Sigma and FMS have confirmed the significance of different quality management variables such as cost, time, dependability, and sustainability in quality management of a productivity process. The empirical literature has indicated that balancing these instruments and other variables create the ideal environment for effective design management, decision-making, and tracking of each production matrix. However, most of the studies are concentrated in the general industries or sectors and would not be applicable in a focused firm. Therefore, the proposed study will address this research gap by concentrating on the TQM challenges within the Nestlé’s production department in the UK food processing sector. The study aims to fill this gap through a review of specific instruments and tools that would aid a complete remodelling of the current ineffective production management approach.
Methodology
Research Design
Since the proposed study is focused, subjective, and dynamic, the researcher opted for a quantitative research design to underscore the variables and instruments of the report. The rationale for selecting quantitative approach was its ability to give room for a comparative review of the existing correlation between the dependent and independent variables (Saunders, Lewis & Thornhill 2016). In this study, the dependent variables are dependability, cost, speed, and sustainability while the independent variable is efficiency in the productivity matrix. The researcher will use four closed-ended questions to perform a survey capturing the guided insights about the significance of the variables on the efficiency of the productivity matrix (Mason 2017). The questions were pretested for their relevance after which the researcher settled on a 5-point Likert scale (Kothari 2013). The survey questionnaire consisted of four pretested questions relating the TQM instruments to Nestlé’s productivity matrix (see appendix 2). The research was carried out through a primary survey of 30 employees within the production department of the Nestlé Corporations’ food processing section. The researcher applied the snowballing strategy to select the sample population. According to Saunders, Lewis and Thornhill (2016), the selected number of respondents is appropriate for quantitative study since it forms an adequate sample space.
Instrumentation
Data analysis was carried out through the use of correlation tool. The variance is the mean of the four variables was represented by
![]()
while the mean of the effectiveness of their impact of the productivity matrix was represented by
![]()
(Miller et al. 2013; Bryman & Bell 2015). The proposed hypotheses for the correlation analysis are;
Null hypothesis
Ho: µ1 = µ2
The null hypothesis indicates that the mean of the sample population for all the four variables are equivalent to the mean of their impact on productivity matrix
Alternative hypothesis
Ho: µ1 ≠ µ2
The alternative hypothesis indicates that the mean of the sample population for all the four variables are not equivalent to the mean of their impact on productivity matrix
Therefore, the null hypotheses will be rejected when the F-calculated is greater than the F-critical at 99% estimated confidence interval (Bansal et al. 2017).
Sample statistic + Z value * standard error / √n
b1 = 7.1175 ± 2.57 * 0.9631 / √30
= 7.1175 ± 2.57 * 0.9631 / 5.5326
= 7.1175 ±0.2146
= 6.9029 ≤ b1 ≤ 7.3321
At 95%
b1 = 7.1175 ± 1.96 * 0.9631 / √133
= 7.1175 ± 1.96 * 0.9631 / 11.5326
= 7.1175 ± 0.1635
= 6.954 ≤ b1 ≤ 7.281
At 90%
b1 = 7.1175 ± 1.64 * 0.9631 / √133
= 7.1175 ± 1.64 * 0.9631 / 11.5326
= 7.1175 ± 0.1368
= 6.981 ≤ b1 ≤ 7.254
The above calculations reveal that the estimated confidence intervals at 6.981 ≤ b1 ≤ 7.254 of 90%, 6.954 ≤ b1 ≤ 7.281 of 95%, and 6.9029 ≤ b1 ≤ 7.3321 of 99%.
Conceptual Framework
The dependent variables are dependability, cost, speed, and sustainability while the independent variable in efficiency in the productivity matrix. The researcher generated a graphical representation of these variables to explain their relationship (see figure 1).
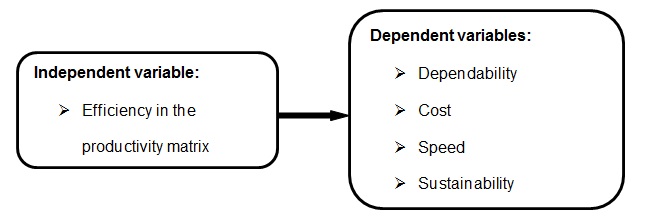
The proposed conceptual framework was generated from the expanded theoretical instruments of TQM and related to the productivity efficiency matrix. The focus of the framework was correlating the instruments of cost, speed, sustainability, and dependability to the efficiency of Nestlé’s production matrix.
Findings and Analysis
Demographic Characteristics of the Results and Analysis
The response rate for the survey was 100%. This means that all the targeted respondents filled the questionnaires and submitted the same on time (see table 1 and appendix 1).
Table 1. Demographic characteristics of the respondents.
The collected data was then subjected to transcription and coding to reveal the impacts of each variable on the productivity matrix at the Nestlé Company in terms of their standard deviation, rank, and mean (see appendix 3).
As summarised in table 2 (see appendix 3), the variable of dependability had the highest cumulative mean while sustainability had the least score. The trend was repeated for standard deviation and rank. The high score for dependability could be attributed to the instrumentation of efficiency and explicability of a production process. The other instruments are equally important and dependent on each other, thus, the positive score. Moreover, the variance in the score means, rank, and standard deviation for each variable was small, which confirms that they are interrelated in the creation and functionality of the entire productivity matrix. Since all the results fall within a single digit, it is an indication of consistency in the gathered responses.
The researcher then carried out a correlation analysis to present an insight into the degree of association between the independent and dependent variables (see appendix 4). The correlation analysis was performed to determine the degree of association between the dependent variables at the instrumentation level. This was followed by a correlation to relate the existing relationship between the dependent variables to the independent variable. Specifically, the researcher used the Spearman rank correlation because of its wider scope and flexibility in comparative analysis.
The results of the Spearman rank correlations show a strong correlation between the respondents perception of cost of production and the dependability of the department’s production matrix (r =.502, p <.01). Their perception of speed of production at the company was also strongly correlated with the dependability of the department’s production matrix (r =.703, p <.01). Similarly, their belief in the current TQM strategies adopted at the company was also strongly correlated with the dependability of the department’s production matrix. The speed of production was almost strongly related with the cost of production (r =.492, p <.01), which suggests that higher speed of production comes at a cost. On the other hand, the cost of production was moderately, negatively correlated with the responds’ level of belief in the current TQM strategies adopted at the company/department (r = -.404, p <.05). However, there was no relation at all between the respondents’ perception of speed of production and the current TQM strategies adopted at the company.
The findings of the quantitative study are consistent with the theoretical and empirical literature. For instance, the findings have confirmed a positive correlation between efficiency in the productivity matrix and TQM instruments. This is in line with the FMS and lean Six-Sigma tools discussed by Searcy and Buslovich (2014) and Scherer and Stefano (2014). On the basis of the efficiency productivity theoretical construct, an effective approach to the integration of the four primary instruments of TQM into the current productivity matrix of Nestlé would have a positive impact on the level of production efficiency. For instance, as established by Scherer and Stefano (2014), Hahn and Kühnen (2013), and Osterwalder and Pigneur (2013), the findings of this study confirm that efficient, optimal, and sustainable quality in the output can only be realised when TQM instruments are holistically and integrally merged in the production cycle.
The findings also concur with empirical evidence gathered in the literature review, especially from the perspective of continuous quality management and feedback tracking. For instance, the results of the study were similar to past studies carried out by Hyland, Lee and Mills (2015) and Karatepe (2013). The findings of this study indicate that a good quality management system is a prerequisite for optimal productivity, especially when the elements of cost, dependability, speed, and sustainability are properly aligned in the production mix. In line with the decision-making framework as a total quality management principle, effective control and assurance processes is necessary in balancing the current and future productivity at predictable and accurate intervals. In the case of Nestlé’s production department, the current inadequate integration of scientific tools for problem identification could be associated with low performance in the cost and sustainability variables.
Conclusion and Recommendations
Conclusion
The research was aimed at identifying the current challenges within the productivity matrix of the Nestlé Company. Through quantitative research survey, the findings revealed that there is a positive correlation between the total quality management instruments and productivity matrix at the company. At present, the background information revealed that Nestlé is grappling with the challenge of balancing these instruments for optimal and sustainable production. Therefore, the company should integrate the aspect of ‘lean’ within its Six-Sigma tool to guarantee effective mix in the TQM instruments (Oakland 2014). Although the performance of the dependability and speed instruments are optimal at present, there are imbalances in the cost and sustainability mixes (Daft & Marcic 2016). Thus, the company should consider improvement of the current productivity matrix to guarantee optimal and sustainable TQM within the production department.
Recommendations
Nestlé Corporation should consider upgrading the current productivity matrix through balancing the instruments of sustainability, dependability, cost, and speed in its production quality management system (Battor & Battour 2013). This will ensure that the aspects of innovation, quality assurance, and feedback tracking are self-sustaining. In addition, the company should consider tailoring its efficiency tracker through creation of small-scale inspection units for managing the decision-making process. As a result, the balanced creativity and correspondent to efficiency will function with a flexible and effective total quality management of the production department.
Appendices
Appendix 1: Actual Survey and Question Items
Appendix 2: Questionnaire
Demographic Variables
- What is you gender?
- Male
- Female
- What is you management level
- Senior Manager
- Mid-level Manager
- Lower-level Manager
Research Questions
- To what extent do you concur that the dependability matrix in the current production matrix is sustainable?
- Strongly Disagree
- Disagree
- Neutral
- Agree
- Strongly Agree
- Does your department consider cost an important factor in the operational management of the production units?
- Strongly Disagree
- Disagree
- Neutral
- Agree
- Strongly Agree
- Do you think the current production matrix effective in terms of speed?
- Strongly Disagree
- Disagree
- Neutral
- Agree
- Strongly Agree
- How would you rate the current TQM strategies within the production department? Strongly disagree (Very poor), Disagree (below average), Neutral (not sure), Agree (above average), and Strongly Agree (excellent)
- Strongly Disagree
- Disagree
- Neutral
- Agree
- Strongly Agree
Appendix 3
Table 2. Results of the mean, rank, and standard deviation for the variables of productivity.
Appendix 4
Table 3: Results of the correlation analysis output.
Reference List
Abusa, F & Gibson, P 2013a, ‘Experiences of TQM elements on organisational performance and future opportunities for a developing country’, International Journal of Quality & Reliability Management, vol. 30, no. 9, pp. 920-941.
Abusa, F & Gibson, P 2013b, ‘TQM implementation in developing countries: a case study of the Libyan industrial sector’, An International Journal, vol. 20, no. 5, pp. 693-711.
Bansal, H, Eldridge, J, Haider, A, Knowles, R, Murray, M, Sehmer, L & Turner, D 2017, ‘Shorter interviews, longer surveys’, International Journal of Market Research, vol. 59, no. 2, pp. 221-238.
Battor, M & Battour, M 2013, ‘Can organizational learning foster customer relationships? Implications for performance’, The Learning Organization, vol. 20, no. 5, pp. 279-290.
Bryman, A & Bell, E 2015, Business research methods, 4th edn, Oxford University Press, Oxford.
Daft, R & Marcic, D 2016, Understanding management, 10th edn, Cengage Learning, London.
Eman, M, Ayman, Y & El-Nahas, T 2013, ‘The impact of corporate image and reputation on service quality, customer satisfaction and customer loyalty: testing the mediating role: case Analysis in an international service company’, Journal of Business and Retail Management Research, vol. 8, no. 1, pp. 12-33.
Gordon, J 2013, Project management and project planning, Prentice Hall, New York, NY.
Guiso, L, Sapienza, P & Zingales, L 2015, ‘The value of corporate culture’, Journal of Financial Economics, vol. 117, no. 1, pp. 60-76.
Habib, S, Aslam, S, Hussain, A, Yasmeen, S & Ibrahim, M 2014, ‘The impact of organizational culture on job satisfaction, employee commitment and turnover intention’, Advances in Economics and Business, vol. 2, no. 6, pp. 215-222.
Hahn, R & Kühnen, M 2013, ‘Determinants of sustainability reporting: a review of results, trends, theory, and opportunities in an expanding field of research’, Journal of Cleaner Production, vol. 59, no. 7, pp. 5 -21.
Harrison, J & Wicks, A 2013, ‘Stakeholder theory, value, and firm performance’, Business Ethics Quarterly, vol. 23, no. 1, pp. 97-124.
Horner, D 2013, Accounting for non-accountants, 9th edn, Kogan Page Limited, New York, NY.
Hyland, P, Lee, A & Mills, M 2015, ‘Mindfulness at work: a new approach to improving individual and organizational performance’, Industrial and Organizational Psychology, vol. 8, no. 4, pp. 576-602.
Kafetzopoulos, D, Gotzamani, K & Psomas, E 2013, ‘Quality systems and competitive performance of food companies’, An International Journal, vol. 20, no. 4, pp. 463-483.
Karatepe, O 2013, ‘High-performance work practices, work social support and their effects on job embeddedness and turnover intentions’, International Journal of Contemporary Hospitality Management, vol. 25, no. 6, pp. 903-921.
Kim-Soon, N, Hui, C & Ahmad, R 2017, ‘Quality assurance practices of the food manufacturers in Malaysia’, Advanced Science Letters, vol. 3, no. 23, pp. 317-321.
Kim-Soon, N, Rahman, A & Ahmed, M 2014, ‘E-service quality in higher education and frequency of use of the service’, International Education Studies, vol. 7, no. 3, pp. 1-10.
KIP Institute 2013, The KPI compendium: 20,000+ key performance indicators used in practice, Createspace Independent Pub, New York, NY.
Kiran, D 2016, Total quality management: key concepts and case studies, Elsevier Science, New York, NY.
Kothari, R 2013, Research methodology: methods and techniques, 3rd edn, New Age International, New Delhi.
Liu, J, Shang, J & Han, J 2017,Phrase mining from massive text and its applications, Morgan & Claypool Publishers, London.
Mangan, J, Lalwani, C & Lalwani, C 2016, Global logistics and supply chain management, John Wiley & Sons, New York, NY.
Manning, L 2013, ‘Development of a food safety verification risk model’, British Food Journal, vol. 115, no. 4, pp. 575-589.
Manning, L & Soon, J 2013, ‘Mechanisms for assessing food safety risk’, British Food Journal, vol. 115, no. 3, pp. 460-484.
Martelo, S, Barroso, C & Cepeda, G 2013, ‘The use of organizational capabilities to increase customer value’, Journal of Business Research, vol. 66, no.10, pp. 2042-2050.
Mason, J 2017, Quantitative researching, SAGE, London.
Milios, K, Zoiopoulos, P, Pantouvakis, A, Mataragas, M & Drosinos, E 2013, ‘Techno-managerial factors related to food safety management system in food businesses’, British Food Journal, vol. 115, no. 9, pp. 1381-1399.
Miller, T, Mauthner, M, Birch, M & Jessop, J 2013, Ethics in quantitative research, SAGE Publications Limited, London.
Monks, R & Minow, N 2014, Corporate governance, John Wiley & Sons, New York, NY.
Myerson, P 2015, Supply chain and logistics management made easy: methods and applications for planning, operations, integration, control and improvement, and network design, FT Press, New York, NY.
Nobes, C 2014, Accounting: a very short introduction, Oxford University Press, Oxford.
Nunes, C & Machado, M 2014, ‘Performance evaluation methods in the hotel industry’, Tourism & Management Studies, vol. 10, no. 1, pp. 24-30.
Oakland, JS 2014, Total quality management and operational excellence: text with Cases, 4th edn, Routledge, London.
Osterwalder, A & Pigneur, Y 2013, Business model generation: a handbook for visionaries, game changers, and challengers, John Wiley & Sons, New York, NY.
Rebelo, S, Matias, F & Carrasco, P 2013, ‘Application of the DEA methodology in the analysis of efficiency of the Portuguese hotel industry: an analysis applied to the Portuguese geographical regions’, Tourism & Management Studies, vol. 9, no. 2, pp. 21-28.
Saunders, M, Lewis, P & Thornhill, A 2016, Research methods for business students, 7th edn, Pearson Education, New York, NY.
Scherer, M & Stefano, F 2014, Assistive technology assessment handbook, CRC Press, London.
Searcy, C & Buslovich, R 2014, ‘Corporate perspectives on the development and use of sustainability reports’, Journal of Business Ethics, vol. 121, no. 2, pp. 149-169.
Singh, H & Singh, B 2014, ‘Total quality management: today’s business excellence strategy’, International Letters of Social and Humanistic Sciences, vol. 12, no. 32, pp. 188-196.
Sostrin, J 2013, Beyond the job description: how managers and employees can navigate the true demands of the job, Palgrave Macmillan, London.
Spinelli, S & McGowan, H 2014, Developing sustainable business models (chapter 11 from disrupt together), FT Press, New York, NY.
Strom, D, Sears, K & Kelly, K 2013, ‘Work engagement: the role of organizational justice and leadership style in predicting engagement among employees’, Journal of Leadership & Organizational Studies, vol. 2, no. 1, pp. 71-82.
Stubbs, W, Higgins, C & Milne, M 2013, ‘Why do companies not produce sustainability reports?’, Business Strategy and the Environment, vol. 22, no. 7, pp. 456-470.
Suma, S & Lesha, J 2013, ‘Job satisfaction and organizational commitment: the case of Shkodra municipality’, European Scientific Journal, vol. 9, no. 17, pp. 41–52.
Talib, A, Ali, K & Idris, F 2014, ‘Critical success factors of quality management practices among SMEs in the food processing industry in Malaysia’, Journal of Small Business and Enterprise Development, vol. 21, no. 1, pp. 152-176.