Executive Summary
This paper is an analysis of the financial performance of Premier Investment Ltd and David Jones Ltd for the FY 2010 and 2010. Different ratios have been computed for both financial years for the two firms and a comparison was drawn for the each company over the same period. The paper also highlights the limitations of ratio analysis as a method of evaluating firms’ financial performance. Finally, the study has also given the recommendations that both firms could adopt to have the desired performance.
Introduction
David Jones Limited is a listed company in the Australian stock exchange that deals with departmental stores of retail commodities. Hitherto, it has 37 functional stores located all over Australia and with Myer as its major departmental store. David Jones Limited, also informally referred to as DJS, additionally engages in financial services associations with American express. David Jones Limited has been in operation since 1838 and has managed to operate under its original name since then. The store introduced online shopping in the year 2010, a feat that was made it apparent to diversify their fashion tastes to meet the emergent international demand.
Premier investment Limited is concentrated on investments in the retailing, importation and distribution of products. The company achieves its objective of optimizing their share capitals through gaining control over shareholding in the best performing Australian companies. Initially, Premier Investments Limited was majorly a shareholder in Cole Myer Limited which changed its name to Coles Group but later sold their holding to the affiliates of Wesfarmers Limited in the year 2007.
The Purpose of Financial Analysis
Various stakeholders are interested in the financial performance of an organization. As such, financial analysis is very paramount in the furnishing different interested parties with information that is crucial in their rational decision making (Causey, 2010, p. 102). Financial analysis entails the comparison of various entities of the statement of financial position with those in the statement of comprehensive income.
Ratio Analysis on Firms’ Profitability
Profitability financial analysis involves the measure of the ability of the firm to generate returns from the investment in terms of sales revenue. The ratios depict the ability of the firm to regulate the cost of sales, financial expenses and the operating expenses that reduce the level of profit (Ott & Longnecker, 2001, pp. 145-6).
Gross profit Margin
This indicates the ability of the firm to manage the cost of the sales in generating the sales revenue. The gross profit of Premier Investment Limited increased marginally by 0.42%. The firm’s revenue from the sale of goods declined slightly from $878,494 to $875,610. The change in inventories of goods and work in-progress and raw materials used declined from $359,421 to $354,508. A decline in this level indicates that the cost of generating the sales revenue was reduced hence the increase in the gross profit margin. David Jones Limited, on the other hand, reduced the margin by 0.62% owing to the reduction in the gross profit attributable to the decline in sales revenue from $2,053,087to $1,961,744 in the year 2011.
Net Profit Margin
Net profit margin depicts the ability of the firm to monitor the financing charge that a firm incurs in its financial activities (Zimmerman, 2005, p. 200). The smaller the margin, the more the operating, financing and the cost of sales a firm has incurred in generating the revenue for the specific period. In the case of Premier Investment Ltd, the net profit margin declined drastically in the year 2011 from 16.11% to % to 5.94%. The big difference between the gross profit margin and the net profit margin for Premier Investment Ltd for both 2010 and 2011 indicates the high levels of the operating and financial expenses incurred by the firm in the FY 2011. The firm’s total expenses increased from $815273 to $849617 which explains the reduction in the net profit margin.
On the other hand, David Jones Ltd net profit margin is 22.76% less than the gross profit margin and 26.49% in the year 2010 and 2011 respectively. The huge difference indicates the high levels of the operating and financial expense that the firm incurred in the two periods. The net profit margin also reduced in the FY 2011 by 4.35%. This can be attributed to the decline in sales revenue from $2,053,087to $1,961,744 in the year 2011.
Return on Equity (ROE)
The ratio measures the return on the profitability on the funds invested by the ordinary shareholders (Kimmel, Weygandt, & Kieso, 2007, p. 150). For instance, a return of 15% indicates 15 cents of profit is attributable to 1 shilling of the ordinary shareholder’s investment. In the case of Premier, ROE decreased by 1.76% from 9.24% to 7.00% between the FY 2010 and 2011. The net profit for Premier declined drastically from $79,633 to $40,517. Reduced level of net profit explains the reduction in the ROE. Reduced net profits are as a result of increased operating expenses. Likewise, David Jones Ltd ROE also reduced by 1.46 from 22.91% to 21.45% at the same period. This may be an indication that the net profit level is reducing hence the firm should investigate the causes of the decline. The total equity for DJS also increased from $ 744,238 to $785,480while the net profit reduced. Comparatively, David Jones Ltd gave more returns to its ordinary shareholders than Premier Ltd.
Return on Asset (ROA)
This ratio indicates the profit return brought about by 1 shilling invested in the assets. This indicates the ability of the assets of a company to generate profits for the firm. Hence, a higher ratio indicates that a firm is using its assets in a productive way. For example, a ratio of 10% means Sh.10 of total asset generated Sh.1 of net profit.
In the case of Premier Investment Ltd, the return on assets declined by 6.25% between FY 2010 and 2011. This decline could be attributed to the reduction in net profit in the FY 2011and the increase in total assets for the period. The total assets for premier grew from $1,442,801 to $1,461,968. The ROA David Jones Ltd also declined by 8.77% in the FY 2011 which may have been a result of decline in the net profit.
Times Interest earned ratio (TIER)
This ratio is also called the interest coverage ratio for it evaluates the number of times the operating profit can pay the interest charges (Lipe, 1986, pp. 37-64). A higher TIER indicates that the firm operating profit is high or low interest expenses emanating from low geared capital. In regard to Premier Investment the TIER declined from 17.99 times to.5.41 times due to the increase of financial costs (interest expenses). The financial costs rose from $7869 to $9614 in FY 2011. The TIER for David Jones also declined from 49.33 times to 31.79 times. This could have been brought about by an increase in the net financing expenses for $ 7,063 to $7,789. The operating profit for DJS also declined in the FY 2011 from $242,031 to $ 239,322.
Ratio Analysis on Firms’ Efficiency
Debt Asset Ratio (total debt)
Total debt represents the combination of the fixed charge capital and other liabilities of the firm. The ratio indicates the proportion of total assets that has been financed using long term and current liabilities. For instance, if the ratio is 0.5, this implies that 50% of the total assets have been financed using borrowed funds with the rest being financed through the owners’ equity.
Premier’s DAR increased from 15.96% to 18.35% between FY 2010 and 2011. The total non-current liabilities reduced largely from $134,961 to $41,405. The total assets also grew from $1,442,801 to $1,461,968. Though the asset base increased slightly, the debt level of the firm increased to a greater extent hence the reduction in the ratio. In regard to DJS, the DAR ratio reduced from 37.72% to 35.33% between FY 2010 and 2011. This can be explained by the increase in the non-current liabilities from $137,383 to $162,937. The total assets increased marginally from $1,194,921 to $1,214,550 in the period between FY 2010 and 2011, though the growth could not match that of the debts.
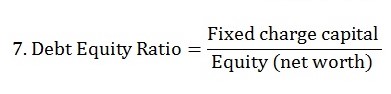
Debt Equity Ratio (total debt)
This ratio indicates the amount of fixed charge capital in the capital structure of the firm for every one shilling of owners’ capital or equity. For example, a ratio of 0.6 means for every Sh.100 of equity there is Sh.60 fixed charge capital. The lower the debt to equity ratio for the firm, the better it is as this indicates that the firm’s investments are financed by the owners’ resources.
Premier’s debt equity ratio increased between FY 2010 and 2011 from 18.99% to 22.47%. The total non-current liabilities reduced largely from $134,961 to $41,405 while the equity reduced from $1,212,495 to $1,193,738 in the period between FY 2010 and 2011. In the case of DJS, the debt to equity ratio reduced to 60.56% to 54.63% in the period between FY 2010 and 2011. The debt level increased to $162,937 from $137,383 coupled with asset growth (from $744,238 to $785,480) in the same period.
Asset Turnover (Times)
The ratio reflects amount of sales revenue generated from utilization of one shilling of total asset. The higher the ratio, the more efficient the firm is in the utilization of its assets in generating sales. Premier Investment Ltd TAT declined in the FY 2011 from 9.81% to 3.56%. This was brought about by the reduction in the annual sales revenue from $ 2,053,087 to $ 1,961,744 for the FY and the growth of the asset base in the same period. The assets grew from $ 1,461,968 to $ 1,442,801 between FY 2010 and 2011. This situation demands investigation as the sales were supposed to increase with the increase in asset base.
Similarly, the TAT for DJS also declined in the FY 2011 from 29.16% in the previous year to 20.39%. The assets grew from $ 1,194,921 to $ 1,214,550 between FY 2010 and 2011.
Inventory Turnover (Days)
The stock holding period indicates the number of days the inventory has been held in the warehouse awaiting to be sold. The more the number of days of inventory turnover, the less the sales are, hence, the firms are likely to incur more holding costs (Fraser & Ormiston, 2002, pp. 500-1). In the case of Premier Investment limited, the inventory turnover increased from 73 days in FY 2010 to 75 days in FY 2011.
This indicates that the number of days that the stock remained in the store, increased. The inventory value of Premier Investment Ltd increased from $71,730 to $ 72399 which could be the cause of the increased holding period. Likewise, the inventory turnover for David Jones Limited also increased from 83 days to 88 days. The increase could have been brought about by the increase in the level of inventory from $ 282,346 to $ 288,850 by the DJS.
Financial stability Ratio Analysis
Current Ratio
The current ratio indicates the ability of the firm to respond to its short term financial needs. It signifies the number of times the current liabilities can be paid from the current assets. The most recommended current ratio is that of 2, implying that the current assets are twice the current liabilities. Premier Investment Ltd current ratio reduced from 4.31 to 1.738. This can be explained by the upsurge of current liabilities from $ 95,345 to $ 226,825. At the same time, the current assets of Premier reduced from $ 406,716 to $ 394,242. This implies that the short-term solvency of the firm is facing a challenge with the advancement of time.
Conversely, the current ratio for DJS increased marginally from 1.04 to 1.23. Though this was a positive improvement, it is not sufficient in regard to the recommended ratio of 2. The current assets reduced slightly from $ 328,084 to $ 327,101 while the current liabilities reduced to $ 266,133 from $ 313,300 explaining the slight improvement in the current ratio.
Quick ratio
There is an improvement of the acid test ratio indicating the ability of the firm to meet its current liabilities from its most liquid resources. Short term marketable securities refer to short term investment of the firm which can be converted into cash within a very short period and includes commercial paper and treasury bills. The higher the ratio, the more solvent the firm is in the short-term. In the case of Premier, the quick ratio declined (from 351.29% to 140.07%) owing to the decline of cash and cash equivalents from $ 316,644 to $ 307,808 in the FY 2011. At the same period, the current liabilities increased more than a hundred fold from $ 95,345 to $ 226,825.
DJS quick ratio also declined slightly to 11.78% from 12.88% which could be explained by reduction in cash and cash equivalents from $ 17,594 to $ 11,703. The current liabilities for the period decreased (from $313,300 to $266,133) but less than proportionately when compared to the reduction in cash and cash equivalents.
Debtors Turnover (Days)
This refers to credit period that was granted to the debtors on the period within which they were supposed to pay their dues to the firm. Premier’s debt turnover reduced by 1 day to 3days which indicates increased debt collection efficiency. This could be explained by the reduction in the trade and other receivables from $2,632 to $2,360. The DJS debt collection turnover increased from 1.5 days to 2 days, indication a reduction in the debt collection efficiency. The receivables reduced in the FY 2011 from $22,750 to $19,637
Creditors Turnover (Days)
The ratio indicates the credit period granted by the suppliers within which the firm should settle its liabilities to the suppliers of different commodities (Fairfield, Sweeney, & Yohn, 1996, pp. 337-355). In the case of Premier, the creditors’ turnover reduced from 31 days to 24 days. This could be explained by the reduction in the level of trade payables in the FY 2011 from $54, 412 to $46,306.
Similarly, the creditors’ turnover increased in the FY for DJS reflected by the reduction in credit collection period from 36 days to 30 days. There was a reduction in the level of payables in the FY 2011 from $244,529 to $216,429, which might have contributed to the creditors’ turnover improvement. The credit policy of the firm also contributes to the reduction in creditors’ collection period.
Share Ratios Analysis
Earnings per share (EPS)
The basic earnings per share reduced to 33 cents from 34 cents in the period between FY 2010 and 2011. This may have been brought about by the increase in the number of outstanding shareholders from 502,199 to 502,199. The profit for the period also declined contributing to the reduced basic EPS. It reflects the amount of profit attributable to each share of the ordinary shareholder. In the case of Premier investment Ltd, the basic EPS 26.13 cents, a decline from the value 52.78 cents. The earnings for the period declined while the number of outstanding share increased leading to a decline in earning yield.
Earnings Yield (EY)
This ratio indicates the returns for every shilling invested in the firm (Basu, 1997, pp. 3-37). DJS earning yield amounts to 0.11 which is a reduction from 0.71. The market price for the share of DJS declined from the $4.8 to $3.0. This coupled with the fall in earnings per share contributed to a lower earnings yield.
Additional Information
All the data used in the calculations for Premier Investment Ltd and David Jones Ltd has been obtained from the audited financial reports as indicated below:
- David Jones Limited Annual Report 2011 (ABN 75 000 074 573 ACN 000 074 573)
- Premier Investment Limited Annual Report 2011(ACN 006 727 966)
Limitations
Many limitations are inherent in carrying out financial analysis of firms either as individual firms or across the industry. However, these limitations do not outweigh many benefits that can be derived from the apt application of ratio analysis tools.
First, ratio analysis ignores the size of the firms being compared in case of cross-sectional analysis. For instance, the two firms analyzed are different in terms of the capital and asset base. As such, it becomes more difficult to compare their performance in the same financial period. The technology applied by each firm and the product diversification varies across the two firms.
Secondly, rations do not factor aspects like inflation in measuring the performance of firms which are a reality in any economy. For instance, the increase in the cost of sales may be a result of increased inflation level as opposed to lack of cost efficiency in the firm.
Thirdly, ratio analysis is not able to capture the non-quantitative aspects of the firm, factors that are crucial in the performance of a firm. Such qualities may include the corporate image of the firm, the quality of the management team and customer royalty. Thus, there are more parameters that are sidelined in evaluating a firm’s performance.
Recommendations
Both firms, DJS and Premier Investment Ltd, should regulate the operating and the financing expenses. Most of the ratios such as the net profit margin declined in the FY 2011 occasioned by the increase in the expenses. Likewise, most ratios declined as a result of reduction in the sales revenue in the FY 2011. Sales revenue could be increased through improving the firms; marketing strategy in order to penetrate better in the market. All profitability ratios are affected by a reduction in the profit level implying that an increase in sales volume combined with a cost reduction strategy would lead to firms’ improved performance.
Secondly, good firm policies could be used to enhance firms’ efficiency that indicate the ability of the firm to invest the owners’ funds in the most profitable manner. For instance, good debt advancement and collection policies ensure that the debtors’ turnover is high. A firm could avoid high interest sources of finance such as bank overdrafts that stress the firms’ short-term solvency of the firm.
References
Basu, S. (1997). The Conservatism Principle and the Asymmetric Timeliness of Earnings. Journal of Accounting and Economics , Vol 24, pp 3-37.
Causey, D. Y. (2010). Accounting for decision making. Michigan University: Grid, Inc, Fairfield, P., Sweeney, R., & Yohn, T. (1996). Accounting Classification and the Predictive Content of Earnings. The Accounting Review , Vol 71 , pp 337-355.
Fraser, L. M., & Ormiston, A. M. (2002). Understanding the Corporate Annual Report: Nuts, Bolts and a Few Loose Screws (1 st ed). Prentice Hall, New Jersey.
Kimmel, P. D, Weygandt, J. J, & Kieso, D. E. (2007). Accounting: Tools for Business Decision Making (2nd ed). Wiley, Chicago.
Lipe, R. (1986). The Information Contained in the Components of Earnings. Journal of Accounting Research , 24 (Supplement), pp 37-64.
Ott, L., & Longnecker, M. (2001). An introduction to statistical methods and data analysis (5th ed). Pacific Grove: Duxbury, Australia
Zimmerman, J. L. (2005). Accounting for Decision Making and Control. Mcgraw-Hill Education, New York
Appendix
Table David Jones Limited Statistics
Table Premier Investment Limited
Ratio Computations
![]()
![]()
![]()
![]()
![]()
![]()
![]()
![]()
![]()
![]()
![]()
![]()
![]()
![]()