Introduction
Fortune 1000 is a list of the 1000 largest American companies, ranked on revenues alone, maintained by the American business magazine Fortune. In Fortune 1000 list, eligible companies are any companies, which are incorporated in the United States and their revenue is publicly available.
This paper will analyze data for Fortune 1000 largest companies in 2006 using descriptive and inferential statistical techniques. The Fortune 1000 Largest Companies in 2006 data are from the April 17, 2006 issue from CNNMoney.com. The variables considered are revenue (in millions), net income (in millions), profit or loss, and percentage profit.
According to Doane & Seward (2009), descriptive statistics refers to the collection, organization, presentation, and summary of data (either using charts and graphs or using a numerical summary) and inferential statistics refers to generalizing from a sample to a population, estimating unknown parameters, drawing conclusions, and making decisions (Doane & Seward, 2009). This paper will analyze data using descriptive summary and histograms, scatterplot, correlation, and regression analysis.
Statistical Analysis
The statistical analyses performed in this section are descriptive summary and histograms, scatterplot, correlation, and regression analysis.
Descriptive Statistics and Histograms
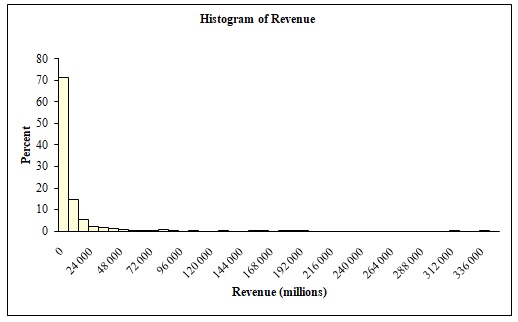
The average revenue of Fortune 1000 largest companies in 2006 was about $10,271 millions (SD = 22,848). About half of the Fortune 1000 companies had revenue less than $3,959 million. The range of revenue was about $338,509 million with minimum and maximum revenue being $1,428.70 million, and $339,938 million. The distributions of revenue for Fortune 1000 largest companies are heavily positively (right) skewed (Skewness = 8.09). This is also confirmed by the histogram of revenue as shown in figure 2. About 71.5% of companies had revenue less than $8,000 million and about 14.6% of companies had revenue in between $8,000 million to $16,000 million. Only about 8.5% of companies had revenue greater than $24,000 million.
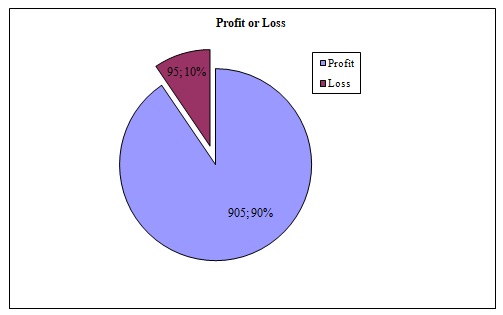
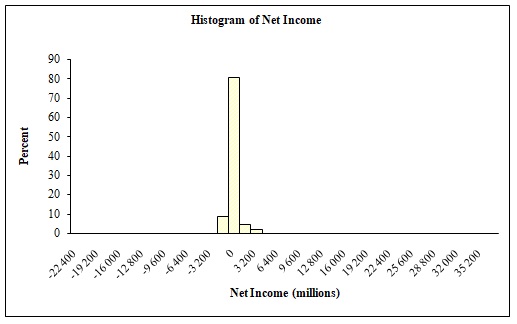
The average net income of Fortune 1000 largest companies in 2006 was about $693 million (SD = 2,285). About half of the Fortune 1000 companies had a net income of less than $228 million. The range of net income was about $57,306 million with minimum and maximum net income being -$21,176 million, and $36,130 million. The distributions of net income for Fortune 1000 largest companies are heavily positively (right) skewed (Skewness = 5.70). This is also confirmed by the histogram of net income as shown in figure 3. About 9.5% of companies had net income less than $0 million (suffered loss) and about 81.0% of companies had net income in between $0 million to $1,600 million. Only about 9.5% of companies had net income greater than $16,000 million. Figure 1 shows the percentage of companies with profit or loss. Most (90.5%) of the Fortune 1000 largest companies had profit in the year 2006.
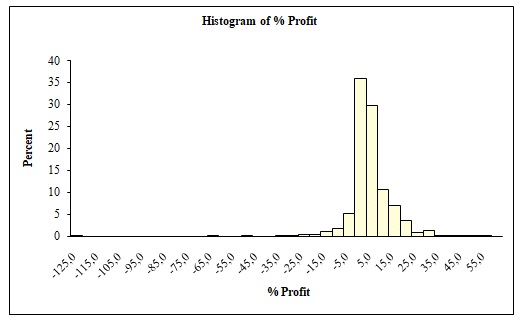
The average percentage profit of Fortune 1000 largest companies in 2006 was about 6.74% (SD =10.04). About half of the Fortune 1000 companies had a profit of less than 5.46%. The range of profit was about 178.20% with minimum and maximum profit (or loss) being -121.85% (loss) and 56.35%. The distributions of percentage profit for Fortune 1000 largest companies are negatively (left) skewed (Skewness = -2.02). This is also confirmed by the histogram of percentage profit as shown in figure 4. About 9.5% companies suffered loss (% profit < 0.00). About 36.1% companies had percentage profit in between 0% to 5%, about 29.8% companies had percentage profit in between 5% to 10%, and about 21.3% companies had percentage profit in between 10% to 25%… Only about 3.3% of companies had a percentage profit greater than 25%.
Scatterplot and Correlation Analysis
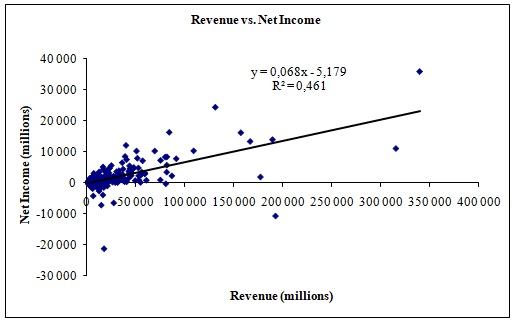
Figure 5 shows the scatterplot of net income against revenue for Fortune 1000 largest companies in 2006. There appears a strong linear direct association between net income and revenue. The value of the correlation coefficient for net income and revenue is about 0.679 that suggests a strong positive linear relationship between net income and revenue. Let us check whether the linear relationship between net income and revenue is statistically significant at the level of significance of.05 or not.
The research question is “Is there a linear relationship between net income and revenue?”
The null and alternate hypotheses are.
The selected test is a two-tailed test for zero correlation.
The degrees of freedom, ν = n – 2 = 1000 – 2 = 998.
For a two-tailed test using 998 degrees of freedom with a level of significance of.05, the critical values of t are ±1.962.
The decision rule will be
Reject H0 if t < -1.962 or t > 1.962. Otherwise, do not reject H0.
The test statistic is = 29.256
Since t = 29.256 > tα = 1.962, the decision is to reject null hypothesis H0.
Therefore, there is a strong positive linear relationship between net income and revenue.
Regression Analysis
Correlation analysis suggested a strong positive linear relationship between net income and revenue. Let us check whether revenue predicts net income or not and how good a predictor is a revenue for net income for Fortune 1000 largest companies in 2006.
The research question is “Does revenue predicts net income? And how good a predictor is a revenue for net income?”
The two null and alternate hypotheses are, and
The selected significance level, α is 0.05.
The selected test is testing regression analysis.
The decision rule will be
Reject H0 if p > 0.05. Otherwise, do not reject H0.
Using Excel, the result of the regression analysis is given in table 2.
R2 =.462, and the F-test (the ratio of regression to residual variation) is F(1, 998) =855.90, p < 001. The model is statistically significant. We reject the null hypothesis. Revenue explains about 46.2% variation in net income for Fortune 1000 largest companies in 2006. The other 53.8% remains unexplained. Therefore, revenue has a strong moderate effect on net income for Fortune 1000 largest companies in 2006.
The standardized coefficient β =.679, indicate a strong positive impact, t(998) = 29.256, p <.001. We reject the null hypothesis. Therefore, revenue is a strong predictor of net income for Fortune 1000 largest companies in 2006.
The regression equation is given by
Net Income (in millions) = -5.179 + 0.068(Revenue (in millions))
Therefore, revenue can be used for the prediction of net income for Fortune 1000 largest companies in 2006. Revenue is a moderately strong predictor of net income.
Conclusion
In conclusion, about half of the Fortune 1000 largest companies had revenue less than $3,959 million, net income less than $228 million, and percentage profit less than 5.46% in 2006. Most (90.5%) of the Fortune 1000 largest companies had profit in 2006. There is a strong positive linear relationship between net income and revenue. Further, revenue can be used for the prediction of net income for the Fortune 1000 largest companies in 2006. Revenue is a moderately strong predictor of net income.
References
CNNMoney. Fortune 1000 Largest Companies in 2006. Web.
Doane, D. P., & Seward, L.E. (2009). Applied Statistics in Business and Economics (2nd ed.). New York: McGraw-Hill/Irwin.
Appendix A: Tables
Table 1. Descriptive Statistics.
Table 2. Regression Analysis.
Appendix B: Figures and Graphs