Short Answers
- Tassal calculated depreciation using the straight-line method in 2020. This information can be obtained from the summary of financial policies under the heading “(s) Property, Plant and Equipment” on page 45 (Tassal, 2020).
- Intangible assets are non-physical assets, such as goodwill and intellectual property. Tassal recognizes several intangible assets, including R&D costs and brand names (Tassal, 2020).
- Bad debt is an account receivable that has been identified as not collectible. Doubtful debts are accounts receivable that may become bad debts sometime in the future. Bad debts are written off accounts receivable as soon as recognized, while doubtful debts remain in the reports.
- Tassal Group provisioned $884,000 as doubtful debt recorded as loss allowance. This can be located in the “Current Trade and Other Receivables” section on page 53 of the annual report (Tassal, 2020).
- The examples include buildings, plants, equipment, and land.
Cash flow Analysis
Despite significant challenges associated with the COVID-19 pandemic, Tassal managed to maintain stable cash flow. At the end of the fiscal year, the company managed to accumulate $21,860,000 in cash and cash equivalents, which is only 11% less than in FY2019 (Tassal, 2020). While such a decline in cash flows was expected, it should be noticed the company does not accumulate a secure amount of cash to finance its operations. In particular, at the end of the year, Tassal Group had enough cash to cover only 16 days of operations, disregarding depreciation. This implies that the company may appear insecure; however, comparison with the competitors may be required to understand the target value of days cash on hand.
The performance of the company in terms of cash flows is associated with several matters. First, the company experienced a 4% decline (from $602 million to $579 million) in receipts from customers due to the COVID-19 pandemic (Tassal, 2020). Second, working capital costs and payables to suppliers and employees increased (Tassal, 2020). As a result, the operating cash flow was down 44.5% to $49.9 million (Tassal, 2020).
While such performance in terms of operating cash flows may seem devastating, the Chairman’s and Chief Executive Officer’s report acknowledges the drop in operating cash flows was expected. The company planned to grow incremental inventory for both salmon and prawns stock for earnings in FY2021, which caused a rise in the cost of capital (Tassal, 2020). In order to cover the costs, Tassal Group raised $125.8 million in additional capital (Tassal, 2020). The money was spent on salmon and prawn biomass generation and the improvement of the infrastructure (Tassal, 2020).
Another significant factor that affected the cash flow statement was turning to the AASB 16 Leases standard. As a result, right-to-use assets and both current and non-current lease liabilities increased, which was demonstrated in the cash flow statement (Tassal, 2020). Additionally, in 2019, the company received a significant cash inflow ($83,794,000) from borrowings. In 2020, Tassal Group decreased the number of borrowings to $42,960,000, which also affected the cash flow.
Even though operating cash flow dropped by almost 50%, the company’s cash and cash equivalents decreased only by 11%. The central reason for a decline in the cash flow was the decrease in demand due to the COVID-19 pandemic, changes in accounting policy, a planned increase in the cost of capital, and a decrease in borrowings. Therefore, it may be concluded that the company’s health from the cash flow viewpoint is stable.
Ratios
Return on Equity
![]()
![]()
![]()
![]()
Operating Profit Margin
![]()
![]()
![]()
![]()
Inventories Turnover Period
![]()
![]()
![]()
![]()
Current Ratio
![]()
![]()
![]()
![]()
Debt to Assets Ratio
![]()
![]()
![]()
![]()
Interest cover ratio
![]()
![]()
![]()
![]()
Further Analysis
Profitability
Profitability is the ability of a company to use its resources to generate value for shareholders. Profitability is usually measured using Return on Assets (ROA), Return on Equity (ROE), and profit margin ratios. The present paper uses ROA, Gross Profit Margin (GPM), operating profit margin (OPM), and interest cover ratio to evaluate Tassal Group’s performance in terms of profitability. Ultimately, higher values of the ratios are associated with improved profitability.
It is challenging to evaluate the performance of a company without knowing the performance of competitors. However, analyzing a company without context can be beneficial for understanding the trends in performance. Tassal Group’s profitability trends are demonstrated in Table 1 below. According to the analysis, the company’s performance in terms of profitability was stable. Tassal Group even demonstrated an increase in OPM in 2020, despite the coronavirus pandemic. At the same time, the gross profit margin has been growing steadily for the past three years. This implies that the company manages its profitability carefully.
Table 1. Profitability trends.
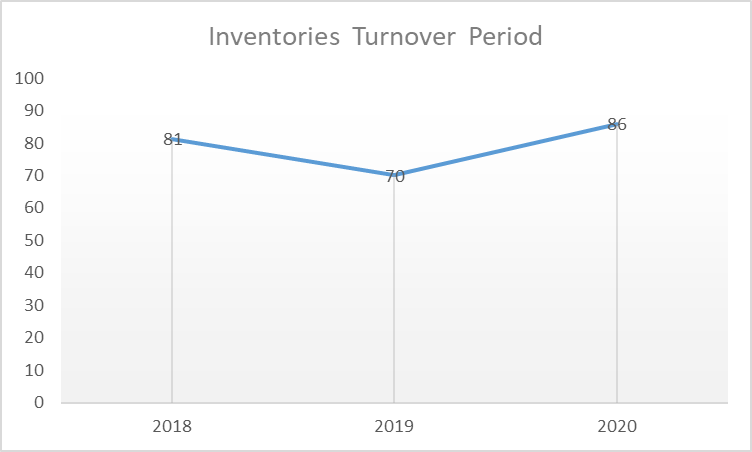
Efficiency
Efficiency ratios demonstrate how well companies use their assets and liabilities to reach internal goals. Efficiency ratios measure the turnover of receivables, repayment of liabilities, and turnover of inventory. The present paper uses the inventory turnover period to assess the efficiency of the Tassal Group. Figure 1 below demonstrates the trends in the ratio during the past three years. The analysis reflects that the company will need 86 days to turn the current inventory into cash, which is 16 days more than in the previous year. While under normal conditions, this would mean a decline in efficiency, it should be noticed that the increase was expected. The company planned to increase its inventory of both salmon and prawns to cover the expected rise in demand. Thus, a recent increase in the inventory turnover period is controlled.
Liquidity
Liquidity ratios measure how well a company can cover its current liabilities without raising additional capital. This aspect of financial performance is usually assessed using current and acid test ratios. These two ratios measure essentially the same thing. However, the current ratio uses current assets as the numerator, while the acid test ratio uses cash, marketable securities, and accounts receivable. The benchmark value for both ratios is 1, which means that the company has just enough money to cover its current debt. The values for the ratios are presented in Table 2 below. According to the analysis, Tassal Group’s performance in terms of liquidity is outstanding. The company can cover its current liabilities three times without raising outside capital. Moreover, its liquidity was relatively stable during the past three years, which is a definite strength.
Table 2. Liquidity ratios.
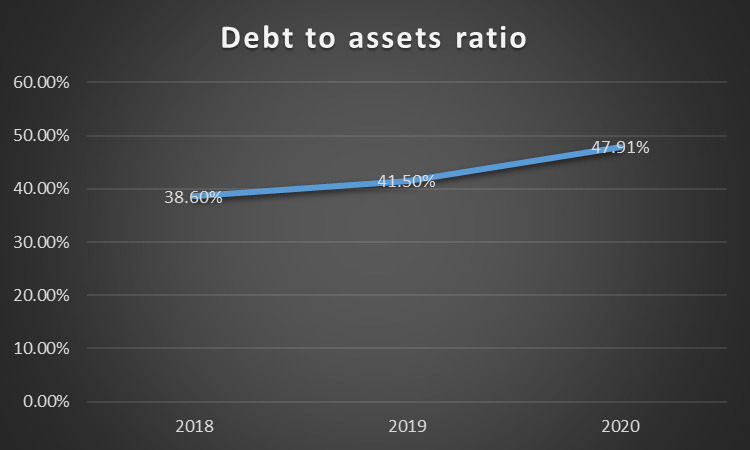
Financial Gearing
Financial gearing measures how aggressively a company uses debt for development. This aspect of financial performance is usually measured using either debt-to-equity (D/E) or debt-to-assets (D/A) ratios. The D/A ratio demonstrates the percentage of total assets financed by debt. Tassal Group’s trends in financial gearing are presented in Figure 2 below. During the past three years, the D/A ratio has been growing steadily, which implies that the company has been using debt aggressively.
Investment Performance
Investment ratios demonstrate how well the company performs in terms of the value of its stocks. This aspect of financial performance is usually measured by earnings-per-share (EPS) and share price changes. The trends in the ratios are presented in Figure 3 below.
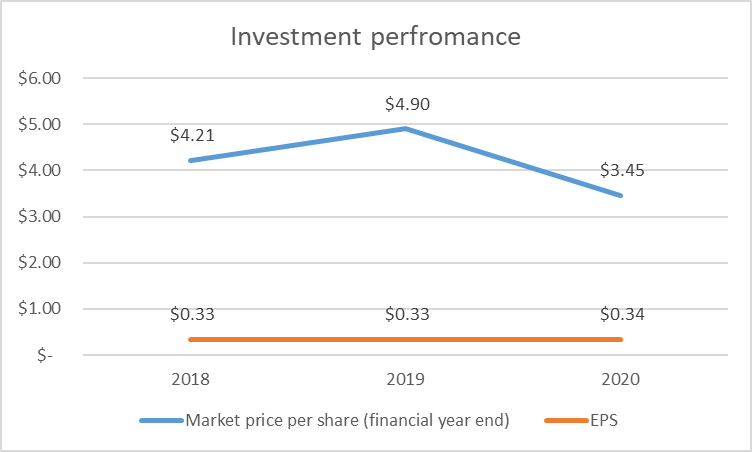
The analysis demonstrates that the company experienced a significant decline in the share price. This decline was associated with issuing additional shares to finance development (Tassal, 2020). At the same time, the company managed to maintain stable performance in terms of EPS even after increasing the number of shares.
Summary
The analysis demonstrates that Tassal Group’s financial performance was stable during the past three years. The company demonstrates consistent development in terms of profitability, which is reflected in the growth of profit margin and interest cover ratios. There were no significant changes in the company’s liquidity, which remained high during the past three years. At the same time, there are some areas of concern that should be mentioned. First, Tassal’s inventory turnover period increased in 2020, which may be a sign of decreased efficiency. Second, the company’s financial leverage grew in both 2019 and 2020, which may mean that the company is becoming more sensitive to external factors such as economic downturns. Third, Tassal Group had to issue additional shares in 2020, which resulted in a significant drop in price per share. However, it should be mentioned that all the mentioned issues were not critical.
Reference List
Tassal. (2020). Annual report 2020. Web.
Tassal. (2020). Annual report 2018. Web.