Executive Summary
Tusker Plc is a building and income improvement merchant business. It has been trading in the building and construction industry for over 50 years. Tusker Plc has been working towards maintaining its UK market and expanding into the Western European Market.
Since the 2007/2008 financial crisis, the company has improved its performance (Lybeck 2011). The last two years the company has moved from loss-making into profitability. The business performance analysis showed that in 2014 the company made a loss of £ 9 Million. However in 2015, it moved to profitability and made £ 10 Million profits. The company sorted the few challenges experienced in 2014. The supplier called Brown had to pay legal damages of £ 7 Million.
Despite the increase in the net profit, the cash and cash equivalents decreased. It was because of the purchase of equipment for the improvement of business. The cash and cash equivalents by the end of the year 2015 had a loss of £ 47 Million.
Introduction
Tusker Plc has had many challenges in the year 2014. But the desire to create a great company by the management helped the business to improve in 2015. Although the Finance Director has been absent from September 2015, the finance team ensured that the financial reports are available for scrutiny. The expansion plans are already underway and pulling out would only decrease the company’s ability to grow. Despite the challenges, the company would have to maintain its UK markets and expand into the Western European Markets.
Business Performance Analysis
Interpretation of the Statement of Profit and Loss
Tusker Plc’s profit and loss statement indicated major shifts in economic performance. The company increased its revenue for the year 2015 by about £18 Million. It is because the year 2014 had £298 Million while the year 2015 had £316 M. But the promising news is that in as much as the company increased its sales, there was a drop in the cost of sales by £11 Million. It caused its Gross Profit to increase by 17.7%. Tusker Plc retendered the bid to supply the building and construction materials in 2014. When supplier Brown won the tender due to low pricing, there came up problems with quality (Keyser 2013). Even though the supply was cost effective, the 10% less cost caused the company to lose on its quality distribution (Lewis 2009). Tusker Plc got higher proportions of faulty goods than the previous suppliers.
The trade customers became unhappy and started disputing the invoices (Machado & Diggines 2012). The company’s books increased the number of bad debts written off. Delays increased and customers had to take Tusker Plc to court. The company had to make the same deliveries twice because of quality disputes. Brown’s mistakes increased the company’s distribution costs (Epstein 2012).
In 2015, Tusker Plc increased its income by adding other operating income. In 2014, the company did not have any other operating income. In its expenditures, some of the costs that went up include administration expenses, distributions costs, finance costs, and income tax expense. The overhead expenses included administration costs which increased because of the growing number of workers from 100 to 130. The wages and salaries had to go up by a certain margin (Sharma 2010). It was because the company increased the number of workers to operate in the new plants and on the new machines. The distribution costs also increased because the company bought a fleet of Lorries for the purpose of distribution within the new warehouses (Epstein 2012). It also established three new stores to coordinate the new Western Europe market. The distribution costs increased from £16 Million to £22 Million.
The increase in finance cost was as a result of the company increasing its long term and short term loans. Some of the monies were for the use of the investment in the new market. The company acquired finance from the AlM market (Benson 2012). The bank loans went up. But the increase in debt level did not match the vision investment requirement as the company expands its operations. The growing debt did not raise the desired revenue from the expansion plans. In 2014, the company only got £5 Million in sales as a result of the debt. But there is potential that these new markets might generate approximately £90 Million on the lowest side in the years to come. The company might need to increase its marketing campaigns (Aziza & Fitts 2008).
The company made a loss of £9 Million for the year ending 2014. It was one of the lowest moments in the history of Tusker Plc. However, it made a major recover when in 2015 managed to increase its sales from a loss of £9 Million to a profit of £10 Million. Some of the contributing factors include the £8 Million other operating income and the increased sales for the year 2015 (Lai 2013).
The profitability ratios indicate that the Revenue Growth stood at 6% from the year 2014 to the year 2015. The year 2014 had a Gross Profit Margin of 10.1% while the year 2015 had 18.7%. The total margin available to cover the operating expenses to earn a profit improved by 8.6%. The steady growth points the company in the right direction for improvement in the current markets (Madur, 2015). The company needs to boost its marketing campaigns in the UK market to maintain the growth experienced in 2014/2015 results (Libby, Libby & Short 2011). The sales improved because the company had proactive customer service. They could replace default items within a short time. They also responded to customer queries and managed to sort any pending issues on time. The high service levels within the stores also contributed to the improved sales. As compared to online fixed prices by competitors, Tusker Plc could negotiate the price with consumers.
The operating expenses and the overheads significantly diminished the Net Profit Margins in 2014. It stood at 0.3% per pound of sales. It also reduced because of the increased cost of sales. In 2015, the Net Profit Margin grew to 8.2%. In 2014, the Interest Cover Ratio was 0.11. It means that the company was not earning enough income and profit to service its debts sufficiently. The operating profit could cover the finance costs for 1.86 times. The Sales Director’s salary had increased by 50% based on performance in terms of sales increase. The board also increased the other board members’ basic salaries. The costs for operating the business increased even when it was not earning enough profit.
The interest coverage ratio is critical for the long-term creditors to the enterprise (Epstein 2012). It determines the ability of Tusker Plc operations to provide protection to its long-term creditors. In 2014, creditors could not feel protected by the number of times the interest earned ratio. It was 0.11. But in 2015, Tusker Plc increased its ability in making its periodic interest payments to the long term creditors (Worldbank 2016). Although 1.86 coverage times is still subtle, there is potential for greater improvement. The company needs to reduce its loan size to prevent high risk of default. It can sell some of its assets to offset the loans. It can also raise more capital by issuing shares to current and new shareholders. The company should also reinvest the retained earnings into the current projects.
The horizontal analysis helps to determine the pound and percentage changes in account balances. For revenue, the change was £18 because of the increased business. The Cost of sales went up by £11 due to the replacement costs and legal charges. Other Operating Income was £0 because the base year did not have any income. The salaries and wages for the Board and the new staffs caused the Administration Expenses to increase by £ (6) Million.
The finance charge had £(5) Million. The company increased its debts. Profit before tax change was £20 Million because of increased sales (Ramachandran 2009). The highest percentage pound change was the operative profit which had 2500% change because of the increase in Administration and Distribution costs (Epstein 2012).
Statement of Cash Flows Analysis
The statement of cash flows indicates where the cash is in business (Epstein 2012). It helps to determine the company’s financial performance. Tusker Plc recorded a Profit before tax of £ 12 Million in the year ending 31st December 2015. But there were certain obligations the company had undertaken in the course of the year which did not exist in 2014. The firm had increased its inventories for £11 Million. It had also acquired plant, property and equipment at £98 Million. It had receivables which were adding up to £14 Million. Many consumers decided to use the available credit services so that they can be sure of the quality of the products. The firm paid an interest of £14 Million and made the income tax contribution of £2 Million. It also paid the shareholders a dividend of £3 Million. All these financial decisions resulted in the decrease in the cash and cash equivalents for the year 2015 (Shim 2009).
The Net Profit Margin indicated that the year 2014, the operating profit was 0.3% of the Revenue. In 2015, it increased to 8.2%. It was due to the improvements in the cost of sales and the plan to reduce the company expenses. The equity and debt only contributed 0.3% towards the company’s profit in 2014 and 6.8% in 2015. It was an improvement of about 6.5%. The inventory took 72 days to get finished in 2014 and 91 days in 2015 (Ridgers 2012). It took 36 days to receive payments from debtors in 2014 and 50 days in 2015. The increase in the number of days resulted from the poor quality supplies from Brown. The company’s ability to service its payables was also of primary concern since it was now taking longer because of the unavailable cash. The operating cycle in 2014 was 53 days while the year 2015 it was 58 days. Tusker Plc increased its gearing from 38% to 47% in 2015 (Daniela & Attila 2013).
Capital expenditure ratio. It is the company’s ability to cover debt after maintenance or investment on plant and equipment.
Cash flow from operations = 2 =0.02
Capital expenditures 98
A company that is stable financially can easily finance its growth strategy. For Tusker Plc, the ratio measured the money that would be easily available for use internally for servicing debts. When the capital expenditure ratio exceeds 1.0, Tusker Plc does not have problems meeting its financial obligations. The higher the value, the more extra cash the company has to repay debt (Robinson 2009). The 2015 Capital expenditure ratio is below 1 and hence the company may not be having enough cash for further internal use. It may not meet its financial obligations on available. It is the reason it has to go for financing.
Total debt ratio. It measures the ability of the company to pay debts that may be available in future.
Cash flow from operations = 2 =0.01
Total debt 180
Total cash flow to debt. The credit-rating agencies and loan decision officers use this ration to validate a company’s strength. It shows the users how long it would take for the company to pay a loan if it has to pay its debts using cash flow from operations. If the ratio is lower, it portrays a negative aspect for the company’s financial needs from financing institutions. In case of financial problems, the company may not find capital easily. Financial experts and loan officers use this ration to appraise a company’s flexibility.
Company’s credit quality. The ratio requires computation of Tusker’s net free cash flows. The formula uses the Earnings Before Interests, Taxes, Depreciation and Amortization. It also uses the taxes, interests and capital expenses (Davis & Nairn 2012). It includes the annual debt maturities for a five-year season. The adequacy of cash flow adequacy is critical to any organization that seeks to make expansion progress. It allows a company to make large payments at once without affecting other company expenditures.
Companies that have strong NFCF ratios normally have an easier way of securing debt for internal and external activities. It is always better for a company to finance its activities internally than to seek outside capital. Tusker is slowly working towards this achievement.
Operating cash flow. The ratio measures the ability of the company to It is the company’s ability to raise capital that can pay its current liabilities.
Cash flow from operations = 2 =0.02
Current liabilities 105
The ratios for 2015 shows that Tusker Plc is struggling to meet its obligations. It has to increase its cash flows from operations by increasing its revenues.
Ratio Analysis
Sams Management Consultants needed to know Tusker’s businesses and the industries in which they operate. As with any other ratio, Sams Management Consultants listened to Tusker management’s explanation about any unfavorable changes in cash rates. The Consultants sought to establish the assets and liabilities concerns to the company. The ratios help to work out the business’s vision and objectives.
As Consultants, Sams Management Consultants had to ascertain whether the accountants fairly presented the financial statements in agreement with Generally Accepted Accounting Principles. The investigation included a thorough review of the accuracy of transactions. Apart from just using the figures in the summarized financial statements, there was need to check the objectives of the capital and expenditure in the documents. The cash flow ratios normally help to confirm the understanding of the money concerns critical to Tusker Plc.
Ratio analysis is necessary because the ratios help the company to understand its profitability, solvency, and leverage (Davis & Nairn 2012). They also measure the growth of the enterprise. For instance, the revenue growth ratios showed how Tusker Plc grew its revenue by 6% for the last one year. The company can check on its activities and employ the skills they used now more vigorously to achieve more growth. However, the revenue growth ratio may also discourage performance within the company if the goal set is not achievable. It may cause the business’s leadership to stop their expansion plans into the Western European markets.
The gross profit margin ratio was critical to the establishment of the trend in the changes of profitability for the past two years. It may help the Tusker Plc to consider minimizing the cost of sales further. When the cost of sales reduces, the profit margins go up considerably. If increasing revenue enhances the gross profit margin, Tusker can use this ratio as the basis for doing extensive marketing to improve its sales (McDonald, Payne & Frow 2011). However, the ratio does not in itself improve performance for the company. Growth and performance require the effort of the directors, managers, workers, and owners of the enterprise.
The financial statements do not give the full information about the financial health of the organization (Bansal 2009). The ratios showed the company’s ability to repay loans from outside sources. Tusker Plc has bank overdrafts and other financial obligations at AIMs and other lending institutions. Ratios also measure the ability of the company to pay dividends to shareholders. They can also help the company to know if it can stop paying dividends to the shareholder to concentrate on growth. Ratios show how readily a company can raise new capital.
Tusker Plc is relying heavily on loan to finance its activities and expansion plans If Tusker Plc cannot use the ratios to improve internal operations, their finance providers would use them o deny them capital. Ratios help to give full disclosure. They also provide avenues for questioning certain transactions and scrutinize faulty investment plans (Mountain & Davidson 2011).
Investment Appraisal
Investment estimates frequently evaluate the attractiveness of an investment proposal. Tusker Plc used the management forecast, payback period, accounting rate of return and net present value tools to appraise the project. The company has made every effort to deal with any challenges and successes of the planned investment (Borkowski 2015).
Management Forecast
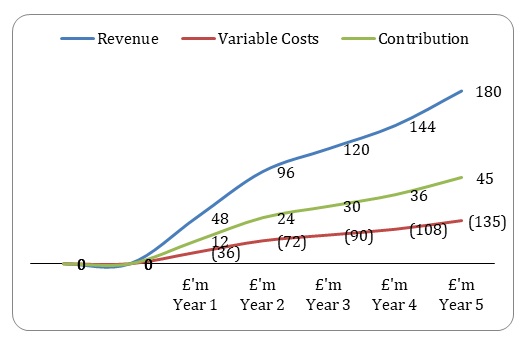
The management forecast indicates that there would be the gradual growth of the revenue. The profitability estimates on the variable costs. The 25% contribution is just an estimate to consider without looking at other aspects of market competitiveness, inflations, and challenges. It is easy to prepare such a report because it bases on past records of other companies and variables. The disadvantage of the management forecast is that it can involve guesswork. There are no valid points to consider as the basis and value of the market credibility (Keillor & Wilkinson 2011). The accountants and or the management can use them to manipulate decision-making process. It is important for the management to consider other avenues for appraising an investment because it cannot solely depend on this appraisal tool.
Payback Period
Payback period measures the time that the organization would take to recover its investment and loan in the Western European market. The company anticipates getting its investment at 25% per annum. Therefore, the five years would be most appropriate for the same. It works on assumptions. For instance, Tusker Plc assumes that the income from the investment would occur evenly during the five-year period. It would take the company approximately four years and five months to pay back its investment (Borkowski 2015). Payback period is critical because it uses the time to validate the payback period. One limitation about this appraisal tool is that the market is dynamic, and other economic challenges may significantly affect the anticipated results.
Accounting Rate of Return
It is an investment appraisal that determines how Tusker Plc would gain on its investment. It works by adding together all the cash flows over the years that the company would invest the money. One should minus the initial investment and divide the amount by the number of years anticipate (French 2012). For Tusker, it had a target of 8%. But the ARR showed that it would be 9%. It helps the management to validate the importance of investment and make a choice of whether to proceed with it or stop it. The challenge of using ARR is that the estimates may change from year to year when the actual cash starts flowing in. The period may be elongated or reduced depending on the returns from investment.
Net Present Value
It involves the computation of the present value of the expected cash flows by discounting them at the required rate of return (Borkowski 2015). The Net Present Value of Tusker has a cost of capital which is 5%.
The investment of £120 Million today at 5% would yield £124 Million at the end of the five-year period. Therefore, the present value of £124 Million at the desired rate of return of 5% is £120 Million. After the deduction of £120 Million from £120 Million, the figure would be £4 Million (Hoerl & Snee 2012). The £4 Million is the expected return on the investment. It is one of the best appraisal techniques because the approximations assist the management in making a decision based on the expected value. If they think it is too small, they can change or improve the investment idea. The problem with the appraisal techniques is that it uses a fixed discount factor. The market dynamics are not permanent. Many things eventually affect business performance and the figures may change (Bansal 2009).
Non-Financial Factors
Some of the nonfinancial investment appraisal factors include adherence to the current and future legislation, ensuring that the market standards and good practice are compulsory, and motivating the staff and capacity building. They need to have good relations with the suppliers and customers. They have to adapt to the culture of the local community and incorporate it in the organization. Tusker Plc would have to deal with future threats.
Tusker Plc would need to balance financial and non-financial factors. The management would decide how important each factor is to the business (Benson 2012). The company would also include Corporate Social Responsibility. Tusker would choose the CSR project that is essential for the new market. The backend sales from investing in some non-profitable projects would help to attract more business. Satisfaction of the customers should be one of the key considerations. The company would need skilled manpower that would operate its equipment. Tusker Plc would need to consider all the government regulations of the new market to avoid conflicts with the law enforcers. The actions of the competition would be essential for the investment appraisal (Hope & Player 2012). Tusker Plc should also consider looking at the industry and market trends to establish if there s potential in the proposed market.
Sources of Internal Finance
Tusker Plc can also invest in its business. The company has access to some internal finance. Already, there is some sense of skepticism when it comes to the overdrafts and loans from other institutions like the AIM and bank lending (Buettner, Overesch & Wamser 2015). The amount could not meet all its requirements.
Retained earnings
They are a natural source of internal financing for Tusker Plc to use because they come from the liquid assets. The portion of net income that Tusker Plc has retained is approximate £ 130.8 Million. It had already paid out a dividend of £ 2 Million to shareholders. Tusker Plc can use the retained earnings to finance its Western European markets (Madura 2015). The directors can also raise the concern with the shareholders so that by the coming financial year, they allow the company to use the dividend payout to increase its business performance (Cinnamon, Helweg-Larsen & Cinnamon 2010).
Fixed Assets
Tusker Plc has fixed assets that include equipment, property, and factories. It can sell off some materials and property in the UK market that is not performing. If it has over 80 distribution channels in the UK, some of those channels can be consolidated into one major distribution channel. The company can also allow its retailers to acquire some of those channels so that it can free the company from some of the costs (Cumming 2012). The proceeds from the sale of such channels and the expenses incurred to manage them would be available for investment into the new market. The company has already purchased new equipment and would not be in a rush to buy another one for the UK market. The UK market would only need intense marketing strategies (Levison 2010).
Shareholder’s Investment
The shareholders would be the primary beneficiaries if and when the company increases in profitability. It would be prudent for the investors to fund the expansion by increasing their shareholding in the enterprise. Another option would be to ask new shareholders to invest capital into the business (Cumming 2012). The company would grow internally without having to go for expensive debts.
Conclusion
Tusker Plc has a chance to improve its business performance in the UK and expand into the Western European markets. The UK market requires increased activity in marketing and good choice of suppliers for the business. The new Western European market needs a new team that is aggressive and focused on putting the company into profitability. For the first year in 2015, it made revenues of £ 5 Million. The revenues can grow from intensive marketing and quality supply of products. The investment appraisals indicate that the company needs to focus on raising capital that is not expensive. It would be beneficial in the long run.
References
Aziza, B & Fitts, J 2008, Drive business performance, John Wiley & Sons: Hoboken, New Jersey.
Bansal, S 2009, Technology scorecards, Wiley: Hoboken, New Jersey.
Benson, R 2012, Economic performance, Nova Science Publisher’s: Hauppauge, New York.
Borkowski, P 2015, ‘Applicability of reference based appraisals in assessment of real sector investment projects’, Prace Naukowe Uniwersytetu Ekonomicznego we Wrocławiu, vol. 35, no. 6, pp. 401-403.
Buettner, T., Overesch, M & Wamser, G 2015, ‘Restricted interest deductibility and multinationals’ use of internal debt finance’, International Tax and Public Finance, vol. 15, no. 1, pp. 220-222.
Cinnamon, R., Helweg-Larsen, B & Cinnamon, P 2010, How to understand business finance, Kogan Page: London.
Cumming, D 2012, The Oxford handbook of entrepreneurial finance, Oxford University Press: New York.
Daniela, P & Attila, T, 2013, ‘Internal audit versus internal control and coaching’, Procedia Economics and Finance, vol. 6, no. 1, pp. 694-702.
Davis, J & Nairn, A 2012, Templeton’s way with money, Wiley: Hoboken, New Jersey.
Epstein, L 2012, The business owner’s guide to reading and understanding financial statements, Wiley, Hoboken, New Jersey.
French, N 2012, ‘The discounted cash flow method for property appraisals’, Journal of Property Investment & Finance, vol. 30, no. 3, pp. 231-232.
Hoerl, R & Snee, R 2012, Statistical thinking, John Wiley & Sons: Hoboken, New Jersey.
Hope, J & Player, S 2012, Beyond performance management, Harvard Business Review Press: Boston, Massachusetts.
Keillor, B & Wilkinson, T 2011, International business in the 21st century, Praeger: Santa Barbara, California.
Keyser, S 2013, Winner takes all, LID Pub: London.
Lai, R 2013, Operations forensics, MIT Press: Cambridge, Massachusetts.
Levison, L 2010, Filmmakers and financing, Focal Press: Burlington, Massachusetts.
Lewis, H 2009, Bids, tenders & proposals, Kogan Page: London.
Libby, R., Libby, P & Short, D 2011, Financial accounting, McGraw-Hill/Irwin: New York.
Lybeck, J 2011, A global history of the Financial Crash of 2007-10, Cambridge University Press :Cambridge.
Machado, R & Diggines, C 2012, Customer service, Juta: Lansdowne, South Africa.
Madura, J 2015, International financial management, Cengage Learning: Australia.
McDonald, M., Payne, A & Frow, P 2011, Marketing plans for services, John Wiley: West Sussex, UK.
Mountain, A & Davidson, C 2011, Working together, Ashgate Pub: Farnham, Surrey.
Ramachandran 2009, How to read a profit and loss statement, Tata McGraw Hill Education Pvt. Ltd: New York.
Ridgers, B 2012, The economist book of business quotations, Profile: London.
Robinson, T 2009, International financial statement analysis, John Wiley & Sons: Hoboken, New Jersey.
Sharma, N 2010, Business finance, ABD Publishers: Jaipur, India.
Shim, J 2009, The art of mathematics in business, Global Professional Publishing: Cranbrook, Kentucky.
Worldbank 2016, Web.