Historical Monthly Rates of Return for the Market Index
Monthly Return Rate = {(Current Month Return – Previous Month Return) ÷ Previous Month Return} × 100%, Therefore:
- Jan-2020 Return Rate = {(75179 – 71814) ÷ 71814} × 100% = 4.69%
- Feb-2020 Return Rate = {(69106 – 75179) ÷ 75179} × 100% = -8.08%
- Mar-2020 Return Rate = {(54634 – 69106) ÷ 69106} × 100% = -20.94%
- Apr-2020 Return Rate = {(59847 – 54634) ÷ 54634} × 100% = 9.54%
- May-2020 Return Rate = {(62862 – 59847) ÷ 59847} × 100% = 5.04%
Historical Average Rate and Standard Deviation of Returns
The computation of average return rate is achieved by summing up all monthly return rate divided by the number of months accounted for in the evaluation. On the other hand the standard deviation is calculated by finding the square root of the sum of the squares of the differences between the monthly return and expected return. Therefore:
- Average Return Rate of Case Company (NCK) = (1.44% + 1.71% + -52.73 %+ 37.57% + 20.43%) ÷ 5 = 1.68%
Standard Deviation of NCK
= Square root of (0.0576 + 0.0009 + 2960.4481 + 1288.0921 + 351.5625) ÷5 = 920.03224
= Square Root of 920.03224
= 30.33%
- Average Return of the Reference Company = (1.00% + 5.00% + 40.00% + 1.00% + -3.00%) ÷ 5 = 8.8%
Standard Deviation of Reference Company
= Square root of (60.84% + 14.44% + 973.44% + 60.84% + 139.24%) ÷ 5 = 1248.8 ÷ 5
= Square root of 242.56
= 15.57%
- Average Return of Market Index = (4.69% + -8.08% + -20.94% + 9.54% + 5.04%) ÷ 5 = -1.95%
Standard Deviation of the Market Index
Standard Deviation = Square root of (44.0896% + 37.5769% + 360.620% + 132.0201% + 48.8601%) ÷ 5
Square root of 124.63334 = 11.16%
- Average Return of Portfolio = 0.4 × 1.68% + 0.6 × 8.8% = 5.952
Standard Deviation of Portfolio
= 0.4(1.44% + 1.71% + -52.73 %+ 37.57% + 20.43%) = 3.37
=0.6(1.00% + 5.00% + 40.00% + 1.00% + -3.00%) = 26.4
0.4(3.37 – 5.957)2 + 0.6(26.4 – 5.952)2
Square root of 253.54945 = 15.92%
Calculations of Expected Returns of Case and Reference Company
Capital Asset Pricing Model (CAPM) = Risk Free Rate + Beta × Risk Premium
Case Company = 0.89% + 1.6409 × 6% = 10.74%
Reference Company = 0.89% + -0.40 × 6% = -1.51%
Calculations of Expected Return and Beta of Portfolio
Expected Return = 0.4 × 10.74% + 0.6 × -1.51% = 3.39%
Beta = 0.4 × 1.6409 + 0.6 + -0.4 = 0.42%
Theoretical Concept of Risk and Returns
The objective of investors is to make profits by adding value to their assets given out for trading. However, the nature of returns and risks associated with the intended business dictates whether an initiative can be taken quickly by an individual to put in resources to run the industrial business as a share or bondholder. Thus, the risk is perceived as the probability of incurring losses upon releasing one’s properties for trading (Senthilnathan, 2016, p. 705). On the other hand, return stands for the total quantity gained by shareholders and bond owners in a company upon investing. Both the risk and returns are affected by changes experienced in the process of cash distribution and the value of commodities in the market. When a given product from a company is on-demand, its value escalates, leading to high cash flow within the sector of investment as compared to other business (Senthilnathan, 2016, p. 705). It implies that risks and returns will easily influence perceptions of investors and the success of a given business in the market.
The Relationship between Risk and Returns in Business
Direct proportionality exists between the risks associated with a business program and the expectations of investors from the returns. When an individual would easily incur losses upon venturing into a given commercial activity, the anticipated gains upon succeeding in it is usually big. It is, therefore, possible to determine the expected returns in a given industry by expressing it in terms of risk free returns and premium risks (Buchner et al., 2017, p. 521). Ideally, returns which are free from risks are termed as secured by trading policies. Premium risks entail business plans which are highly associated with chances of losing upon investing. Normally, succeeding in risky businesses leaves the investor with an exclusive large amount of returns (Senthilnathan, 2016, p. 710). Important to note is that losses incurred through premium risk investment are taken care off through long term investment.
Risks and Returns in a Portfolio Business
Portfolio business entails pooling assets together to diversify the risks associated with business attributed to high expected returns. The objective is to minimize losses incurred by venturing into businesses that differ in the qualities of profit-making (Buchner et al., 2017, p. 524). For instance, when two products aimed at meeting the highest quality expectations but at an exorbitant price to consumers, succeeding to sell few of them yields great returns. Moreover, such businesses are linked to limited losses as assets are pooled together to meet the market demands. Thus, return in a portfolio is determined as the average of profit gained from a single resource (Senthilnathan, 2016, p. 713). Therefore, the portfolio is significant in diversifying the risks to maximize income.
The Implication of Calculated Measures on Nicks Scali (NCK)
The standard deviation for the case company and Reference Company is 30.33 percent and 15.57 percent respectively. Standard deviation measures the riskiness of the investment. High standard deviation implies high volatility of an investment. Hence, Nick Scali Company is riskier than the reference company. Through diversification, the standard deviation is reduced to 15.92 percent, which would make it a reliable business plan for long term investors.
Beta coefficient shows the amount of risk that cannot be diversified in an asset. The beta of the case company is 1.6409 while that of the reference company is -0.40. An implication is that more risk in Reference Company can be diversified as compared to that of the case company with 1.6409 undiversifiable risks. The high beta 1.6409 clearly indicates that the Nick Scali Company is riskier than the reference company. Through investing in a portfolio, more risk is able to be diversified, and the beta becomes 0.42 percent.
Using the CAPM model, the expected return of the case company, which is Nick Scali and that of the reference company is 10.74 and -1.51 percent, respectively. From the expected returns above, Nick Scali Company has high expected return as compared to that of the reference company. Usually, returns have a positive relationship with the return in that the higher the returns, the riskier the investment. From the analysis above, Nick Scali Company is highly riskier than the reference company that has a negative return. The individual who is risk-averse will prefer investing in the reference company since it is less volatile in as much has low return is expected from it (Senthilnathan, 2016, p. 712). However, risk lovers would go for the Nick Company that promises a higher return in as much as it is riskier.
The market normally faces two risks that are systematic and unsystematic risks. Unsystematic risks are the ones that affect a single asset and can be diversified while systematic affects the entire market and cannot be diversified. Unsystematic risks are eliminated through investing in a portfolio, as shown below.
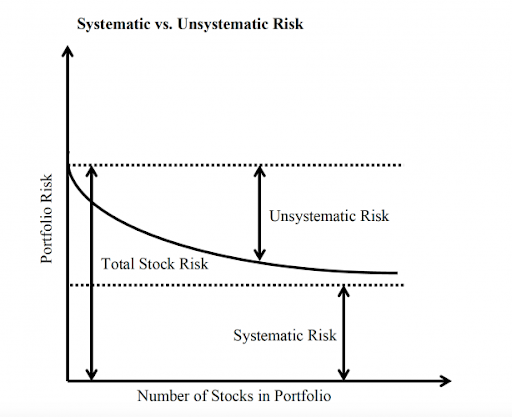
From the diagram above, the unsystematic risk is eliminated through diversification in the portfolio, while systematic risk remains the same. Through the analysis, diversification of investment in a portfolio results in an expected return of 3.39 percent, which implies a low risk as compared to when the investor only invests on Nick Scali Company. Negative return that associate with investing in the reference company alone is also eliminated through diversification in the portfolio (Buchner et al., 2017, p. 526). Therefore, diversification of investment through the portfolio is relevant to avoid low return that associates with low risky investment and high return that are risky.
Reference List
Buchner, A., Mohamed, A. & Schwienbacher, A. (2017) ‘Diversification, risk and returns in venture capital’, Journal of Business Venturing, 32(5), pp. 519-535.
Senthilnathan, S. (2016) ‘Risk, return and portfolio theory – a contextual note’, International Journal of Science and Research, 6(14), pp. 705-715.