Abstract
This paper explores the relationship between innovation outcomes, absorptive capacity, and human resource management practices in information technology outsourcing relationships. Previous research has highlighted the need for absorptive capacity to achieve innovation in organizations. Since this absorptive capacity is likely to be embodied within the relationship management teams of both the supplier and client in outsourcing dyads, the human resource practices of the participating firms should have a direct bearing on levels of absorptive capacity and innovation outcomes for the relationships. This research examined four large IT relationships as case studies and presents a model of inter-organizational innovation that shows the necessity of developing the appropriate absorptive capacity to achieve innovation in outsourcing environments. From this model, the research presents three HRM practices that can help develop an absorptive capacity to support innovation activities: retention of client employees with firm-specific business process knowledge rather than technical knowledge; minimization of legacy hiring practices for suppliers; and maintaining an optimal workgroup size for relationship management teams on both the client and supplier sides of the relationship. Firms in the automotive industry are becoming more aware of the changes needed to certain aspects of operations to achieve improvement. For instance, Typhoon HIL has invented a simulation model that can better the testing procedure in the sector, which has gained the company success in the market even though they have not applied any marketing strategies yet. Depending on luck cannot guarantee long-term success in the market, and therefore, the organization wanted to know how to differentiate itself from others. Through the survey method, the researchers obtained information on positioning the firm to gain more market share and thus expand their operations. The whole process was based on the TAM model and Porter’s five forces, which means that the sample profile and the size under investigation were important.
Introduction
Evolution instead of revolution. Established companies are keepers, and they are conscientious, compliant, and value perfectionists. Firstly, the problem is: “Established Companies fail due to digitization” Secondly, the massive influence of the digital revolution increases the pressure on established companies. Nevertheless, the challenge to change is difficult and a hurdle for young companies to enter. Disruptive innovations, dynamic market environments, augmented reality, artificial intelligence, big data, cloud services, robotics, and automation, in short, digitalization and its consequences encourage established companies to radically rethink their strategies and business models.
The continuous development of concepts to grow the sales revenues will be an essential part of the core competencies of young companies in the future. These companies, therefore, are able to withstand the young dynamic startups and ensure their future viability. Lastly, speed of collaboration and increasing market shares is one the decisive success factors. Whereby on the other hand, established companies need a faster and more reliable product simulation and verification for use in industrial applications or in the Automobile Industry in the charging behavior of loading stations or power trains of the electric vehicles.
Therefore, it is possible to develop a better simulation and verification which is followed by test automation through the HIL concepts. In addition, the processes need to be optimized in order to be ahead of the competition in the local and global market. Technology has innovated the way most people live their personal life and aggregate business. Most business and individual organizations rely mostly on technology products or services to make their daily performances more convenient. As a result, information technology (IT) products and services are developed and modeled based on convenience of use and usefulness.
These two determinants help to explain user decision-making and behaviors across a wide range of technologies. Ease of use and usefulness serve as incentives for customers to accept and adopt the technology. They are the main components in models used to assess technology adoption, such as the case of Technology Acceptance Model (TAM). TAM Model allows to predict and explain user IT adoption of established technologies. It will be the main actor in this master thesis. Typhoon-HIL is a company that belongs in the category of Small and Midsize Companies (SMEs).
The end product producer, who are the customers of Typhoon-HIL, like a Power-Converter or Drives Train Supplier, is referred to as OEM, which is the abbreviation for Original Equipment Manufacturer. By definition, the next layer below consists of the module and system suppliers, short phrased as tier 1. The next layer consists of the component suppliers, named Tier 2, who get their input from the part suppliers, who are classified as Tier 1. At this moment of time, Typhoon HIL can be named as a Tier 2 supplier, delivering hardware-boxes. This is described in figure 1.
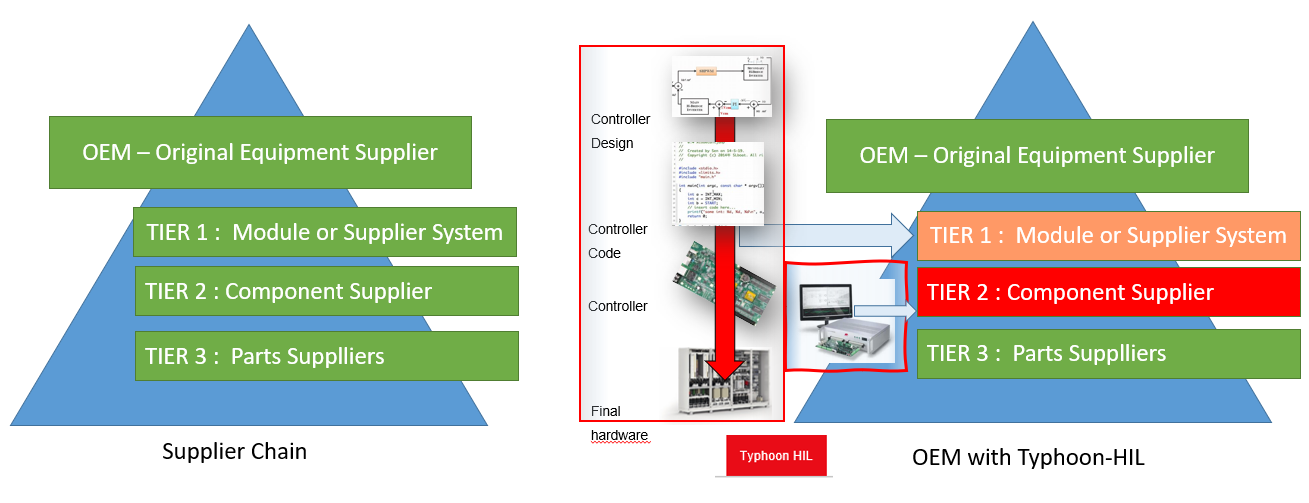
The company developed a simulation model with hardware in the Loop, short HIL, to improve the reliability and the quality of testing applications for Drives and Convertors in the Industry, which includes segments like Solar, Process Industry and Electrical Vehicle (EV) Market, but is not limited to that. From the start, strong interaction with academia was in place, and the product improvement happened rapidly. Some early-adopting customers introduced the hardware and software in their work process of testing and development of products.
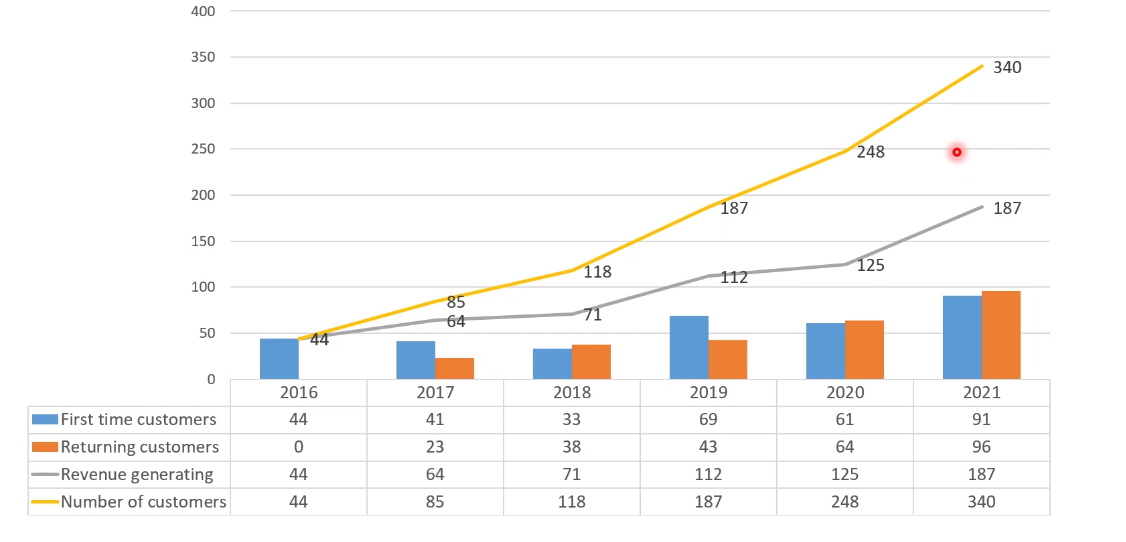
Revenue generation started to happen without much commercial effort. From a finance point of view, the balance sheet always showed positive results. The challenge is to ensure that this will continue without fail with the aim of extensive growth. There is no desire to sell the company since the small quantities of hardware/software licenses got sold to Cooperates like ABB, Schneider, and American Battery Pack Suppliers. Strong bonding with Academia allowed participation in funded projects, which impacted quantitatively and high-quality research because the concept of HIL resonated with the market and competition is limited in this niche market.
Starting in 2007, the company was founded with the support of venture money from Ray Stata, the Chairman of Analog Devices, Inc. Typhoon HIL was established as a family-owned company by the brothers Nikola and Ivan Celanovic, who both completed their Ph.D. in Boston. Nikola worked at the ABB Research Centre and Drives Division as Engineering Manager. He recognized that there was a great potential for digital transformation in the testing and validation of solutions. He started his own company. The capital venture funds have to be fully returned by the end of 2022 indicating that the company balance sheet is healthy.
The organization operates globally and is a conglomerate of academics and other people with different technical backgrounds and life experience, great talent, but low business and commercial background in sales, till now. The aim of this research is developing a model based on the TAM model, reflecting the Framework of the Theory of Porter’s Five Forces. What are the main perimeters to design an environment for constant growth and an increasing leading market position?
Following a review of the literature, the research hypotheses and conceptual model are proposed in the second section.
After explaining the research methodology and collecting research data based on case studies in the third section, the fourth section will clarify the analysis and results. Finally, after discussing and interpreting the findings and limitations, recommendations for future business growth will be outlined from the research point and not a consulting point. This study is a qualitative type of research that uses a survey to obtain information that will respond to the research questions. The topic has been chosen according to Porter’s Five forces and the TAM model to analyze the scalability of HIL, Hardware in the loop, solutions in the general Industry Sector, and EV Mobility. It also reviews if there is an impact on the usage dependent on the academic curriculum.
Rationale
Though, for over ten years, the company established a strong market recognition, the challenge is the scaling via constant sales revenue growth in industry versa acquisition. Presently the growth of the organization was luck, but not based on sales strategy with sales-focused leadership and applying internally and externally tools that drive agile performances. Excellent experiments/trials and the selection of first movers created a solid standing in the market. What worked in the past might require a transformation in a structured and process-orientated sales organization? This is not truly in line with the DNA of the CEO.
Presently the team is very diverse in background, however, there are only true experienced salespeople in the USA, and highly academic, technically driven people are in Europe serving the rest of the world. Now, the author is employed as the VP of Business Development and Sales Management. It is her concern and challenge to align all the parameters to make the growth happen with a constantly transforming sales organization in a dynamic and agile market. Though the author has implemented Sales Management concepts in Cooperates, this might not work with Typhoon HIL and their high-fidelity products in a high digital demanding market. Hence, academic research is applied to identify recommendations on how to move forward.
Problem Statement
The question pending in the Typhoon HIL board room is how the company can scale from a 10 to a 100 million Euro turnover. Till now, an annual growth of 1.41 per year could be reported. A visionary CEO who likes to run an agile organization has a goal on the whiteboard: 100 million euros by the end of 2029. Based on the selection of either a proven or innovative model, the marketing strategy need to be configured so that the above problem receives the research-proven recommendation, or alternatively, a new concept needs to be launched into the organization.
On the basis of these studies, the author concludes that focusing solely on organic growth alone cannot strengthen the fact of expanding for a young company on the market in the long term. External opportunities must be promoted on the market. The proof of concept of HIL solutions for improving performance has been reached. The challenge is the differentiation for growth. The HIL concept is a B2B sales and not a B2C business. Or till now, the market for B2C has not been identified with a reasonable framework. There are no clear, tangible success factors for a company in the hardware and software for simulation and verification software. Therefore, the focus of this work is on the success factors for strengthening the organization’s capacity by reviewing the concept of collaboration as a sales strategy.
Innovation alone cannot strengthen the innovative capacity of established companies in the long term; resources as well must be promoted in a targeted manner. Though start-ups often got well supported by investors and even returned their depth, the long-term growth either did not happen or the company got taken over by a major organization. The focus of this work is on which sales strategy will allow a product and service provider to achieve company growth. There is a need for action in this area, especially in young companies; the lack of a framework in place to achieve growth is a challenge. Remember, proof of concept is a process. Market standing and Market share are major challenges for young companies.
Davis proposed TAM based on Fishbein and Ajzen’s Theory of Reasoned Action, short TRA. TAM has been applied in various areas for the purpose of evaluating innovation adoption. This model is a good starting point for quantitatively and qualitatively examining consumers’ attitudes toward new technologies and their readiness for change. The two main variables in this model that determine an individual’s intention to use or adapt technology are perceived ease of use and perceived usefulness. According to TAM, if the use of technology improves either performance or efficiency while posing low difficulty in use, its acceptance rate will grow. Although TAM has been found to be a robust model in previous research, due to the time when it was born, there might be some additional aspects to be considered in the 21st century and especially in a time of extreme desire for digital concepts and transforming ways to market.
As TAM has a connection to TRA in the original setup, a short is made to this theory. Theory of Reasoned Action (TRA) describes a general theory of behavior that was first launched in 1967 by Martin Fishbein. Developed mainly in response to the repeated failure of traditional attitude measures to predict specific behaviors, the theory began with the premise that the simplest and most efficient way to predict a given behavior was to ask a person whether he or she was or was not going to perform that behavior. Thus, according to the theory, performance or non-performance of a given behavior is primarily determined by the strength of a person’s intention to perform (or to not perform) that behavior, where the intention is defined as the subjective likelihood that one will perform (or try to perform) the behavior in question.
Objectives
The study aims at demonstrating the type of sales models and frameworks shall provide the right setting for a small company in the sector of digital power electronics to allow it to scale from a small to a top 500 share market listed company. This can be achieved generic, through constantly partnering, or via merger and acquisition. At this moment, the focus is on elaborating a generic concept based on market demands. The key objectives of this study are;
- Research the effects and consequences to implement either Co-Creation of Value or Collaboration in business and the effects of these business models on market penetration and growth for a niche technical product.
- Evaluate the Advantages and Disadvantages of a hierarchical Sales Organization Structure for Typhoon HIL
- Assess the strength and weaknesses of 5 different sales approaches (Transactional Sales, Key Account, Partnerships on Executive Level, B2B, B2C) in relation to the selected company (Typhoon HIL) are worked out/presented
- Assess perceptions of employees and customers
- Recommend a marketing strategy in order to support sustainable growth.
Research Framework and Methodology
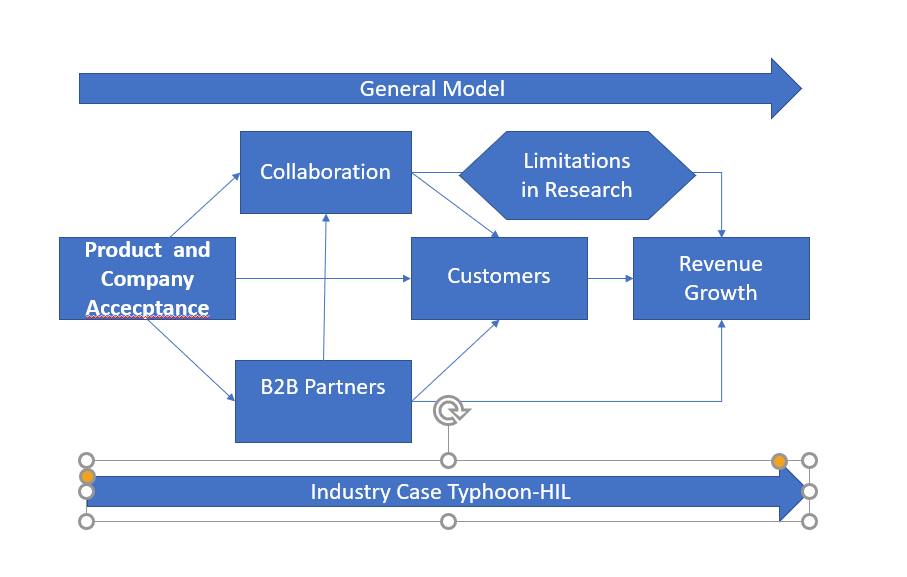
The research Framework mirrors the business based on the TAM Model, which takes into consideration of the external factors for the B2B business, as seen in figure 2 (Azoulay et al., 2019). The perceived usefulness can for the B2B customers be reflected in abortive capacity between supplier and customer, which then leads to the revenue generation, either one-stand or scaling. Achieving innovation on the customer level, which is based on the acceptance of technology and business process aspects within an outsourcing relationship, involves transferring knowledge of technical and business processes across organizational boundaries.
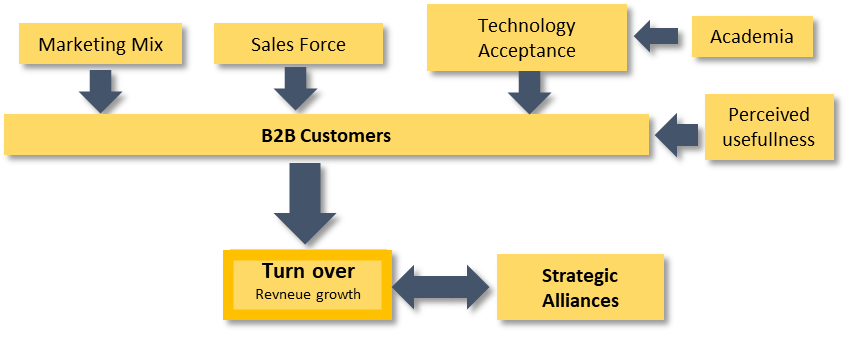
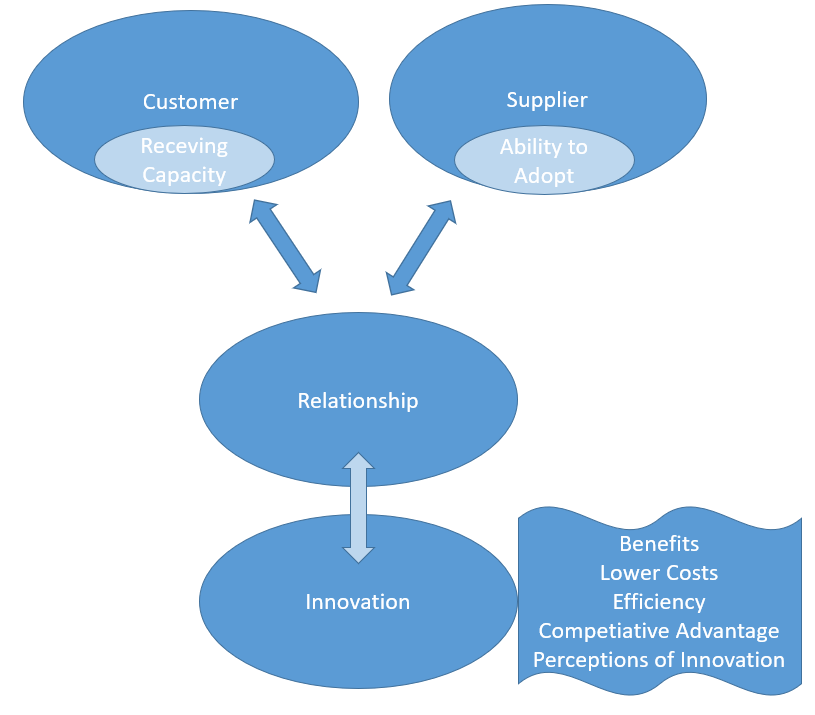
For a successful transfer of goods and services, there is need for a prior knowledge for the receiving customer to successfully assimilate the new approach to manage aspects of Validation and Verification of Technical Solutions followed by Test Automation. Cohen and Levinthal (1990) in their study identify absorptive capacity as basic study of knowledge. According to them, absorptive capacity means the ability of individual firm to recognize the value of new, external information, assimilate it, and apply it to commercial ends. Therefore, the business and companies use various absorptive capacity levels to sort and clarify the new information and data for effective use in an organizational setting and subsequently enable the successful transfer of that knowledge across boundaries.
Cohen and Levinthal (1990) also assert that the development of absorptive capacity is essential to the development of innovative capabilities. In their exposition on the exploratory assessment of the linkages 3 concept of organizational absorptive capacity, Cohen and Levinthal (1990) point out that the firms have different absorptive capacity which do not reflect on the overall capabilities of their employees alone. Assessing the firm’s absorptive capacity therefore requires a wide views of different communication channels and the corporate networks established to aid in decision making.
Each organization has a different absorptive capacity which majorly depend on the individual employee capabilities in the organization. To this extent, the development of an organization’s absorptive capacity will build on prior investment in the development of its constituent, individual absorptive capacities, and, like individuals’ absorptive capacities, organizational absorptive capacity will tend to develop cumulatively. A firm’s absorptive capacity is not, however, simply the sum of the absorptive capacities of its employees, and it is, therefore, useful to consider what aspects of absorptive capacity are distinctly organizational.
Absorptive capacity refers not only to the acquisition or simulation of information by an organization but also to the organization’s ability to exploit it. Therefore, an organization’s absorptive capacity does not simply depend on the organization’s direct interface with the external environment. It also depends on transfers of knowledge across and within subunits that may be quite removed from the original point of 131/ASQ, March 1990 entry. Thus, to understand the sources of a firm’s absorptive capacity, the company’s communication structure and the organizational environment is considered. The study focuses on the structure of communication between the external environment and the organization. In addition, the absorptive capacity considers the character and distribution of expertise within the organization.
There are four factors as important in understanding a technology adoption situation:
- Individual Differences,
- System Characteristics,
- Social Influence,
- Facilitating Conditions.
While the four factors are robust at the individual level, considering their individual effects on the organizational value is based on technological nature and the industry relationship which the factor influence. An analogy can be made to the application of Porter’s Five Forces to an industry analysis where for one industry, a particular factor may be of high importance, and in a second distinct industry may be insignificant. The objective of this research is to explore how these specific contextual factors can be identified for a given context/technology (McAran and Manwani 2016). In this case, Hardware in the Loop technology, which is not a new market but still rarely applied as a broad coverage to increase validation and verification as a basis for setting up reliable test automation.
The Technology Acceptance Model (TAM) and the various models derived from the application of this model supersede the technological user acceptance theory. This study has used a survey on the uses and the qualitative acceptance of this model from various businesses and companies. The survey was structured on questionaries which was emailed to various respondents for tehri individual opinions. The questionnaires were structured to qualitatively respond on the various individual views about the current model and how it impacts on the business marketing of various companies in Europe and the global market.
In TAM3, the theoretical framework of preceding factors of Perceived Usefulness and Perceived Ease of use is organized into four categories. The findings of this study therefore reinforced existence of various factors which affect the adoption of technology and its applicability in the business-related fields. It is therefore proposed that while analyzing the five forces of technological addition based on individual, social, system, facilitating conditions and context, assists in understand the technological acceptance. In summary, the paper offers a novel interpretation, characterizing five forces of technology adoption.
The descriptive part of the work forms the basic framework for the subsequent empirical research. The structure is based on the systematic processing of the sub-objectives. First, in the 2nd chapter, the success factors and framework conditions for product acceptance, buying behaviour, and collaboration for growth in young companies are researched based on the existing Literature Review. In Chapter 3, the quantitative analysis will be completed. In Chapter 4, The special features of other HIL Solution Providers in models to market will be summarized in an idealized model.
In chapter 5, the findings of the methodologies TAM and Theory of Porter’s Five Forces are assessed against the present industry case selected. Then the connection to the industry case of Typhoon HIL will be developed, as shown in figure 4 (Azoulay et al., 2019). Finally, in chapter 6, recommendations will be articulated. An abstraction of the theory and is intended to illustrate the complex interrelationships between product acceptance, buying behavior, and collaboration in the HIL Market. In the empirical part of the paper, the created model from the literature analysis will be tested for its relevance and effectiveness using a case study for its validity and the relevance of the variables.
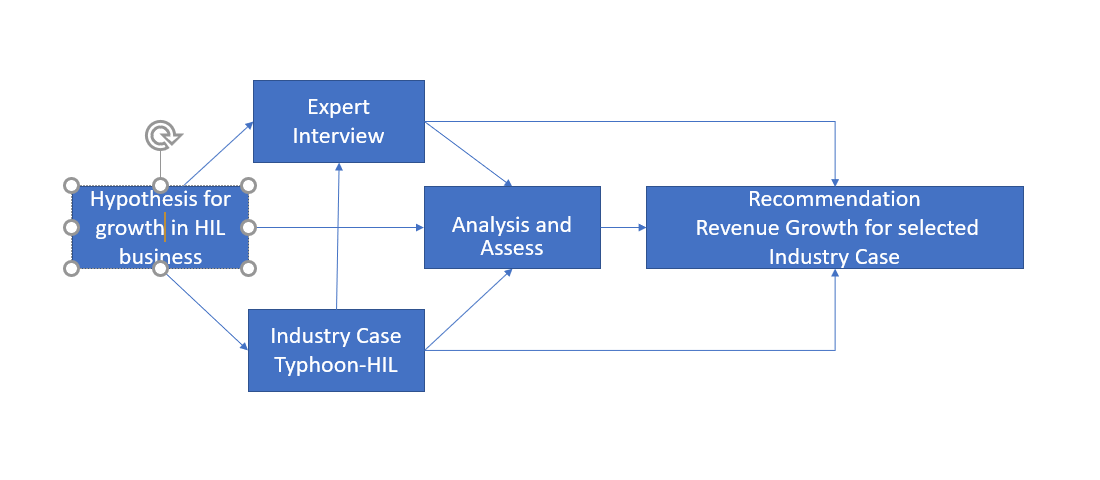
Since the use case is Typhoon HIL, the company and its special features are first described. The surveys conducted through the questionnaires therefore were evaluated by means through qualitative content analysis. In chapter 4, the model selected in the literature research is tested for its generalizability and determines whether actions can be applied, on the one hand, to the HIL Industry as such as there are more young companies trying to enter the market in general, on the one hand, and to other industries. In chapter 5, the model is enriched by the new findings, and the limitations of the research are addressed, as shown in figure 5 (Azoulay et al., 2019). With those findings, concrete recommendations for Typhoon HIL are derived in chapter 6.
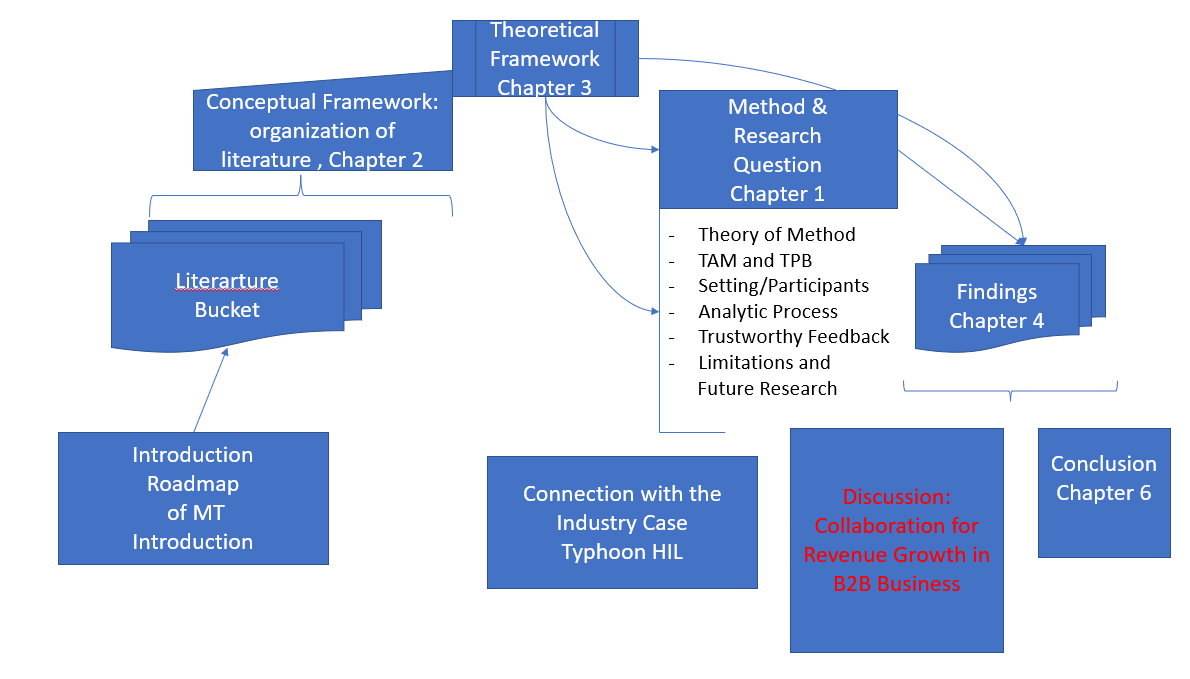
The work is rounded off with a critical review and a final conclusion. This master thesis addresses sales strategies for company growth in relation to young, recently established companies that differentiate by specific factors, especially in the area of collaboration and agility. These factors are to be worked out in relation to product healthiness and market acceptance, customer expectations towards business partners and summarized in an idealized model of growth by collaboration with minimum interfaces. The model is intended to provide an overview of the implementation of the topic within young companies that like to strengthen their market presence in the long term. From this, a concrete recommendation for action for the application case of this work, the HIL Solution Provider, Typhoon HIL, has been selected. In the next step, this recommendation will be examined for its generalizability for the Automobile Industry as Collaboration Market.
Therefore, this paper aims to examine the constructs and relationships of the modified technology acceptance model, as shown in figure 6 (Azoulay et al., 2019). This is aimed at determining whether it can be applied to assess Industrial Customers’ behavior and intends to adopt HIL systems in resource-limited R&D and to pretest customer solutions.
Models analyzed in the literature review
In the following parts will be a selected model analyzed. The models are:
- Technology Acceptance Model, TAM.
- Porters Five Forces.
A technology acceptance model questionnaire can improve digital adoption rates, the employee experience, software ROI, and more. When used correctly, these questionnaires assess both employees’ digital readiness and the appropriateness of potential software investments.
Limitations and Scope for further research
In spite of the fact that the two models applied in the creation of a marketing strategy for Typhoon HIL have insight into how they can continue to gain market share, it is important that the limitations be considered. This offers a chance for more or further research on the topic. For instance, the TAM model has been greatly criticized, which has led the initial proposers of the theory to try to redefine it multiple times. Some of the criticisms include its limited explanatory and predictive power, questionable heuristic value, triviality as well as a lack of practical value. Researchers suggest that it has diverted their attention away from other essential study matters and has established an illusion of progress in accumulating knowledge.
Moreover, the independent trials by various researchers to expand the model so that it adapts to the ever-changing information technology environment has resulted in a state of confusion. Generally, Technology Acceptable Model focuses on the computer’s user, with the idea of perceived usefulness and extension to bring in more factors to expound on how a person views usefulness. It does all this and ignores the social processes of information system development as well as implementation without questioning whether the technology is better or the effects of using IS. Others argue that the scheme of perceived ease of use and usefulness overlooks other issues, such as the structural and cost imperatives that prompt individuals into adopting a particular technology.
It is also believed that TAM only accounts for forty percent of the use of the technological system. Perceived ease of use has less probability of being a determinant of attitude and usage intention based on studies of telemedicine, mobile commerce as well as online banking. Apart from TAM, the other model used, Porter’s five forces, has its limitations as well. It is criticized for its limitation on composition. The critics argue that it only concentrates on the suppliers’ power, that of consumers, substitution, and new competition. However, other technological factors, as well as business approaches that influence a company, are neglected. For example, technological evolution is among the most significant threats to every organization, regardless of the sector.
Additionally, external forces such as taxation guidelines, government regulations, cross-border business risk, and environmental influence are not put into consideration. This can either be a major aspect of the growth or the downfall of a firm. The other criticism is the unavailability or lack of quantitative dimensions. There does not exist any built-in technique for conducting the quantitative examination of the external factors. This tool fails to offer a quantitative notion of the impact and depth of the five forces highlighted. Apart from that, there is no concept of which forces out of the five are most or least essential.
The third criticism is its impractical to use nature, especially in large organizations. It is difficult, practically, to utilize the analytical scheme for a firm that has a large product portfolio as well as operates in multiple market segments. The framework is designed to assess a company in one sector. Regarding analysis, critics claim that it can be utilized as the beginning point for the analysis. A model is a simple tool that explains five factors that can positively or negatively influence a company. This can only be used as a tool for the start point of a much deep study.
The framework mentioned above offers the initial insight into the organization’s competitive position in a sector. It cannot on its own provide an in-depth investigation of the firm. The other criticisms of Porter’s model include that it is not applicable to every industry universally, and it does not consider business risk factors. It is near impossible to practically utilize the five forces for particular sectors. For example, not-for-profit firms cannot use this technique for analysis. Those having activities such as R&D will not experience many advantages from this. External business risk factors, for instance, foreign exchange instability, financing methods, natural calamities, legal constraints, fluctuations in interest rates, and technological evolution, are not considered. These are the main factors in the determination of the business risk of a company.
Understanding the criticisms of the two models, the researcher identifies the aspects of the study that need more investigation. For instance, in developing the marketing strategy for Typhoon HIL, it is important to consider the views and opinions of experts in the field. The reason for this is due to the fact that the whole project is based on the two theories, and if there are valid points against some aspects, it is right to examine a new direction to take. The organization developed a product with the aim of improving reliability and quality of operations.
The product gained success fast enough in the industry as the initial consumers claimed generation of revenue with less effort. This project aims to establish how the product can continue to infiltrate the market and earn the company more shares. Every time a new item is introduced by a firm, customers are quick to purchase it and try to see its importance or how it can change their way of accomplishing tasks. This could be the same case with the simulation model. Putting in place strategies based on proven theories can help solidify one’s presence in the market. Relying simply on luck is an ill-informed way of approaching the situation, especially when a company wants to expand more. Understanding more about the foundation of the study, which is knowing how to deal with the limitations mentioned earlier, should be viewed as an important of the research project.
Quantitative Analysis of Survey
The project is the first element of an MBA program that the researcher decided to pursue due to a great passion for life-long learning. From the surveys conducted on various organizations and business, it is clear that the use of Technology acceptance model (TAM) assists mainly the OEM and the academia sectors. The results from the questionnaires sampled on various respondents indicate that most of the individuals and companies in the two areas depended heavily on the TAM for their regular businesses and transaction. The individuals or businesses from these sectors with significant levels of absorptive capacity are the most ideal for research such as this one since they have the knowledge base to sort, classify and analyze the trends in the market. On the one hand, the solutions from the new simulation model provided are beneficial in these two areas. On the other hand, even though it will offer some advantages to the general industry as well as the energy sector, it will be less needed since they do not heavily depend on the model for tehri regular use. The other areas however continue to benefit from this technique but don not concentrate mostly on their individual transactions.
Keywords
- Sample Size, Sample Profile.
- Method.
- Data Collection process.
- Time.
- Timing of the study.
- Financial Resources.
- Access to literature.
- Age of data.
Impact on the study
To be able to understand how the market reacts to new technological innovations, one has to use sample size that is adequate and can give a conclusive result with less error margin. In the event that it is too small, the power of the research reduces while the margin of error increases, therefore rendering the whole process meaningless. A researcher may be prompted to limit the size for logical reasons. To guarantee that the findings can be trusted, the sample size are usually modified based on the margin of error, confidence level and the anticipated deviations. Experts in the research field introduced a formula which was intended to help in determining the ideal size: Sample Size=

The above formula shows that the sample size is directly proportional to Z-score as well as inversely proportional to the margin of error. As a result, by decreasing the former, the researcher will be reducing the level of confidence on a study, which is associated with the Z-score. This as well raises the chance for more errors. When a researcher is constrained to a small sample size for any reason, they may have to accept results that are less conclusive. To fully comprehend how individuals react to a new technological innovation, one has to rely on data gathered from multiple people.
The simulation model developed by Typhoon-HIL is a new trend which has not yet been utilised by various market players. Collecting data, on its adoption, from a small segment of people or market would fail to provide a complete overview of why someone would want to use the model. However, conducting research on several companies in the automotive sector gives the researcher a chance to understand how people in the industry feel about the product. Additionally, a sample profile is important in any study related to the field of information system.
Individuals who adopt and adapt to the ever-changing information technology landscape are the youths since it is easier for them to accept particular products readily as compared to other age groups in a society. Majority of the information technology departments in large companies consist of three-quarters youth and one-quarter older individuals. The firm’s management argue that dealing with the youths and involving them in most business activities could assist the business to be more competitive in applying new approaches of governance and operations. This information helps the researcher understand the type of group or demographics to approach or target in the study to obtain the correct findings.
Apart from the sample size and profile, the method used in data collection has an impact on the results of the study. In this study, a TAM model questionnaire will be used. This approach can aid in improving digital adoption rate, software ROI, and employee experience. When applied properly, the questionnaire assesses both individuals’ readiness and appropriateness of possible software investment. It is assumed that every respondent already has had an e-payment experience which shows that there are factors that may be more essential than ease of use. Furthermore, multiple studies simplify the model by just focusing on the impact of perceived usefulness as well as ease of use.
Apart from the TAM model questionnaire, the researcher reviews other studies in the past conducted on the topic. This approach is important since it guides on the path this study should take. For instance, there are challenges that are faced during research. Understanding what issues emerged during the previous process will ensure that the investigator avoid certain directions that may mislead and result in inconsistent or unreliable results. Additionally, this can be thought of as documentary analysis technique. In this approach, a researcher goes through files that may contain information concerning the topic in discussion and generate conclusions based on that.
The process and handling of data collection process determines the kind of results one gets at the end of a study. For instance, information gathered in a careless manner that does not consider guidelines for research may be deemed incorrect. When dealing with participants, ethics is an important issue to have in mind. Aspects such as consent and confidentiality can lead to success or failure of a study. In an attempt to understand how people, respond or react to the introduction of a new technological innovation or product, the participants have to be informed that they are part of a study. They need to know as well how the usefulness and purposes of the information they provide. If the two are neglected, it is impossible to trust the data. Additionally, the respondents will have a right to claim that the data be dismissed or the researcher pay for damages.
Apart from that, it is essential for a researcher to understand that the data quality will usually rely on the capability of the interviewer. Some individuals have the natural capacity to carry out an interview as well as gather information well. In addition, it is impossible to have whole staff being skilled at any given time of business operation. Some of the investigators may as well have their biases that could influence how they input answers. Collecting data is a very important part of a study. The technology acceptance model assists various companies to research on issues which depend on invention discussions and adoption of new process. When the model is administered, the information gathered will require to be entered manually. Data entry of paper questionnaires can greatly increase the project cost. A staff in charge of the procedure will need to be employed. Additionally, it can prolong the analysis or examination process.
To succeed as a researcher, it is essential that one remains focused on the work. Without focus, credibility and dependability of the results or findings is compromised. This can be achieved by managing time allocated for the whole process effectively. The result of this is making the research work more productive and reduces the factors that consume time such as procrastination and interruptions. It as well helps one experience better job satisfaction, minimized pressure and more production. To achieve effective time management, one is required to plan well.
The researcher is needed to plan their day based on the most productive times. In case they prefer conducting most of their activities early in the day, they need to schedule tasks that need more concentration early in the morning. Next thing to do is creating a to-do list according to the plan. Apart from planning, a researcher can as well learn how to manage interruptions. To accomplish that, they can assign a fixed time during the day to handle any interruption such an email, instant message, phone call and social media instead of allowing them to disrupt. One could waste to even half an hour of their time trying to regain focus after being disturbed. Other things that impact a study include timing, financial resources, access to the literature and how old is the data.
Impact on the Study
Net Promoter Score
Net Promoter Score is a greatly utilized market research metric that mimics the form of one survey question prompting participants to rate the possibility that they would suggest a product or service to others. This notion introduces another aspect to this study that has an impact on it. For instance, the main concepts that the research is based on include the TAM model and Porter’s five forces. The former investigates what makes people accept new products in the information technology sector. There are those that look at it with the perception of ease of use and others with a view of usefulness. The NPS is a different concept and tool as it enables a researcher to understand that a product can sell if well recommended to other people (Baehre et al., 2022). It works in a similar manner as word of mouth since someone who has interacted with a particular item or service shares a positive experience with friends, family, or colleagues.
The NPS is a tool that can be used in the marketing of new inventions by organizations. This concept assumes a portion of respondents to be promoters who offer ratings of nine to ten, passives who give ratings of seven or eight, and detractors that give ratings of below that. Often, the tool’s users perform a calculation that involves subtracting the percentage of detractors from the promoters’ percentage gathered by the survey team. The outcome of the calculation is expressed as an integer instead of a percentage.
The core of how likely someone would be able to recommend is at times accompanied by other open-ended questions. The Net Promoter Score is interpreted as well as used as an indication of consumer loyalty. An ENPS or employee net promoter score helps to measure how loyal individuals at work are, the same as NPS (Baehre et al., 2022). In some instances, it has been claimed to correlate with revenue growth relative to rivals. It has been widely adopted by large companies and other firms. The Net Promoter strategy’s proponents argue that the score can be utilized to motivate a company to become more focused on bettering a product or service. As of 2020, there have been multiple versions of the concept that are now applied by more than two-thirds of large businesses.
The origin of net promoter score as a proprietary instrument date to the early 2000s, at which point Satmetrix and Reichheld built on their earlier as well as ongoing market research efforts. The efforts are directed at distilling and promoting one survey item that was easy to administer to great numbers of participants and for stakeholders to utilize and interpret. A detractor could be considered a 0 to 4 score and not necessarily a score of six and below. The main goal of this concept is to infer consumer loyalty to a brand, company, service, or product according to the responses of respondents to one survey item.
For some sectors, specifically annuity-based business-to-business computer programs as well as services, it has been revealed that detractors appear to remain with a business, whereas passives have a better chance of leaving. The use of this concept and revenue and consumer retention rates may provide valuable customer knowledge and may give improved predictability of client loyalty rates. As it depicts responses to one survey item, the reliability and validity of corporations’ NPS scores eventually rely on gathering a large number of ratings from human users (Laitinen, 2018). Nevertheless, market research questionnaires are distributed by email, and the rate of response has been dropping in recent times.
Proponents, in the face of criticism of the net promoter strategy, argue that the recommended question is of the same projecting power as other metrics. However, it depicts numerous practical advantages to other, more complex metrics (Baehre et al., 2022). They argue that assessments based on third-party information are inferior as compared to those carried out by organizations on their consumer sets and that benefits offset potential statistical inferiority to other metrics. It is important to note that the net promoter scores usually range from -100 to +100.
Whereas a net promoter score has obtained popularity among business executives and is considered a widely utilized tool for determining consumer loyalty, it has developed scandals in academic and market research landscapes. Scholarly criticism has questioned whether it is at all a dependable predictor of the growth of a company. Others have noted that there is a lack of empirical proof that the probability of recommending a question is a better indicator of business growth than other consumer loyalty queries. They as well note that the possibility of recommendations fails to measure anything different from other traditional loyalty-associated questions (Baehre et al., 2022).
Multiple types of research have revealed that there is a less statistical difference in validity, reliability, or discriminating power between NPS as well as other metrics. By only basing the research on the TAM model and Porter’s five forces, the findings of this study will not be as conclusive and may fail to provide reliable insights. The end goal is to develop a marketing strategy that will allow the simulation model by Typhoon HIL to continue selling as the company attempts to expand and gain more market share.
Literature Review
The study reviewed and applied the following theories:
- Technology Acceptance Model (TAM)
- Theory of Porter’s Five Forces
Technology Acceptance Model, TAM
Since it is assumed that all participants have prior experience with electronic payments, other criteria may be more significant than ease of use when it comes to continuation intentions. Furthermore, a lot of research simplifies TAM by removing attitude and focusing only on how perceived utility and usability affect intention to use (Venkatesh et al., 2003). As previously stated, this study adds four more criteria to the Technology Acceptance Model, two of which were taken from the Information System Success Model (ISSM). This model makes it necessary to give a brief overview of ISSM.
Delone and Mclean’s IS success model has received much attention were maturation, system, the information, attention and have service shifted quality, to the among IS researchers, as it provides a foundation post-acceptance to use, or use, continue user satisfaction, usage behaviors and attention for research in the information system benefits (Lin & Ong, 2010). This study, therefore; looks at Delone these searches adapted in the model, past two have important mainly been factors (divided user and Mclean’s model to explain the borrowed satisfaction into two streams and consisted benefits) of were studies borrowed based on two factors.
These models are used to extend TAM and validate its results for process-type e-payment prediction models and for static-type up with a model. These are the ideas that have not been clearly defined or developed from technology employing such acceptance systems, such as theory with a planned particular behavior system measure for the success of IS. But according to Delone and Mclean (1992), the system is used by the user. They carried out a thorough analysis of IS literature and IT usage with an eye toward the future. The expectation-dimensions of IS success serve as the foundation for process-type research. According to Bhattacherjee (2001), the system quality, ISC model, which considers the output of information quality, consumption into account, feedback (use) of the output, and the user’s response (user correction mechanism), can be used to represent the confirmation theory (ECT) or success. The impact of the IS on user behavior (individual impact), the impact of the IS on organizational performance, and the variation from static satisfaction.
Recently, there has been a highly prolific stream of theoretical research on the acceptance and use of information technology (IT). In this work, it has been argued that users develop perceptions about the usefulness and ease of use of various technologies and that these, in turn, influence actual system use. The model, TAM, is widely regarded as a relatively robust theoretical model for explaining IT use. (Straub, Keil, and Brenner 1997). Technology Acceptance Model (TAM) was adopted to identify factors affecting the students intention to use the e-wallet. Davis (1989) defined TAM as a well-established model based on the psychological interaction of a user with technology, and it addresses how users accept and use information technology.
Acceptance research (Davis, 1989) suggests that Perceived Ease of Use and Perceived Usefulness are the two key determinants that influence the acceptance and intention to use information technology. First, “people tend to use or not use an application to the extent they believe it will help them perform their job better” (Davis, 1989). This statement refers to “perceived usefulness.” Second, people perceive that if the technology is too hard to use, they tend not to adopt and not use it even though they believe that the technology is useful. This notion refers to this second variable as “perceived ease of use.” In line with the previous TAM studies (Kucukusta et al., 2015), the results confirmed that Perceived Ease of Use and Perceived Usefulness are the primary factors in assessing behavioral intentions toward technology adoption. TAM is used in this study for its predictive ability in studies involving students (Kiraz & Ozdemir, 2006). The researcher has also added a new and valid construct, i.e., perceived credibility, into the model to understand the technology’s acceptance.
In this research, the model consists of five constructs which are individual-technology fit, task-technology fit, perceived ease of use, perceived usefulness, and perceived credibility. TAM is used by the researcher as a guideline to complete the research. Numerous researchers have used various constructs to relate the dependent variables in TAM. This study examines the correlation between Perceived Usefulness and Malaysian Youths’ intention to use an e-wallet. Hence, the following hypothesis is proposed in this research.
The prolific stream of research on information systems use takes a variety of theoretical perspectives. Of all the theories, the Technology Acceptance Model (TAM) is considered the most influential and commonly employed theory for describing an individual’s acceptance of information systems. TAM, adapted from the Theory of Reasoned Action (Ajzen and Fishbein, 1980) and originally proposed by Davis (1986), assumes that an individual’s information systems acceptance is determined by two major variables:
- Perceived Usefulness (PU)
- Perceived Ease of Use (PEOU).
The Technology Acceptance Model: Past, Present, and Future by Y. Lee, K.A. Kozar, and K.R.T. Larsen TAM articles, by Davis (1986) received 424 journal citations in the Social Science Citation Index (SSCI) by the beginning of 2000. Extending the citation search further, we found 698 journal citations by 2003. TAM has been applied to different technologies (e.g., word processors, e-mail, Hospital Information Systems) under different situations (e.g., time and culture) with different control factors (e.g., gender, organizational type, and size) and different subjects (e.g., undergraduate students, MBAs, and knowledge workers), leading its proponents to believe in its robustness.
Most researchers in the IS field consider TAM one of the information systems fields’ own theories and still put much effort into the study of research using the theory. Despite its great success, however, few previous systematic efforts trace its history or investigate and evaluate its findings, limitations, and future (Legris et al., 2003). Evaluation is crucial for the IS community in that it helps researchers of IS adoption understand TAM’s past research findings, identify possible research topics, and conduct future studies. In addition, it helps educate current IS doctoral students in examining how a well-known IS-owned theory evolved. The present study goes back to 1986, traces the TAM research trajectory, and extensively investigates TAM’s findings. The research purpose of the study is to answer the following five sub-questions:
- How much progress did TAM make over the past eighteen years (1986-2003)?
- What are the findings and discoveries of TAM research?
- Who published what, and where did they publish it?
- What do lead IS researchers currently think about TAM research?
- What are future directions for TAM research?
In all, one hundred articles published in information systems journals from 1986-to 2003 and survey results from thirty-two leading IS researchers were analyzed. In the various analysis in the past, there has been a quest to answer those questions. Further, to supplement the findings of the meta-analysis, a survey of thirty-two leading IS researchers was conducted. Nine survey questions in an open-ended format were used. Example questions included:
- In what ways has TAM added value to the IS field?
- In what ways has TAM detracted from the IS field?
- What do you feel is TAM’s future?
We initially selected two groups of IS researchers: TAM researchers and non-TAM researchers. The selection was based on the publication productivity of researchers, especially in the MIS Quarterly and ISR during the 1990s. Twenty TAM researchers and twenty-four non-TAM researchers were selected. Participation was solicited through an invitation letter. A total of thirty-two researchers (16 of them TAM researchers and 16 Non-TAM researchers) completed the survey, with a response rate of 76% (Straub et al. 1997).
Findings of the Past TAM Researches
TAM studies have been performed by many different researchers with different research purposes, subjects, information systems, and tasks applying diverse research methodologies in different environments. Several new variables were incorporated into the original TAM, combined with other theoretical models, re-specifying their causal relationship with major TAM variables. These extensive research projects were published in the leading information systems journals, drawing interest from both researchers and practitioners alike. This section investigates the findings of these TAM studies, examining a number of variables, including;
- Types of Information Systems.
- Relationships between Major TAM Variables.
- External Variables.
- Major Limitations.
- Numbers of Publications by Year and by Journals.
- Most Published Authors.
- Characteristics of Research Subjects.
- Research Methodology.
Major Limitations of TAM studies Self-reported usage is the most commonly reported limitation. Instead of measuring actual usage, 36 studies relied mainly on self-reported use, assuming that self-reported usage successfully reflects actual usage. However, self-reported usage is known to be subject to the common method bias, which distorts and exaggerates the causal relationship between independent and dependent variables (Podsakof and Organ, 1986). The second most cited limitation of the studies is the tendency to examine only one information system with a homogeneous group of subjects on a single task at a single point in time, thus raising the generalization problem of any single study. The dominance of cross-sectional study is also an important limitation. Since the user’s perception and intention can change over time, it is important to measure these quantities at several points in time.
This study examined the progress of TAM and the findings of TAM research through the metanalysis of 101 articles published between 1986 and 2003. This study found that TAM has progressed continually during that time and was elaborated by researchers, resolving its limitations, incorporating other theoretical models or introducing new external variables, and being applied to different environments, systems, tasks, and subjects. In addition, through a meta-analysis and a survey of IS researchers, this study identified many of TAM’s rich findings. And carefully predicted the future trajectory of TAM studies. TAM has come a long way. While there are still contradictory views on TAM research, considering the previous and current research trends, many exciting directions remain for making future discoveries.
TAM2 was developed in the information technology field. It had been extended from TAM by Venkatesh and Davis (2000) in order to explain perceived usefulness and perceived ease of use from the social influence and cognitive instrumental processes’ viewpoints. Social influence processes refer to: subjective norm, voluntariness, and image, while cognitive instrumental processes refer to job relevance, output quality, result demonstrability, and perceived ease of use. Unlike TAM, Venkatesh and Davis (2000) inserted subjective norm as an additional construct by adopting from TRA and TPB models.
Subjective norm has direct relations with perceived usefulness and intention of use. Its relation with perceived usefulness is moderated by the user experience, while its relationship with the intention of use is moderated by the user experience and voluntariness of use. Extending TAM to TAM2 by including some constructs from older theories in addition to some moderators to perceived usefulness and perceived ease of use will enhance the performance of the model. As an example, the existence of an experienced moderator will show the increase in the level of users’ experience in technology over time, and this will cause a tangible change in technology acceptance to them.
In 1989, David used TAM to explain computer usage behavior, as one in figure XX. The goal of theory was later added, creating a shift from the theory of reasoned action to the theory of planned behavior. The goal of Davis (1989) TAM is to explain the general determinants of counter acceptance that lead to explaining user behavior across a broad range of end-user computing technologies and user populations. The basic TAM model included and tested two specific beliefs: Perceived Usefulness and Perceived Ease of Use refers to the degree to which the potential user expects the target system to be effortless. The belief of the person toward a system may be influenced by other factors referred to as external variables in TAM.
One of the key research streams in IS involves the explanation of the information technology addition and prediction of its usage. Even though various literatures have studied this area, the problem of determining various determinants of its usage emerges among various researchers. The technology acceptance model is specifically considered as the bests model for explaining the information technology related issues at both individual and company levels. However, the extension of TAM should be done to understand the various mechanisms on the influence of culture differences towards the predictability of the information technology.
Therefore, we integrate into our research model six cultural value dimensions well established in the literature pertaining to comparative and cross-cultural management and showing high variability among the countries which include; individualism/collectivism, power distance, masculinity/femininity and uncertainty avoidance (Hofstede, 1997). In addition, the various levels of comparison involve both monochronic/polychromic time and “high context/low context (Hall, 1989). In addressing these challenges therefore, cross-sectional surveys were adopted through developing questionnaires various companies and business to analyze the qualitative opinions of the respondents and the quantitative value of technology acceptance model on the business operations.
Unified Theory of Acceptance and Use of Technology – UTAUT
The UTAUT has four predictors of users’ behavioral intention and there is performance expectancy, effort, expectancy, social influence, and facilitating conditions. The five similar constructs, including perceived usefulness, extrinsic motivation, job/fit, relative advantage, and outcome expectations, form the performance expectancy in the UTAUT model, while effort expectancy captures the notions of perceived ease of use and complexity. As for the social context, validation test found that social influence was not significant and voluntary contexts.
In the following parts will be a selected models analyzed. The models are:
- Technology Acceptance Model, TAM
- What is the TAM model questionnaire?
Software ROI, employee satisfaction, digital adoption rates, and more can all be enhanced with a technology acceptance model questionnaire. When properly utilized, these surveys evaluate the suitability of prospective software investments as well as the employees’ level of digital readiness. On continuance intentions, it is assumed that all participants already have an e-payment experience, which implies other factors may be more important than ease of use (Gefen & Straub, 2000). Moreover, many studies simplify TAM by dropping attitude and studying just the effect of perceived usefulness and ease of use on intention to use.
As said earlier, this study extends the Technology Acceptance Model by adding four additional factors, two of which were borrowed from the Information System Success Model ISSM (Delone & Mclean, 2003). In light of this, it is necessary to provide brief information on ISSM. Delone and Mclean (2003)’s IS success model as exploration categories of IS of acceptance has received much attention were maturation, system, the information, attention and have service shifted quality, to the among IS researchers, as it provides a foundation post-acceptance to use, or use, continue user satisfaction, usage behaviors and attention for research in the information system benefits.
This study, therefore; looks at Delone these searches adapted in the model, past two have important mainly been factors divided (user and Mclean’s model to explain the borrowed satisfaction into two streams and consisted benefits) of were studies borrowed based on two factors used to extend TAM, and validates it’s come static-type up with models a model and for process-type predicting e-payment models. Use in empirical surveys about e-payment. Continuance Static-type researches intention. These concepts user satisfaction such as theory with of a planned particular behavior system measure for the success of IS has neither been derived from technology using such acceptance system quite clear nor exactly defined.
However, Delone and Mclean (1992) explain using the user the system. Intention and behavior based on made a major breakthrough. They conducted forward-looking or prospective expectations a comprehensive review of IS literature and IT usage. Process-type research (e.g., proposed a model of IS success, as suggested by Thong et al. (2006). This model identified six interrelated Kang et al., 2009) are based on expectation- dimensions of IS success. It suggested that the confirmation theory (ECT) (Oliver, 1980) or success can be represented by the system quality, ISC model (Bhattacherjee 2001) that takes the output of information quality, consumption into account temporal element and feedback- (use) of the output, the user’s response (user correction mechanism. Varying from static satisfaction), the effect of the IS on the behavior of the user (individual impact), and the effect of the IS on organizational performance (organization)
Recently, there has been a highly prolific stream of theoretical research on the acceptance and use of information technology (IT). In this work, it has been argued that users develop perceptions about the usefulness and ease of use of various technologies and that these, in turn, influence actual system use. The model, TAM, is widely regarded as a relatively robust theoretical model for explaining IT use. The adoption of this model aimed at identifying the key individual factors which affect the intention of students towards the usage of e-wallet. According to Davis (1989), TAM refers to an established model which is based on psychological interpretation of technological users and address its adaptability to the various businesses.
In addition, Davis, Bagozzi, & Warshaw (1989) suggest that the perceived ease of use are the key determinants of both technological acceptance and intention. People use the application to extent which they believe performs their jobs. In addition, individuals expect to achieve high performances based on the applicability of this model form their business operations (Davis, 1989). Hence, this statement indicates that there is need for perceived usefulness to the users of this model. Besides, individuals perceive that there is technicality in using the technology and tend not to adopt and use it even though they believe that the technology is useful. This individual reasoning therefore creates the second aspect of TAM based on the perceived ease of its usage. From the previous TAM studies, Kucukusta et al., (2015) confirm that both the ease of use and perceived usefulness of this model are factors in assessing behavioral intentions towards technology adoption. Therefore, TAM is used in this study due to its ability to predict results on the student performances.
The researcher has also added a new and valid construct, i.e., perceived credibility, into the model to understand the technology’s acceptance. In this research, the model consists of five constructs which are individual-technology fit, task-technology fit, perceived ease of use, perceived usefulness, and perceived credibility. TAM is used by the researcher as a guideline to complete the research. Numerous researchers have used various constructs to relate the dependent variables in TAM. This study examines the correlation between Perceived Usefulness and Malaysian Youths’ intention to use an e-wallet. Hence, the following hypothesis is proposed in this research.
The prolific stream of research on information systems use takes a variety of theoretical perspectives. Of all the theories, the Technology Acceptance Model (TAM) is considered the most influential and commonly employed theory for describing an individual’s acceptance of information systems. TAM, adapted from the Theory of Reasoned Action (Ajzen and Fishbein, 1980) and originally proposed by Davis (1986), assumes that an individual’s information systems acceptance is determined by two major variables:
- Perceived Usefulness (PU).
- Perceived Ease of Use (PEOU).
The Technology Acceptance Model: Past, Present, and Future by Y. Lee, K.A. Kozar, and K.R.T. Larsen TAM articles, by Davis (1989) received 424 journal citations in the Social Science Citation Index (SSCI) by the beginning of 2000. Extending the citation search further, there were 698 journal citations by 2003. TAM has been applied to different technologies (e.g., word processors, e-mail, WWW, GSS, Hospital Information Systems) under different situations (e.g., time and culture) with different control factors (e.g., gender, organizational type, and size) and different subjects (e.g., undergraduate students, MBAs, and knowledge workers), leading its proponents to believe in its robustness.
Currently, researchers in the IS field consider TAM one of the information systems fields’ own theories and still put much effort into the study of research using the theory. Despite its great success, however, few previous systematic efforts trace its history or investigate and evaluate its findings, limitations, and future. Evaluation is crucial for the IS community in that it helps researchers of IS adoption understand TAM’s past research findings, identify possible research topics, and conduct future studies. In addition, it helps educate current IS doctoral students in examining how a well-known IS-owned theory evolved. The present study goes back to 1986, traces the TAM research trajectory, and extensively investigates TAM’s findings.
The research purpose of the study is to answer the following five questions:
- How much progress did TAM make over the past eighteen years (1986-2003)?
- What are the findings and discoveries of TAM research?
- Who published what, and where did they publish it?
- What do lead IS researchers currently think about TAM research?
- What are future directions for TAM research?
In all, one hundred articles published in information systems journals from 1986-to 2003, and survey results from thirty-two leading are researchers were analyzed. In the various analysis in the past, there had been questions. To supplement the findings of the meta-analysis, a survey of thirty-two leading IS researchers were conducted. Nine survey questions in an open-ended format were used. Example questions included:
- In what ways does the TAM add value to the IS field?
- In what ways does TAM detracts from the IS field?
- What is the feeling on the TAM’s future?
Initially, two key groups of researchers were selected which included the TAM researchers and non-TAM researchers. This selection based on the productivity of the publication specifically in both MIS Quarterly and ISR during the 1990s. the survey selected twenty TAM researchers and twenty-four non-TAM researchers. The participation was based on the questionnaires which were sent through emails and collected on different days. A total of thirty-two researchers (16 of them TAM researchers and 16 Non-TAM researchers) completed the survey, with a response rate of 76%.a (Straub et al. 1997)
Literature Review
E-procurement services are online supply management solutions offered in a SaaS environment. With the ability to significantly enhance transaction-processing capabilities, e-procurement services are implemented to replace manual procurement activities. Online ordering processes of e-procurement technologies encompass, for example, the submission of requests for quotes, transmission of purchase orders to suppliers, and follow-ups on order status (Toktaş-Palut et al., 2014). Such hosted solutions have numerous advantages, especially when compared to stand-alone or owned software implemented on the company’s servers (Concha et al., 2010). As such, SaaS environments are easily scalable and offer seamless integration with internal enterprise resource planning systems; software and data incompatibility issues are thus also of no concern. In addition, with suppliers interacting with the software hosted on the provider’s servers, there is an additional layer of security shielding the company from any maleficence (Schoenherr, 2016). Due to the SaaS nature, services can also be accessed from anywhere, also from mobile devices, enhancing the accessibility and dynamic decision-making capabilities for both buyer and supplier.
Previous research emphasized the voluntary adoption of technologies, where consumers’ choice to continue using them determines their continuous use. While advanced and more complex usage of these services is optional, limited use is typically required (Kremers and Van Dissel, 2000). Lack of willingness to use the system in such a forced setting does not always result in interrupted usage; rather, it can cause discontent with the system and all of the other bad outcomes mentioned above. Given the possible negative effects in a forced setting, it is perhaps more crucial to look at users’ continuance intentions (satisfaction) in such environments than in voluntary ones.
Although previous research has examined user acceptance in delegated environments (Adamson and Shine, 2003; Brown et al., 2002) and continued user acceptance in voluntary environments (Sun and Bhattacherjee, 2011), few studies have examined ongoing user acceptance of e-procurement services in mandated environments. According to Gunasekaran and Ngai (2008), companies utilize e-procurement systems due to their numerous benefits, including enhanced data management (spend analysis, for instance) and integration with other internal systems, which enable faster cycle times, better tracking, better error elimination, and higher-quality purchasing decisions.
However, the retention of these organizational benefits depends on the continued use of these technologies by organizational buyers. The TAM is one of the more popular models used in the IS literature to forecast organizational users’ acceptance, persistence, and success of enterprise systems (Amoako-Gyampah and Salam, 2004). TAM has been successful in forecasting user-level acceptance and continuance, with its foundations in Ajzen and Fishbein’s (1980) Theory of Reasoned Action for anticipating technology adoption and usage. For example, TAM has been used in studies on the adoption of a number of enterprise technologies, such as mobile devices and applications (Schoenherr, 2016), e-procurement (Ramkumar and Jenamani, 2015b), e-customer relationship management (Wu and Wu, 2005), and enterprise resource planning (Amoako-Gyampah and Salam, 2004).
Additional information and communication technologies acceptance/continuance issues were covered within the context of e-banking (Adamson and Shine, 2003), e-government services (Carter and Bélanger, 2005), rural mobile telephony (Gupta and Jain, 2014), word processors (Jackson et al., 1997), the World Wide Web (Lederer et al., 2000), and the wireless internet (Lu et al., 2003). These studies have shown strong support for the soundness of TAM, inspiring us to apply this framework within our context.
Our model is theoretically grounded in the RBV (Barney, 1991), with both information flow quality and logistics fulfilment quality representing valuable resources emanating from an e-procurement system. These resources are able to effectuate perception and eventual continuance intention. The underlying tenet of the RBV is that resources – when they can be classified as valuable, rare, inimitable, and non-substitutable – can serve as the foundation for firm benefits (Wernerfelt, 1984, Barney, 1991, Day, 1994). Early research employing the RBV concentrated on the heterogeneity of resources (Wernerfelt, 1984, Barney, 1991), with later work focusing on their configuration (Eisenhardt and Martin, 2000).
Porters Five Forces Theory
Porters five forces model is an analysis tool which is used to understand the competitiveness of every firm. The model assists in identifying competitors using a broad view of the company’s performance and also used to understand how they can reduce its ability to generate profit. The complete analysis examines five forces: customer bargaining power, supplier bargaining power, the threat of substitute products, the threat of new entrants, and intra-industry competition. The first four elements operate independently from one another whilst intensifying the rivalry within the industry.
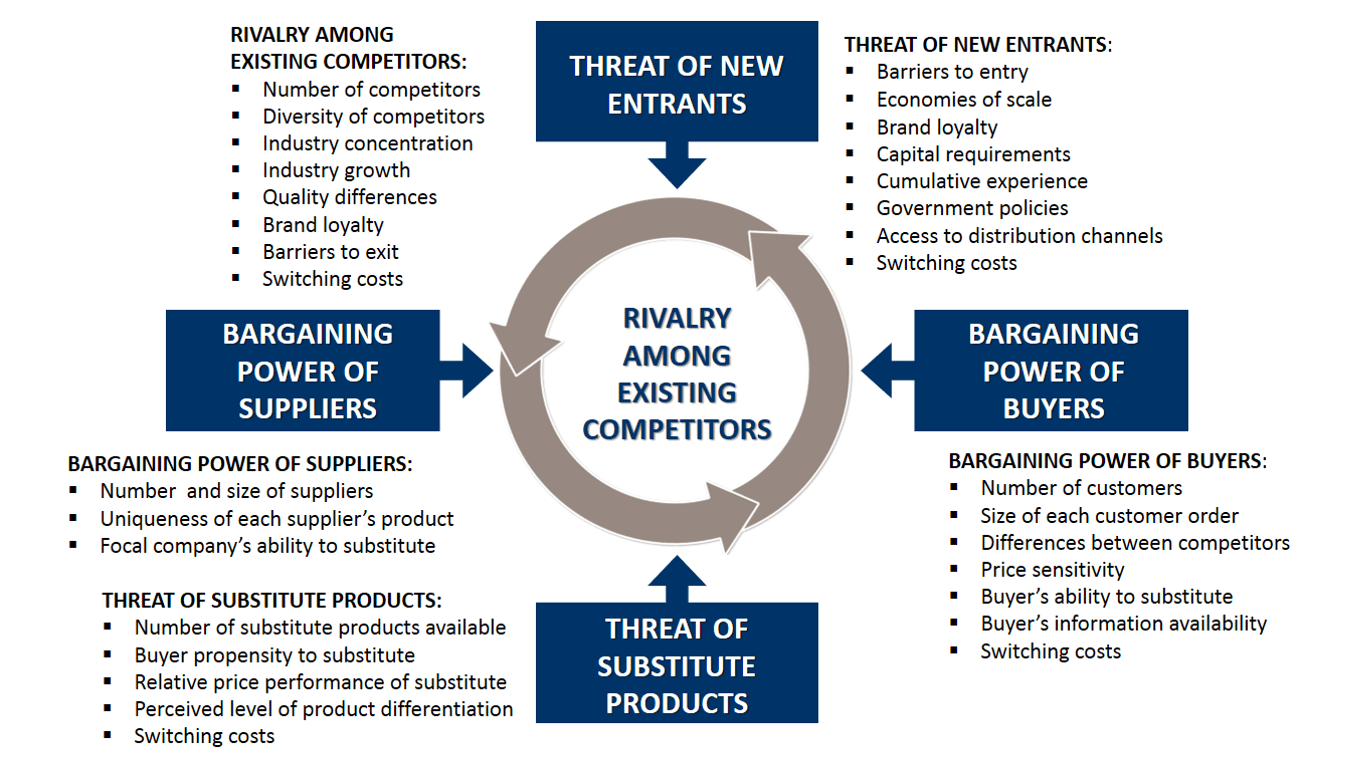
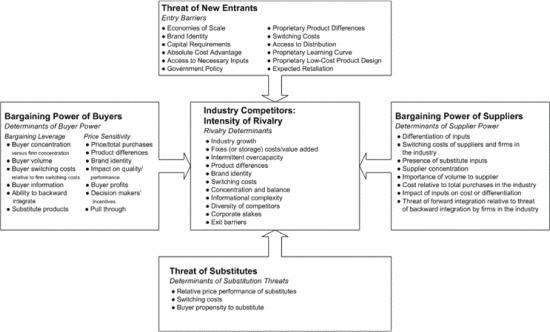
Developed by Michael E. Porter in 1979, this model allows you to analyze the competitive environment of an industry, as seen in figure 7 (Azoulay et al., 2019). Five forces – namely the bargaining power of customers and suppliers, the threat of substitute products, new entrants and finally, intra-industry rivalry – are articulated in this model to provide companies with the guidelines for consideration and the ability to understand the interactions within their industry. In addition to helping to visualize the competition and enjoying the profitability of an industry, this model supports the thinking of business leaders who wish to refine their strategies over the long term. As good as it seems, Porter’s model does however have its limitations, including a tendency to underestimate opportunities, the supremacy of the industry in relation to the company and overlooking factors affecting demand.
The model can be accompanied by a sixth force: the government. In fact, this can influence economic relations between actors within an industry, and thus indirectly affect its profitability. Porter also stresses the importance of supplements. These products and services are used in a complementary manner to the products offered by the industry studied. The supplements come into play when the benefit of the two products combined is greater than the value of each product separately. These can play a significant role, particularly in the area of new technology (e.g., specific software in the telecommunications industry), because they affect demand.
Bargaining power of costumers
The influence of customers in a competitive environment depends on their ability to negotiate. This can actually force companies to lower their prices, demand greater quality or additional services, or even take advantage of the competition between the different actors. In doing this, consumers directly influence the profitability of the market as they have an impact on the costs of the product.
Customers have even more power if the following conditions are met:
- There are only a few customers or they purchase large volumes
- Products available on the market are standardized and differ very little from competing products
- The cost of transferring products from one supplier to another should be low.
- The customers can integrate the activities of suppliers to their production chain.
Bargaining power of suppliers
Similarly, suppliers can have an impact on the profitability of a company by imposing their own conditions (in terms of cost or quality) in the same way as the customers.
The power of suppliers is significant if the following conditions are true for the suppliers:
- They are concentrated on a monopolistic environment.
- The suppliers have wide range of customers from various firms.
- The costs of transferring goods and services is high.
- The suppliers offer various n differentiated products with no substitutes.
The suppliers are able to incorporate various activities into one business form.
Suppliers have a direct power over an industry by (re)negotiating the terms of a contract between themselves and their clients (companies) and by constantly searching for the best prices.
Threat of substitute products
The presence of substitutes offers alternatives to the existing products in the industry. They respond to similar needs in a different or innovative way. For example, email is a substitute for regular post, just like the MP3 is a substitute for the Walkman. Present in every industry, substitute products become real threats when:
- The substitutes are of high quality
- The transfer cost of substitutes is low.
- There are low prices of the substitutes.
More generally, substitute products pose a threat by gaining market share and putting pressure on prices.
Threat of new entrants
New entrants shake up the market by reaching a previously unoccupied position, by delivering greater value to new consumers. Their desire to win new market share increases the pressure on prices and policies on cost and investment rates.
The entry threats are therefore strong when:
- There is no regulatory framework on the Technology.
- There are low barriers to entry in the market.
- There are weak economies of scale.
- There are limited cultural barriers.
- Replacement costs for the customer are low.
- Companies already established in this sector do not have very strong brand images.
- Customers are not necessarily loyal to the companies that supply to them.
- The likelihood of revenge from actors already established on the market is low.
- The government provides aid and subsidies for new entrants.
Intra-Industry Rivalry
At the heart of the model, the internal rivalry of the sector can be influenced and evaluated by the other forces of the model. Competitors are constantly fighting within the sector to increase or simply maintain their position in this field. Internal competition can take many forms and result in actions such as:
- Lower prices.
- Introduction of new products.
- Advertising campaigns.
- Improvement of product ranges and services.
The intensity of the competition depends on the number of companies active in the sector, their respective size and the scale of their market share. It can increase if:
- The sector is not concentrated.
- There is weak industrial growth rate.
- There are low barriers to entry and exit.
- Low degree of product differentiation.
- There are high fixed costs.
The configuration of the five forces differs for each industry. Depending on the intensity, the hierarchy and dynamics of these forces, it will be possible to identify the critical success factors (CSF), i.e., the strategic elements to gain control of, in order to ensure a sustainable competitive advantage.
Identify the components of the model
It is then necessary to identify each force through questions that are specific to each force. Answering these will allow you to identify trends, as well as the threats they represent. It is important to answer these questions in two stages in order to view the current situation and anticipate the future trend.
Customers or groups of customers
- To what extent is the industry of my customers concentrated?
- What is the volume of purchases made by these customer groups?
- Can they turn to substitute products?
- Do they make specific investments to facilitate transactions with certain partners?
- Do they really threaten to integrate production activities downstream?
- Can prices be negotiated between customers and suppliers for each order?
Suppliers
- Is the supplier industry more concentrated than the industry studied?
- What is the volume of purchases made by the industry studied?
- Do the companies in my sector make specific investments to support transactions with these suppliers?
- Do they threaten to integrate upstream of the chain?
- Are they forced to raise prices?
- Is it easy for them to find new customers?
- Are the brands of my suppliers strong?
Existing competitors
- What is the structure of the competition?
- What is the degree of product differentiation?
- What are the strategic objectives of competitors?
- What is the growth rate of the sector?
- What is the cost structure of the industry studied?
- How concentrated are the sellers?
- Are there significant cost differences between competitors?
- Can companies adjust their prices easily?
- Are there any barriers to exit?
- Is the price of demand adjustable?
- Are competitors in excess capacity?
Substitute products
- Are these products available? Is there a large number of them?
- What is the perceived price-quality ratio of these products?
- To what extent is the price of demand flexible?
- Are there any supplements?
- What is their price-quality ratio?
New entrants
- What capital do they require to enter the market?
- Are there considerable economies of scale?
- What is the level of their brand image?
- Do they have easy access to distribution networks?
- Do they have easy access to raw materials?
- Do they have easy access to the relevant technology?
- Are they supported by public authorities?
- What is their goal?
It is necessary to prioritize the different forces so that the resulting model is adapted to the industry studied.
Identify the drivers of each force and determine their degree of intensity
Each force must be questioned: is it influential enough to affect the industry by reducing or wearing down profits? The weight of these forces allows you to determine the ability of a company to make a profit. The greater the intensity of these 5 or 6 forces, the more the profit opportunities will be limited, as the market will be considered stagnant. Conversely, if the forces are weak, it is theoretically possible to generate significant margins. Note that you should not always consider industries – or sectors – of high growth to be attractive. Although it offers a lot of opportunities, there is a risk of strong competition in the near or distant future.
Determine and evaluate the industry structure
- What is the degree of profitability?
- Who controls and influences the forces?
- How long will this analysis be relevant?
Analyze recent and potential changes in the industry
An industry may undergo abrupt changes, thus this should be taken into account and the analysis criteria should be revised on a regular basis. By highlighting the crucial success aspects, the analysis can help the business create a significant and long-lasting competitive advantage.
Online supply management solutions provided in a software as a service (SaaS) setting are known as e-procurement services. E-procurement services are used to replace manual procurement processes since they can greatly improve transaction-processing capacities. E-procurement technologies’ online ordering procedures include, for instance, sending purchase orders to suppliers, submitting requests for quotes, and checking in on the status of orders (Toktaş-Palut et al., 2014). Such hosted solutions have numerous advantages, especially when compared to stand-alone or owned software implemented on the company’s servers (Guttman et al., 2005). As such, SaaS environments are easily scalable and offer a seamless integration with internal enterprise resource planning systems; software and data incompatibility issues are thus also of no concern. In addition, with suppliers interacting with the software hosted on the provider’s servers, there is an additional layer of security shielding the company from any maleficence (Schoenherr, 2016). Due to the SaaS nature, services can also be accessed from anywhere, also from mobile devices, enhancing the accessibility and dynamic decision-making capabilities for both buyer and supplier.
Prior literature stressed the voluntary acceptance of technologies, where continued usage depends upon the users’ willingness to do so. However, in most instances, a minimal use of these services is mandated, with advanced and more sophisticated use being voluntary (Kremers and Van Dissel, 2000). Within such a mandated environment, a lack of willingness to use the system does not necessarily lead to interrupted usage, but rather to dissatisfaction with the system and all the other negative consequences described above. Investigating users’ continuance intentions (satisfaction) within such mandated environments is thus probably more important than in a voluntary environment due to the potential negative consequences in a mandated environment. Even though, prior research has investigated user acceptance in delegated environments (Adamson and Shine, 2003), as well as continued user acceptance in voluntary environments (Sun and Bhattacherjee, 2011), little effort has been made to examine continued user acceptance of e-procurement services in mandated environments.
Organizations adopt e-procurement systems due to the multitude of benefits offered by them, including better data management (e.g., spend analysis) and integration with other in-house systems, which in turn enables faster cycle time, enhanced tracking capabilities, improved error elimination, and higher quality purchasing decisions (Gunasekaran and Ngai, 2008). These organizational benefits are however only retained if organizational buyers continue to use these systems. Among a variety of models in the IS literature utilized to predict organizational users’ acceptance, continuance and success of enterprise systems (Amoako-Gyampah and Salam, 2004), the TAM is one of the more widely applied ones (e.g., Davis et al., 1989).
Michael Porter outlined in his book “Competitive Advantage”, the three types of competitive strategies.
It can be summarized as:
- Cost Leadership.
- Differentiation.
- Focus on a particular segment, product or market.
Another competitive strategy is the focus on a particular segment, product or market. This is exactly the reason why Schneider Electric Strategy is so successful. Their strategy with the Eco-Structure is well partitioned: Each segment has its own Eco Structure Model, tailored to the needs. Scalability will make the difference. A recent sample is the collaboration between Orange and Schneider Electric in the field of indoor 5G in the industrial sector in France on experimental frequencies as part of a trial (Media Release attached).
In first quarter 2020, was the first co-innovation project in the Schneider Electric Le Vaudreuil factory established aiming to use 5G in a modern industrial environment to build reliable, scalable and sustainable connectivity solutions for future industrial needs. With this trial, the start to focus on a product nice in the IT sector is now opened for scaling on the global market. One sample which demonstrates the Schneider Electric Strategy to collaborate with external partners is paying off and allowing to penetrate the market prior to the competition.
The response in this paper is based on the following sources:
- The approach as demonstrated by one of the trainers in this field, Tim Wasserman, Chief Learning Officer for Twenty Eighty Strategy Execution and Program Director for Stamford Advance Project Management has been preferred:
- Formulate an effective strategic plan aligned with organizational objectives.
- Ensure decisions are made by the right people.
- Put in place a system of portfolio management.
- Invest in the right talent and resources to ensure projects succeed.
- Ensure the departments responsible for talent development have respect and support.
- Optimize a culture of execution.
- Put in place a flexible organizational structure across business units.
- Implement a system of review and accountability for results with performance rewards.
- Ensure employees understand their contribution to strategic outcomes and are motivated.
- Be more agile and flexible to change.
The attention should be drawn on item 4 as the investment in people is key. Driving change is not always possible with existing people. In such a case, new people need to be employed, independent of the present valid salary level in an organization. However, it can also be the case that there is talent in the organization, but some minor upskilling is required, in such a case, it is the leadership’s responsibility to invest in training and maybe even coaching (assign an external or internal person who is focusing on the development of this employee). Overall, even with the best plan in place, if the leadership team are not able to communicate it, then execution is ready to fail. Another learning about factors for successful competitive strategy success is outlined in the “Blue Ocean Strategy”, refer to figure below.
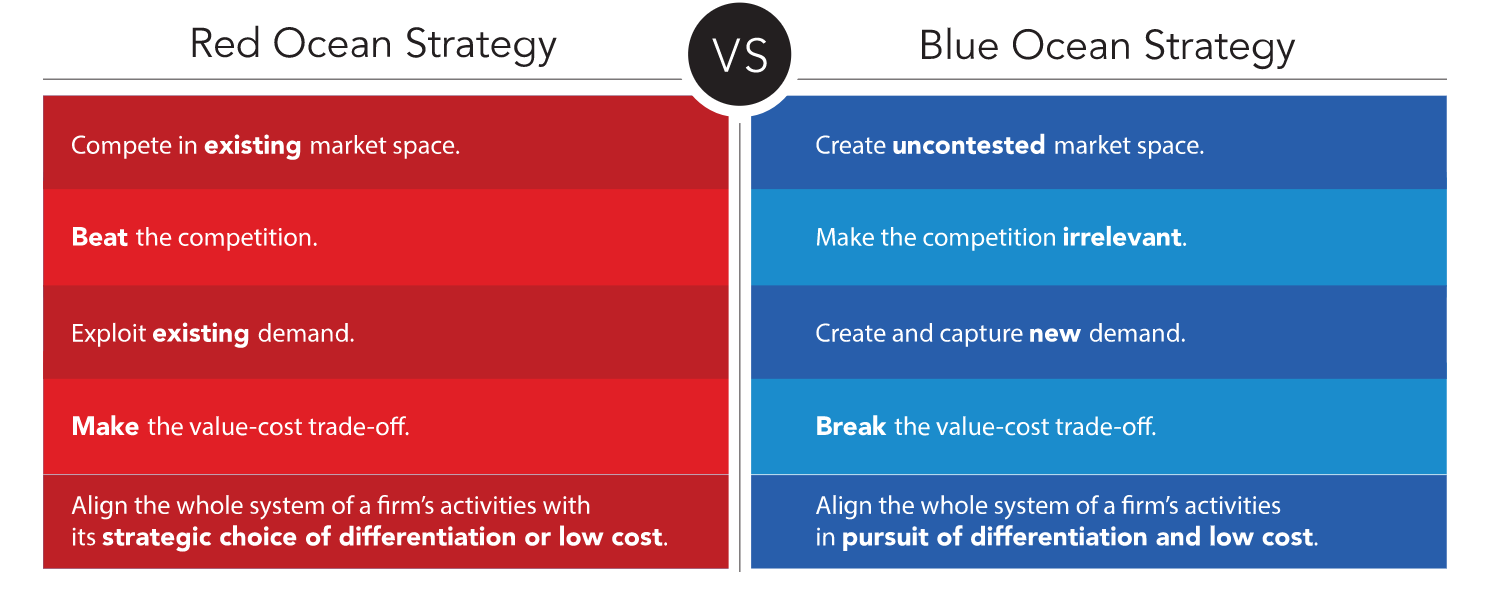
Success is achieved when it is delivered what is promised. Sometimes the delivery, but not the delivery model, will change due to external parameters. One sample is the present pandemic, Covid-19. Hence, Blue Ocean Strategy goes with me hand in hand with the delivery model, as it is outlined in the Blue Ocean Shift by Renée Mauborgne and W. Chan Kim, as seen in figure 8. It has been considering to see this book and Blue Ocean Strategy as the Bible, new and Old Testament, when being successful in a Start-Up or a restructuring of an organization.
What convinced me is the basics for success in this concept is that similar as in the Design Thinking Process, it is key that there is a clear capturing of the strategy first, no shortcut. It is mandatory that all stakeholders are supporting each other on the strategic landscape and the present position. The implementation does not start when all the elements are perfect, it starts similar to the Design Thinking with one version, staggered there is a reshaping happening and the business model growth to its firm version. The figure below describes this process. Go forward and not wait for the “yes, but “, prove the concept and measure with clear set KPI, Key Performance Indicators.
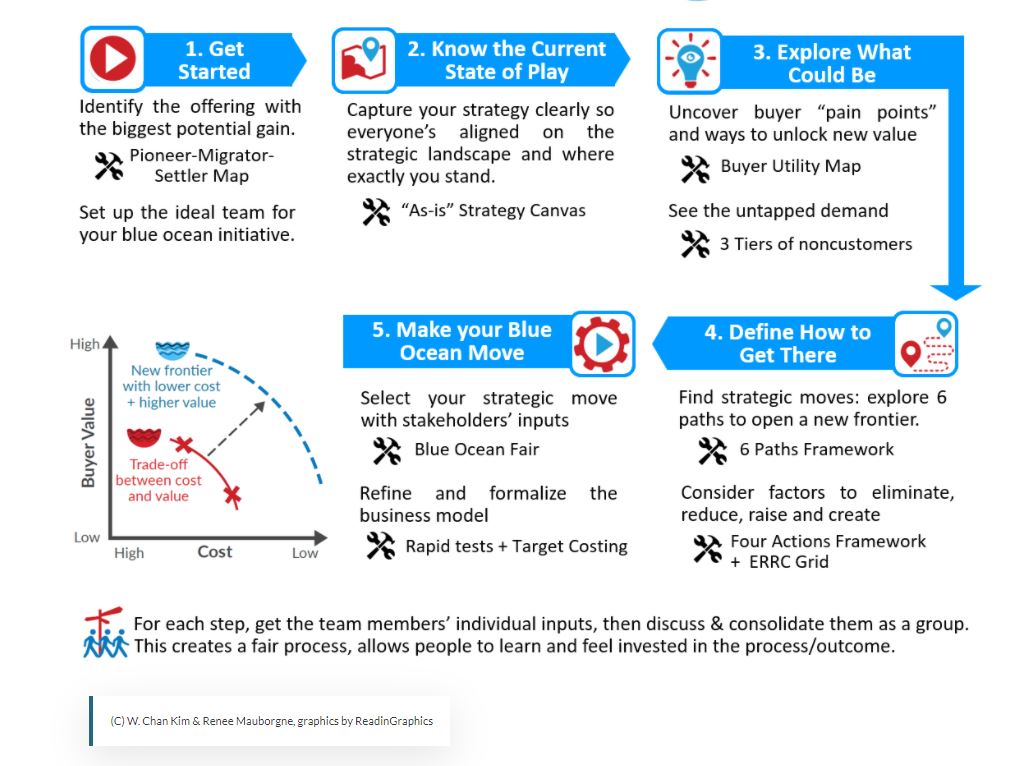
Model-introduction
Since all companies evolve in a competitive environment, differentiation has become paramount and sometimes vital. In addition to being constantly careful not to lose the market share already acquired for a strategic business unit (SBU), the company must continually reaffirm its differences to maintain and create its own competitive advantage. Developed in 1979 by Michael E. Porter the five forces model allows business executives to anticipate trends within an industry and changes in competition in order to influence it by making strategic choices that will enable them to obtain or maintain a competitive advantage.
Limitations and Questions along the Porter Model
A poor and incomplete model
Several scientific articles and publications have questioned the relevance of Porter’s five forces. Among the most frequent criticisms, we find:
- Underestimating opportunities.
- Overlooking the creation of value.
- Primacy of the industry.
- Overlooking the variation in demand.
- Qualitative analysis
- An outdated model
Analyze recent and potential changes in the industry
Changes within an industry can be sudden, so this should be considered and the criteria for analysis should be continually updated. The analysis can bring to light the critical success factors, which will allow the company to develop a sustainable and pivotal competitive.
Case Study: The E-Reader Industry
To illustrate the theory, we can consider the e-reader (or e-book reader) market. An e-reader is an electronic device with the sole purpose of serving as a support for reading a digital book (e-book). Conceptualized in the 1990s by two Italian scholars, this product did not receive the expected success when it was marketed in France in the late 1990s. It was not until the late 2000s that a greater variety of e-books became available, first in the United States, then in Europe. France, although slower than the Anglo-Saxon countries in adopting the new product, now has an ever-growing number of digital readers.
The book industry, which has changed dramatically in recent years because of the harsh economic situation, faces substantial challenges. Among these, the most significant is the remarkable development of online trade and the closure of many bookstores. The emergence of digital reading itself challenges the traditional business models. In 2012, the annual US sales figure for e-readers was 25 million, and it is estimated that in 2013, 32% of Americans will own an e-reader and more than half of them will own a tablet. The e-reader market there is now considered to be mature. What are the underlying forces in this particular industry? Which actors exert pressure? Which companies accelerate trends?
Bargaining power of customers. In this case, that of digital readers, the intensity of this force in considered to be average. Given the small number of sellers for a very large number of readers, the impact of customers transferring to a different type of reading device is only moderate. Indeed, the average purchase volume of a digital reader is not significant enough to destabilize an industry player in the case of change. Nevertheless, the transfer cost, which corresponds here to the effort that the reader must make to switch to a competitor, is relatively high given the ecosystems currently in place; the reader actually tends to prefer the bookstore associated with their e-reader. Thus, if the buyer parts with their first model (e.g., Kindle, associated with the Amazon bookstore), they will find it very difficult to transfer the books they already own to the new reading device if they opt for another brand.
Bargaining power of suppliers. The bargaining power of suppliers with active companies on the e-reader market is also relatively low, as it is very unlikely that they will integrate activities further down their supply chain. Furthermore, if the suppliers were to raise their prices significantly, the companies would have no trouble finding other equally qualified providers, since this industry is very concentrated.
Substitute products. Since many other products can replace e-readers, starting with paper books and tablets, it is difficult to win customer loyalty over the long term. More specifically, e-readers, which have not shown technological development for several years are at considerable risk of being overtaken by smartphones that not only have similar features, but also additional ones. More generally, reading is in competition with all leisure offers. The threat of substitute products is especially high as every year there is a decrease in the number of readers.
New entrants. This market, which is a niche market, cannot support too many entries of new players. Some precursor groups are already well established in this mature market and occupy large portions of the market worldwide, so that it is relatively difficult to compete against them. Indeed, for new entrants, the challenge is twofold since they must have a very large amount of financial capital from the outset for production, and they need to produce a very large volume of units in order to succeed in markets of scale. This scenario is only possible if the value created by these new entrants is massively perceived by customers who might see it as an essential advantage. The threat of new entrants is relatively low.
Intra-industry competition. The e-reader industry is highly competitive, where a small number of global players share the market. The Amazon Kindle, with a penetration rate of about 40%, undoubtedly dominates the market. Until recently, it was followed by PanDigital, the Nook by Barnes and Noble, and Sony, while others only held the remaining 20%. The rivalry was accentuated when, in February 2014, Sony announced the end of production of its e-readers in the US, overwhelmed by the especially high pressure specific to the e-reader market, which was particularly strong. Its customer base was then transferred to its former rival, Kobo.
Marketing personas
Getting to know your customer base means you can tap into their wants and needs. But, in 2022, your customers’ expectations of your business are constantly changing, making it easy to come across as old-fashioned, or out of touch. Don’t get left behind. We recommend creating or updating your company’s customer personas to inform your marketing strategy.
Examples of using marketing personas to inform your Porter’s 5 Forces analysis:
- Hone in on products/services that solve your target audiences’ problems
- Select distribution channels preferred by your target audiences
- Choose pricing and value modelling that is accessible for your target audience
- Keep an eye on the behavior of your top buyers to inform your strategy
Customer personas are an essential online branding and conversion tool that help businesses create more customer-centric, less product or company-centric web experiences. The business strategy will capture, but not be limited to:
- Planning.
- Strength and weakness.
- Efficiency.
- Control.
- Competitive Advantage.
Independent what style you use, the business strategy components will always relate to the following basic components, but not limited to them:
- Vision and business Objectives.
- Mission Statement.
- Core Values.
- SWOT Analysis.
- Tactic.
- Resource and Allocation Plan.
- KPI / Measurements.
A business strategy should be focused and not try to capture everything. There is as a nice idiom which reflects this well “You cannot see the forest anymore because of too many trees” – In other words, make sure that the big picture does not darken in the details of too many individual projects.
Here some samples of a business strategies:
- Cross-sell more products.
- Most innovative product or service.
- Grow sales from new products.
- Improve customer service.
- Cornering a young market.
- Product differentiation.
- Pricing strategies.
- Technological advantage.
- Improve customer retention.
- Sustainability.
Related Models and Extensions
Define the industry studied
To define an industry, we need to focus on two key elements: the products and the geographical area. Which products should be considered in this analysis? Which products should be disregarded, as they belong to another industry? In what geographical area are the competitors active?
The Plant Simulation Software Market
The HIL approach has been proved to be effective in reduction of the cost of production and time taken for the products to access the markets as compared to the traditional validation models which affect the production process negatively. Currently, there are various business and companies which offer competitive usage of the HML simulation to the customers and other business. Some of these companies include; Typhoon, OPAL-RT, dSPACE, Plexin’s RT Box, Speedgoat, and NI.
Majority of these solutions work effectively with the simulation models which have been designed using the MATLAB/Simulink software platform. Therefore, these models and systems are very effective in integrating the business services making the validation to be convenient, and user friendly. Various business a company such as the research reorganization, universities, firms and other development organizations have continued using the model in tehri business operations frequently due to the scalability and efficiency of the model.
Globally
There has been growing adoption of digital twin technology in several verticals such as automotive, manufacturing, energy & utilities and others, which is anticipated to generate ample growth opportunities for the market growth in the upcoming years. For example, in the coronavirus crisis period, increasing adoption of digital twin technology by scientists and healthcare professionals to produce innovative platforms that can enhance care delivery through effective patient monitoring is predicted to upsurge the market growth in the coming years.
The highest digital twin market CAGR under the industry segment, of 51.8%, is predicted to be seen by the automotive category in the near future. Automakers are rapidly embracing Industry 4.0 standards and advanced technologies, which is raising the importance of data collection and analysis in the manufacturing process. Thus, digital twins will be used to improve the vehicle design, manufacturing process, sales, and customer service. North America is the largest digital twin market presently because of its advanced IT infrastructure, improvements in technology, and adoption of Industry 4.0 practices. Moreover, the presence of numerous companies offering such solutions benefits the market in the region.
The major reasons behind the growing demand for this technology are:
- Rising Adoption of IoT: More than 41 billion connected devices are expected to be operational by 2025. To ensure optimum functioning of the internet of things (IoT), it is important to improve the throughput for every component of a machine, which is enabled by digital twins. This technology is being used to create a virtual model of a physical product based on the data being generated by the connected sensors.
- Increasing Focus on Intelligent Maintenance: Another key driver for the digital twin market is the growing focus of enterprises on intelligent asset maintenance. With digital twins, a product, process, or system can be simulated, which gives companies real-time insights into its workings. This enables them to ascertain maintenance requirements, which helps prevent unplanned system failure.
Market Dynamics
Market dynamics refer to forces that impact prices as well as the behaviour of consumers and producers. This concept is important as it allows the researcher to understand that apart from the TAM model, there are other factors that can be investigated and direct the creation of marketing strategy. In a market, they create pricing signals that are as a result of fluctuation of supply and demand for a particular product or service. They can influence any sector or government regulation or policy. It is important to note that there are other forces apart from demand, price and supply. Human feelings or emotions determine decisions as well, impact the market, and create price signals.
Market dynamics are factors that alter the supply as well as demand curves. They establish the foundation of various economic models and theories. Due to market dynamics influencing the above curves, policymakers aim to find the ideal way to utilize many financial tools to stimulate an economy or bring it down. This prompts questions such as, it is better to lower or raise taxes, slow down wage growth or increase wages, do both or neither? Additionally, how will the adjustments influence supply as well as demand and the overall direction of the economy?
There are two main approaches regarding altering supply or demand in an economy with the eventual goal of positively affecting the economy. One has a foundation on supply-side notion and the other has a demand-side idea. Supply-side economics is a policy made known by the fortieth President of the United States, Ronald Reagan. It is based on the notion that more great tax cuts for corporations, investors, and entrepreneurs offer incentives for an investor to supply more items to an economy. This leads to other additional benefits that trickle down to the rest of the economy.
The supply-side concept has various pillars including tax policy, monetary policy and regulatory policy. Nevertheless, the overall notion is that production or supply of a good or service is most essential in determining economic growth. The theory contrasts with Keynesian idea which puts into consideration that demand can drop and the government needs to intervene with financial and monetary stimuli. The opposite of this concept is demand-side economics which dictates that an effective economic growth’s creation comes from the high demand for products and services.
In case there is a high demand for a good or service, customer spending increases and businesses can expand as well as employ extra workers. Higher employment levels stimulate aggregate demand further and economic growth. Demand-side economists trust that tax cuts generally can stimulate aggregate demand as well as move an economy that has great unemployment back towards a complete employment scenario. Nevertheless, tax cuts particularly for companies and the wealthy may not stimulate the economy. In this case, the extra finances may fail to increase the demand for goods or services.
Rather it could be claimed that the incremental income produced may go back into stock buybacks that improve the stock’s market value or to executive advantages but fail to materially stimulate the economy. Economists supporting demand-side theory claim that a raise in government spending will aid in growing the economy by spurring extra employment opportunities. They utilize the Great Depression of the 1930s as proof that increased spending empowers growth at a higher rate than the tax cuts.
Economic models as well as notions try to account for the market dynamics in a manner that captures as many variables as possible. However, one has to realize that not every variable is easily quantifiable. Models for physical items or services with relatively easy dynamics are mostly efficient and participants in the markets are viewed to reach rational decisions. Nevertheless, in fiscal markets, the human element of emotion causes a chaotic as well as difficult-to-quantity influence that always leads to increased volatility.
In fiscal markets, some financial services professionals are knowledgeable concerning how markets function. These individuals make decisions that are ideal for clients according to all of the available data. Clever people base their choices on comprehensive analysis, proven methods and extensive experience. They as well function to completely comprehend their customer’ needs, objectives, ability to withstand investment risks and time horizons. Unfortunately, there are market participants that are not professionals and may not have adequate insight of the markets in addition to several events that can influence the market.
The above-mentioned segment includes small to intermediate traders who seek to earn wealth quickly, scammers, investors who try to manage their investments instead of seeking advice and those led by greed. Some in this group of experts are even self-proclaimed who sometimes are dishonest. Competent as well as professional traders determine entry and exit points of any trade or investment using proven quantitative techniques or models. They describe the proper plan of action and adhere to it. Through practicing strict finances management, the execution of trades occurs without deviating from the well thought out and present plan.
Emotion rarely affects or impacts the deciding process of the traders. Conversely, for a new trader or investor, it often plays a role in reaching a decision. After the trade’s execution, if it becomes profitable, greed may affect their next move. The traders will neglect signals and sometimes take profits turning a winning trade into a loss. Fear is the other feeling that can direct the decision paths of the investors. They may not be able to exit a trade at a present stop loss.
Above are cases of unreasonable emotional behaviour that is hard to capture using economic models, thus impossible to understand how the market dynamics will influence supply as well as demand. Customer demand can sometimes be a powerful dynamic on its own. As a study revealed, spending of consumers has risen specifically for luxury fashion products such as accessories, footwear, and apparel. Based on the research, sales of the above products have increased as new companies emerge and online retail channels have established a more competitive landscape while obtaining market share. This is mainly due to the buyer preferences and demographics. As the demand rises, brands and manufacturers will manage to increase their prices which will in turn stimulate the sector and improve the economy.
Europe
Hardware-in-the-loop (HIL) testing is a test methodology that can be used throughout the development of real-time embedded controllers to reduce development time and improve the effectiveness of testing. Depending on the complexity of the controller being tested and the level of fidelity required for the simulation of the overall system, hardware-in-the-loop (HIL) simulators can vary in size, computing power, complexity and cost.
A typical HIL system comprises either a rack-mount unit containing the real-time target computer with I/O boards and plug-in signal conditioning cards, or a standard PC with distributed I/O points connected via one or more communications buses. Typically, a HIL system will require a modelling environment, such as Simulink which will be used to create the plant model and may include a model of the controller strategies for components not available for the test system.
This environment is usually run on a workstation or a laptop and is known as the host PC. The overall plant simulation and (optional controllers’ strategy) model is then compiled into real-time executable code which is downloaded to a second computer, called the target simulator. This is usually specialized hardware, such as one of our real-time target simulators1, which contains special I/O boards and all required signal conditioning. The sales of HIL Solutions in various market segments, like Industrial OEM for Drives and Automobile Industry, with a trial-and-error approach is very expensive and has the risk of being unsuccessful at an unexpected moment which can lead to a major disaster for the organization.
Typhoon- HIL
The organizational split in revenue performance of Typhoon HIL is displayed below:
- Revenue Stream 2021 and trend;
- Revenue Stream 2021 by existing versa new customers;
- Revenue by geographical Split;
- Revenue by customer segments;
- Revenue by customer segments.
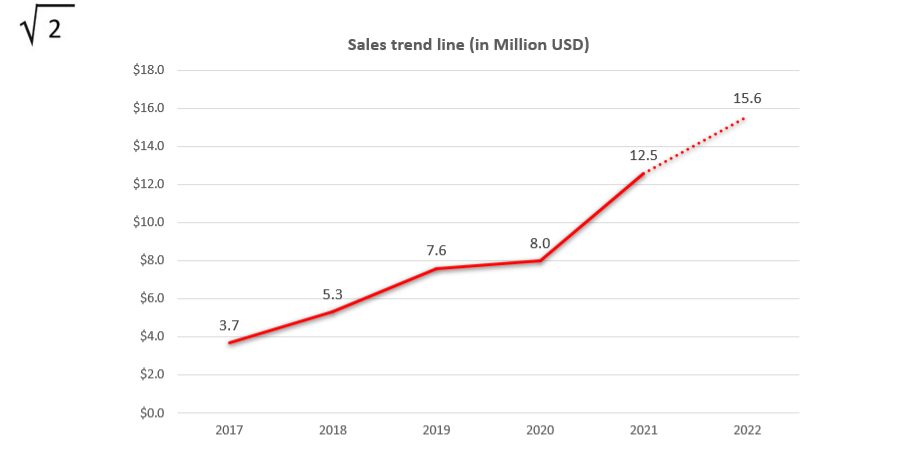
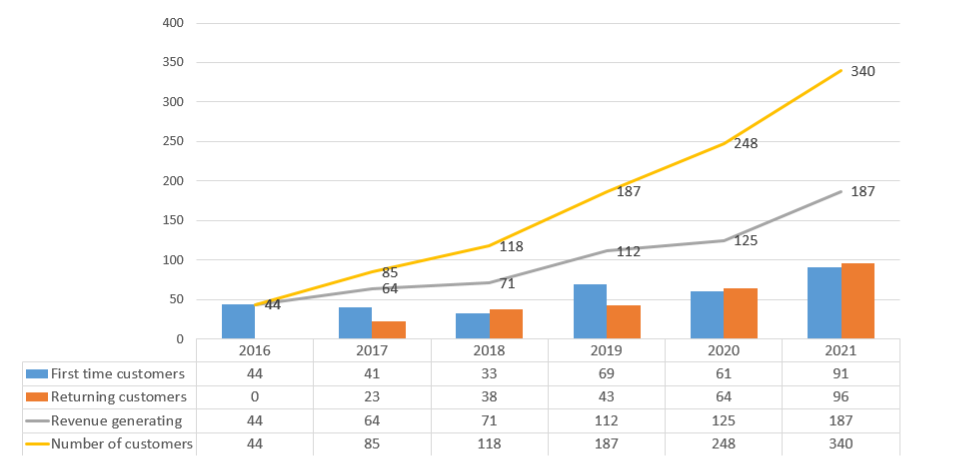
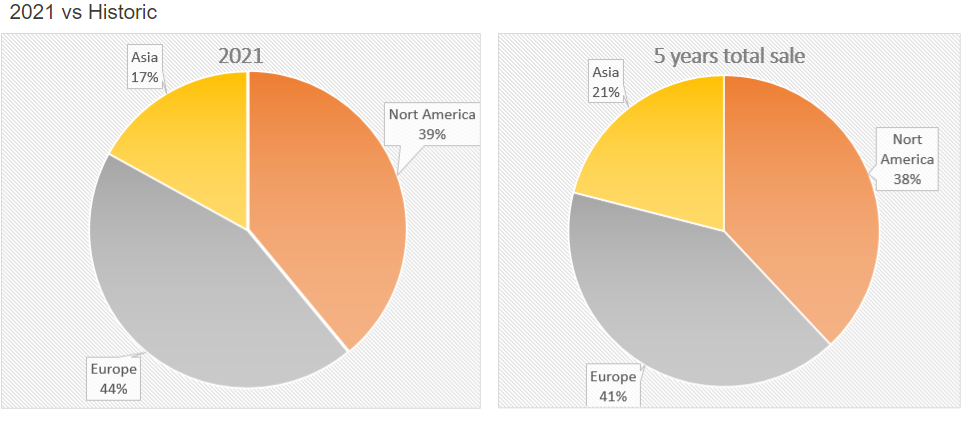
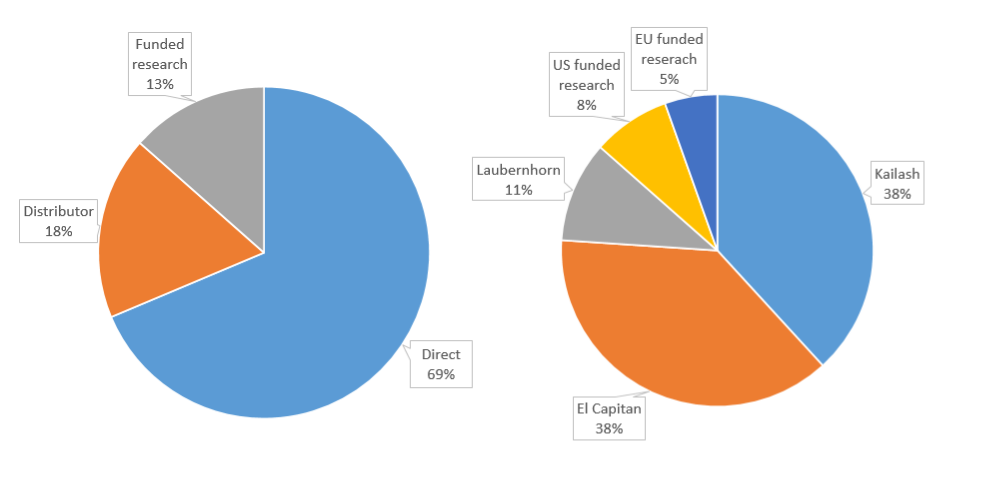
The author’s hypothesis is that the sales can be changed by restructuring the sales organization and process. This will lead to more profitably and strong constant market share. The developed hypothesis is that the sales can be changed by restructuring the sales organization and process. This will lead to more profitably and strong constant market share. This present master thesis will be structured based on the TAM Model as a Framework. The Literature Research shall demonstrate the usability and attractiveness of the model.
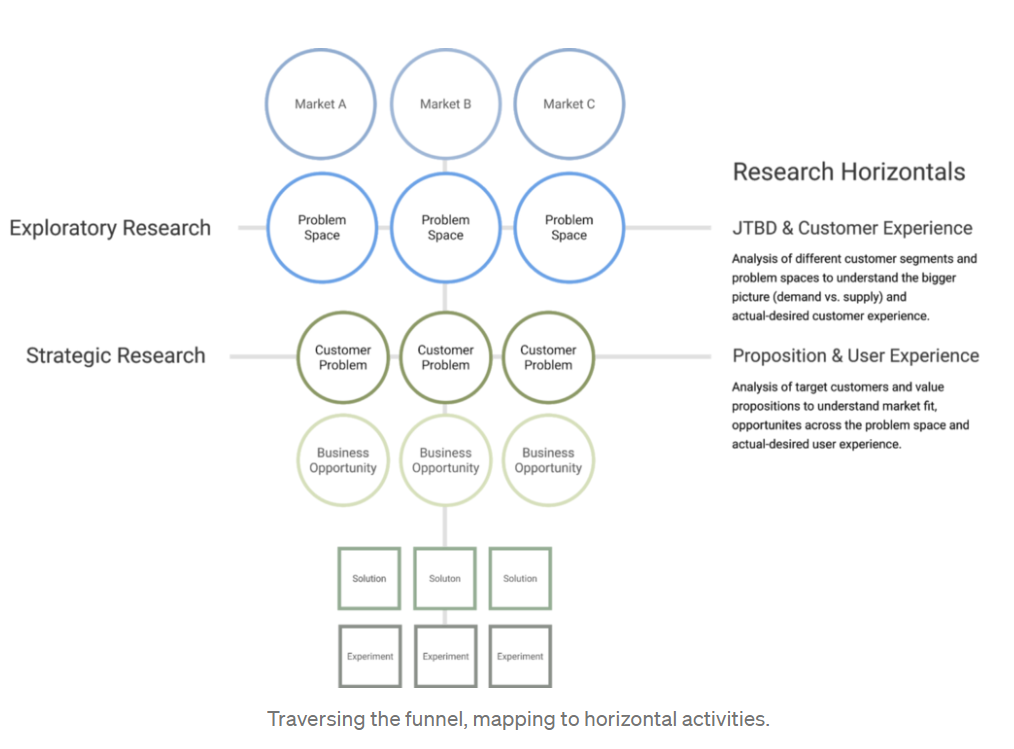
So, this Master Thesis aims to examine the constructs and relationships of the modified technology acceptance model, short TAM, to determine whether it can be applied to assess Industrial Customers behavior intends to adopt HIL systems in resource limited R&D and pretesting of customer solutions
Market Attractiveness
In order to stay ahead of the competition and gaining customer attractiveness, some key questions should be always asked
- The Secret Question. What is the unique opportunity that others don’t see?
- The Engineering Question. Is our technology/solution providing 10x improvement?
- The Timing Question. Is the market ready?
- The Monopoly Question. Do we have a chance to dominate small market first?
- The People Question. Do we have the right team?
- The Distribution Question. Do we have channels to deliver the product?
- The Durability Question. Will our market position be defensible 10 and 20 years into the future?
Field Research Findings: Needs Assessment
Samples of the customers, there are hundreds of them, but only a minor part is serviced by Typhoon HIL.
- SEW.
- KEB automation.
- Liebherr.
Liebherr Liduro Frequency Converters – Liebherr
Liebherr presents new power electronic modules at Electric & Hybrid Marine World Expo 2018 – Liebherr.
There is the following competition.
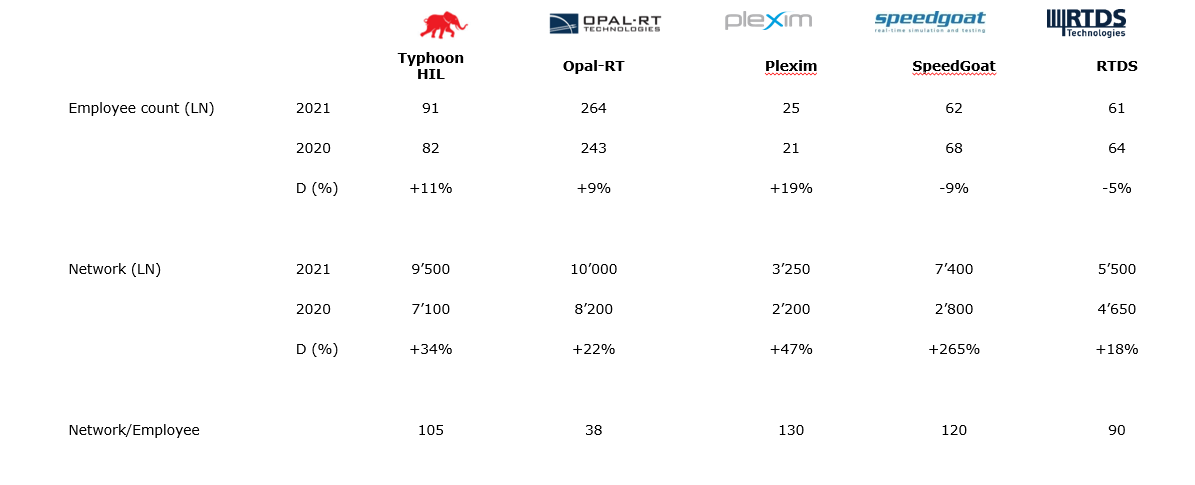
Automotive
Understanding the needs of one’s segment of customers can aid in putting in place steps to satisfy them which ultimately will help the marketing strategy of Typhoon HIL. Customer satisfaction is defined as a measurement that determines how happy customers are with a company’s products, services, and capabilities (Babu et al., 2022). Customer satisfaction information, including surveys and ratings, can help a company determine how to best improve or changes its products and services. An organization’s main focus must be to satisfy its customers. This applies to industrial firms, retail and wholesale businesses, government bodies, service companies, nonprofit organizations, and every subgroup within an organization. There are two important questions to ask when establishing customer satisfaction:
- Who are the customers?
- What does it take to satisfy them?
Electrical
In the electrical industry or business of offering services in that sector, customer satisfaction is as important as in other areas. Sustaining an audience in business is a difficult task for any company. It requires a consistency of thought, of action and purpose over an extended period. Some experts have identified consistency among the least inspirational subjects for majority of managers. However, it is exceptionally powerful particularly at a moment when retail channels are proliferating as well as consumer choice and empowerment are rising (Suppipat & Hu, 2022). Getting it right needs the attention of top leaders in an organization. Through utilizing a range of channels and triggering more interactions with firms as they seek to meet discrete needs, consumer create interactions’ clusters that make their personal interactions less essential than their cumulative experience.
Limitations
Despite the findings of this research, there are limitations that cannot be ignored. The cases have been limited to five samples. Future research should investigate how other populations view the willingness to adjust the usage to new services from young companies. Secondly a larger sample might provide greater generalizability for the hypothesized model tested. Potential cultural differences should be addressed via a larger sample of cases from different countries. For example, the American culture is a much more open to a trial-and-error approach for doing something new, compared to the German Style. It also needs to be get taken in consideration that a change in age in leadership / strategic decision positions might impact the behavior in a buyer relationship.
Future research should look at how individual-level variables such as age, gender, basic ability levels, among others, might affect the relationships proposed in this study. Fourth, while attribute and reliability quality were shown to be significant in our model, their relative impact on the high-order construct of product quality was not tested.
It would be interesting to test this framework across a variety of applications in the segment of HIL applications. Deeper understanding maybe gained through a longitudinal investigation. The authors wish that the results of this exploratory study will provide a framework for more detailed analysis in future. Investing into a new disruptive technology can be a challenge to many OEM as there are many unknowns or positive challenges they need to in consideration as part of their business decision making.
Recommendations
It is important that companies apply the Porter’s five forces in their marketing strategies as they aid in determining how much profit can be gained from an investment. In the case of Typhoon HIL, it is all based on the homework completed by the organization in order to allow the buyer to be attracted by the solution and being convinced that the brand is offering. Porters Phrase of Bargaining Power of Buyers shall be transformed at the time of 21th century to the wording “Agility of the buyers”. The pricing is not related to pieces of hardware sold, but the number of tests increased and consequently a reduction of uncertainty in the operational stage of the application. This leads to the fact that the pricing shall be evaluated as costs per test and quantity of tests in order to increase reliability and validity of the data.
In the case of customers, it is not about comparing with the competitor, it is about the question: Can the company increase their revenues and market coverage by engaging with Typhoon HIL. In other words, is the solution helping to increase shareholder value, though there might be switching costs. Switching costs are one off costs, which also apply when changing employees. However, instead of training new staff, the entire modelling process followed by validation and verification with the ultimate goal of implementation of testing automation can be outsourced. This would move Typhoon HIL truly from a Tier 2 supplier to a Tier 1 business partner. Being a business partner should not stop at the level of being a preferred supplier of choice, but getting a board position within this company.
In future, it would be great for an extreme change of mindset for both parties, buyers and suppliers. A supplier is a not an institution who measures the performance on its competitiveness with the competitors, but on the capability and creativity of its own organizations in correlation with the ability to co-create value with the buyer. As the Growth of its own organization is the main driver of the supplier, all the energy and actions need to be focused on where the highest impact on the idealized design of the organization is.
Additionally, focusing on Industry Growth and new Markets allows as first mover to apply Moore’s model and being the first mover in this arena. Especially now in the field of automotive sector, it is still very early stage of E-Mobility, only the media messages create the impression that the majority of the cars are on the road already electrical. Being on the growth path means that there is a meaningful need to enter markets when the customer has not even asked for the solution, but being change agent in the customer’s organization. Not focusing on the existing, but opening the technology path for generating new revenue streams.
- Research.
- Niche-driven Strategy.
- A High-Performance Website.
- Search Engine Optimization (SEO).
- Social Media.
- Advertising.
- Referral Marketing.
- Marketing Automation, CRM, and Lead Nurturing.
The rapid development of a technology allows competition in a business environment to be increasingly competitive. Therefore, entrepreneurs today inevitably must have a good strategy to face increasingly competitive competition and be able to survive in carrying out the business they have been engaged in. One proof of technological development that is increasingly rapid at this time is the internet. In the past, the internet was only used as a means of exchanging information or as a means of communication non-verbally, but to date, the benefits of an internet have been very influential on changes in competition in the business environment. The presence of Traveloka as a hotel ticket booking site and online travel proves that technological developments especially in the internet sector are very well developed in Indonesia, and capable of being run by local entrepreneurs. Traveloka Arthatama (2017) emphasizes the ease of use of applications by offering many practical and easy ordering and payment features.
Market segments
- OEM for Industry Inverter/Drives Suppliers
- BMS System Partners Automobile Industry
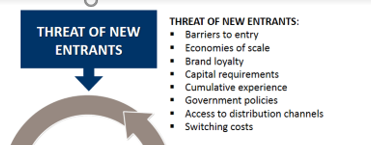
Unique Selling Points and strategic partners
In a world that includes automotive promotion, a USP is an acronym for Unique Selling Points or Proposition. It is something that describes a dealership’s peculiar position in the marketplace. This is what differentiates a business from others in the same industry or geographical location. There are many potential auto buyers in every community at all times (Dickons, 2019). Majority of them are not sure of what they need to do as well as where they need to shop. They as well comprehend that this will be a monumental decision in their lives. Thus, meeting a dealership that is trustworthy makes them feel good concerning their purchase. In case a potential consumer is unfamiliar with a brand, there does not exist any reason to think that a customer is going to walk into a showroom. A USP is the defining factor that sets an organization apart from its rivals. Online as well as offline retailers seek to communicate clearly their unique selling proposition to buyers in marketing approaches.
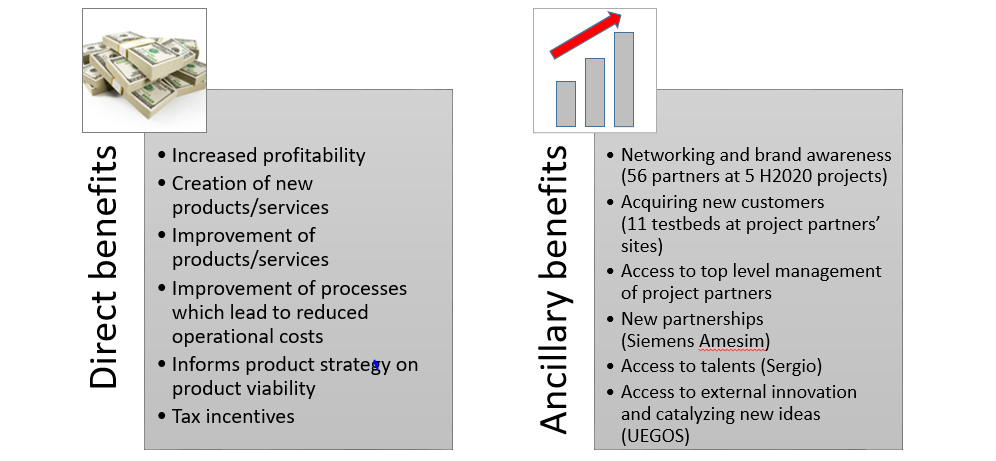
In the long term it is recommended that about 20% of the company revenues shall come from funded research. There are two geographical areas which shall be focused on Europa and US which equal values. Taking this in consideration the growth will constantly have a stable component, under the precondition that the Funded Research Project Team has stable employees, who understand ell the procedures and process which apply to get the approval. However, the executions performance allows to get additional leads as the role of a V&V (Validation and Verification Partner), which is a paid task, requires constantly good references. A satisfied customer reference has strong recommendation power, so that is it not Typhoon HIL offering their services but being introduced by others to take a role and being asked to join a consortium, joint venture or single OEM partner.
Sales Force and Promotion
Giving enticing incentives is one way for organizations to grow their consumer base, encourage loyalty from them and raise the profits. If a company is a B2B or a business-to-business operation, engaging in promotions may aid in accomplishing these objectives. Knowing the various promotions one can utilize, may enable them in making the best choice for a business. A promotion refers to a marketing activity that B2B firms engage in with the intention of attracting more clients (Azoulay et al., 2019). These undertakings may include promotional discounts, competitions and fiscal rebates. Product brands as well as wholesalers utilize this strategy to create partnerships with businesses. Common ones consist of retail stores, resorts, restaurants and grocery stores.
Pricing
Today, factors such as price matching have emerged as very essential. On the one hand, businesses that have failed to determine the right prices have failed due to losses or not getting any attention in the market. On the other hand, those that have succeeded has put in place measures that understand how the market will respond to a set price (Ali & Anwar, 2021). This is due to the price being the most vital ‘P’ in marketing. The marketing mix is made up of seven ‘Ps’ including product, people, place, promotion, physical evidence as well as price. Every one of them can be a differentiating factor in enticing customers.
To attract new consumers is a critical part of ensuring that ensures a successful sale of goods or services. Nowadays, the efficacy of marketing strategies is not determined by the approaches themselves but by the changes in price. Pricing impacts marketing in two different ways, first being that it influences the budget set aside for promotion (Ali & Anwar, 2021). The data on prices is usually not included in online marketing methods. When this is not done, it is near impossible to appropriately evaluate the performance of the campaign. It is thus crucial that the data is added to the digital strategies.
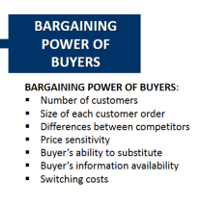
People and Processes
The critical path is people and time and not the competition.
Differentiation from the competition can be achieved by working with the customers and not for the customers. It is about understanding the customer’s either evident or laten pain and focus on solutions. This means getting more engaged with the customer, which requires training / coaching of the junior and senior sales people who still have old-fashioned behavior and approaches to market. Even some of them have not learnt the process of selling as the engagement on the past was truly on the on the technical level. Such process starts with initiation of discussions about known weak points and focusing on value and product transactions. It is a scaling process with the clients/customers which means that not all has to be done at once, but it can be done gradually which also leads to staggered success stories which can positivity impact on the communication on social media.
Future technical adaptation of simulation
As mentioned earlier, the needs of the consumer are not constant and will continue to change as time passes. This is natural since individuals desire more efficiency and effectiveness from the tools they use. Thus, companies as well need to find a team that is dedicated to improving a product and in this case, the technical team at Typhoon HIL. Adapting to evolving conditions is an essential part of running an organization. It is known widely that nothing is guaranteed to last forever. If one wants to attain success as an entrepreneur, they need to find how to adapt (Van Ruijven et al., 2019). Without having that capability, one may find themselves in serious issues. As the business landscape alters, readiness through preparation is important.
Financials
Finances are a necessary as well as critical component of any company. It is hard for profit-generating organizations to maintain operations for a long time without appropriate funds (Voronkova & Volenko, 2021). Apart from the above reason, productive management of the fiscal resources is important to be viable and sustainable in the long term. Financial management means efficient and effective planning, directing, organizing, and controlling the monetary activities and procedures of a firm. This consists of allocation of resources, fund procurement and use of funds.
A problem that emerges from failing to manage finances is poor planning as well as missing chances to better profits. One can state that when money management lacks, businesses are bound for failure. Without professionals in this subject, it is likely that entrepreneurs may overestimate revenues and plan for more expenditure (Voronkova & Volenko, 2021). There are benefits of accomplishing financial management, for instance, managing taxes.
Unique Contextual Subthemes Related to Legal Technology
This analysis does not provide new information, but provides an overall summary of the more interesting subthemes identified using the open-ended questions. The specific factors identified here are the sub-themes and the contextual themes that emerged. In this research the following factors were identified as salient and specific to the legal technology:
- Legal Usefulness.
- Client Focus.
- Usefulness to the Case-at-Hand.
- Use by Business Partners.
- The Availability of In-House Support.
- The Influence of Professional Legal Culture.
- The Essential Nature of the Product to Practice.
- The Importance of Fit with Work Flow.
- The Integration of the Legal Technology into Practice.
- Organization Factors.
- Cost of Substitutes.
Conclusion
HIL is the future approach that businesses should adopt in their operations. The reasons for this include offering simplification of lab exercises, reduction of required infrastructure, and possible to concentrate on specific tasks like controller theory instead of embedded programming. By applying the theory of Porter’s five forces, the company is able to find the market for the model. It allows them to analyze competitive environment of the sector. The factors studied in this concept can be used, as seen in the paper, to offer organizations with the policy for the ability and consideration to comprehend interactions in the industry and thus, strategize. In addition, based on the quantitative and qualitative responses from the survey conducted, it is a fact that the model impacts the business operation effectively and influence the outcomes of various organizations. The technology application model (TAM) when applied therefore, there would be a positive improvement in how goods and services access the market and their transfer from manufacturers to the customers. The current business therefore should integrate the model in their industry application to ensure tehri is consistency in operations and availability of proper processes in their organizations.
References
Ajzen, I. (1991). The theory of planned behavior. Organizational Behavior and Human Decision Processes, 50(2), 179-211. doi:10.1016/0749-5978(91)90020-t
Ali, B. J., & Anwar, G. (2021). Marketing Strategy: Pricing strategies and its influence on consumer purchasing decision. Ali, BJ, & Anwar, G. (2021). Marketing Strategy: Pricing strategies and its influence on consumer purchasing decision. International journal of Rural Development, Environment and Health Research, 5(2), 26-39.
Anon (2022). Advancing Open Standards in Integrated Modular Avionics: An Industry Analysis. IEEE Conference Publication.
Azoulay, P., Wahlen, J. M., & Zuckerman Sivan, E. W. (2019). Death of the salesman but not the sales force: how interested promotion skews scientific valuation. American Journal of Sociology, 125(3), 786-845.
Babu, T. N., Shyam, S., Kaul, S., & Prabha, D. R. (2022). Natural fiber composites–an alternative to plastics in the automotive industry: A review. Proceedings of the Institution of Mechanical Engineers, Part L: Journal of Materials: Design and Applications, 236(2), 237-266.
Baehre, S., O’Dwyer, M., O’Malley, L., & Lee, N. (2022). The use of Net Promoter Score (NPS) to predict sales growth: insights from an empirical investigation. Journal of the Academy of Marketing Science, 50(1), 67-84.
Baker, M. J. (2003). The marketing books. Oxford: Butterworth-Heinemann.
Baker, M. J., Brown, A. J., & Brownlie, D. (1990). Marketing: Theory and practice. Hound mills: MacMillan.
Behavioral change models. (n.d.). Web.
Beier, G., Kiefer, J., & Knopf, J. (2022). Potentials of big data for corporate environmental management: A case study from the German automotive industry. Journal of industrial ecology, 26(1), 336-349.
Besanko, D., Dranove, D., Shanley, M. and Schaefer, S. (2013) Economics of Strategy. [6th Edition]. Hoboken: Wiley.
Chatterjee, Sheshadri, Ranjan Chaudhuri, and Demetris Vrontis. 2021. “Antecedents and Consequence of Social Media Marketing for Strategic Competitive Advantage of Small and Medium Enterprises: Mediating Role of Utilitarian and Hedonic Value.” Journal of Strategic Marketing 1–20. doi: 10.1080/0965254X.2021.1954070.
Davis, F., & Venkatesh, V. (2004). Toward prototype user acceptance testing of new information systems: Implications for Software Project Management. IEEE Transactions on Engineering Management, 51(1), 31-46. doi:10.1109/tem.2003.822468
Davis, F. D., Bagozzi, R. P., & Warshaw, P. R. (1989). User acceptance of computer technology: A comparison of two theoretical models. Management Science, 35(8), 982-1003. doi:10.1287/mnsc.35.8.982
Davis, F. D. (1993). User acceptance of information technology: System characteristics, user perceptions and behavioral impacts. International Journal of Man-Machine Studies, 38(3), 475-487. doi:10.1006/imms.1993.1022
Dehghan-Nayeri, N., Shali, M., Navabi, N., & Ghaffari, F. (2018). Perspectives of oncology unit nurse managers on missed nursing care: A Qualitative study. Asia-Pacific journal of oncology nursing, 5(3),327-336.
Dickons, G. (2019). How to use the knowledge of your unique selling points. Journal of Aesthetic Nursing, 8(5), 253-254.
El-Huni, A., Salazar, F. B. C., Sharma, P. K., & Fleming, P. S. (2019). Understanding factors influencing compliance with removable functional appliances: a qualitative study. American Journal of Orthodontics and Dentofacial Orthopedics, 155(2), 173-181.
Donaldson, B. (2004). Sales management: Theory and practice. Basingstoke: Palgrave Macmillan.
Faris, S. (2019). What statistical tools of analysis are used in survey research?
Habibie, Trino Jusuf, Rahmat Yasirandi, and Dita Oktaria. 2022. “The Analysis of Pangandaran Fisherman’s Actual Usage Level of GPS Based on TAM Model.” Procedia Computer Science 197:34–41. doi: 10.1016/j.procs.2021.12.115.
Hardware-in-the-loop simulation tools and implementation – technical articles. (n.d.).
Hardware-in-the-loop testing concepts & applications. (n.d.).
Hill, R. J., Fishbein, M., & Ajzen, I. (1977). Belief, attitude, intention and behavior: An introduction to theory and research. Contemporary Sociology, 6(2), 244. doi:10.2307/2065853
Kabeyi, Moses & Jeremiah Barasa (2018). “Michael Porter’s Five Competitive Forces and Generic Strategies, Market Segmentation Strategy and Case Study of Competition in Global Smartphone Manufacturing Industry.” International Journal of Applied Research 4(10):39–45. doi: 10.22271/allresearch.2018.v4.i10a.5275.
Kalayou, M., Endehabtu, B., & Tilahun, B. (2020). The applicability of the Modified Technology Acceptance Model (TAM) on: JMDH.
Katebi, Ali, Peyman Homami, and Mohammad Najmeddin. 2022. “Acceptance Model of Precast Concrete Components in Building Construction Based on Technology Acceptance Model (TAM) and Technology, Organization, and Environment (TOE) Framework.” Journal of Building Engineering 45:103518. doi: 10.1016/j.jobe.2021.103518.
Laitinen, M. A. (2018). Net promoter score as indicator of library customers’ perception. Journal of Library Administration, 58(4), 394-406.
Mathieson, K. (1991). Predicting user intentions: Comparing the technology acceptance model with the theory of planned behavior. Information Systems Research, 2(3), 173-191. doi:10.1287/isre.2.3.173
Marangunić, N., & Granić, A. (2014). Technology acceptance model: A literature review from 1986 to 2013. Universal Access in the Information Society, 14(1), 81-95. doi:10.1007/s10209-014-0348-1
Magretta, J. (2011) Comprendre Michael Porter. Concurrence. Stratégie. Paris: Eyrolles.
McKinsey & Company. “The Five Trademarks of Agile Organizations | McKinsey.” Www.mckinsey.com, 2018.
Montandon, J. E., Silva, L. L., & Valente, M. T. (2019). Identifying experts in software libraries and frameworks among github users. In 2019 IEEE/ACM 16th International Conference on Mining Software Repositories (MSR) (pp. 276-287). IEEE.
Nissimagoudar, P., Mane, V., M, G., & Iyer, N. (2020). Hardware-in-the-loop (HIL) simulation technique for an automotive electronics course.
Porter, M. E. (2008) Competitive Strategy. New York: Free Press.
Porter, M. E. (2008) The Five Competitive Forces That Shape Strategy. Harvard Business Review.
Porter, M. E. (1991) Towards a Dynamic Theory of Strategy. Strategic Management Journal. 12(S2).
Porter, M. E. (1986) Competition in Global Industries. Boston: Harvard Business Press.
Shi, B. (2013). An empirical study on small enterprises e-commerce adoption decision based on Tam Model & Toe Framework. Advanced Materials Research, 712-715, 2521-2524. doi:10.4028/www.scientific.net/amr.712-715.2521
Storylead AG, S. (n.d.). Customer Success: Für mehr Loyalität und mehr Stammkunden.
Anon, Cohen, WM and DA Levinthal (1990). Absorptive capacity: a new perspective on learning and innovation. Administrative Science Quarterly, 35(1), 128–152. (2). Web.
Cohen, WM and DA Levinthal (1990). Absorptive capacity: A new perspective onlearning and innovation. Administrative Science Quarterly, 35(1), 128–152. (2)
Hirschheim, R.: Introduction to the special issue on Quo Vadis TAM – issues and reflections on technology acceptance research. J. Assoc. Inf. Syst. 8(4), 211–218 (2007)
Chatterjee, Sheshadri, Ranjan Chaudhuri, and Demetris Vrontis. 2021. “Antecedents and Consequence of Social Media Marketing for Strategic Competitive Advantage of Small and Medium Enterprises: Mediating Role of Utilitarian and Hedonic Value.” Journal of Strategic Marketing 1–20. doi: 10.1080/0965254X.2021.1954070.
Fung, Han Ping. 2014. “Using Porter Five Forces and Technology Acceptance Model to Predict Cloud Computing Adoption among IT Outsourcing Service Providers.” Internet Technologies and Applications Research 1(2):18. doi: 10.12966/itar.09.02.2013.
Habibie, Trino Jusuf, Rahmat Yasirandi, and Dita Oktaria. 2022. “The Analysis of Pangandaran Fisherman’s Actual Usage Level of GPS Based on TAM Model.” Procedia Computer Science 197:34–41. doi: 10.1016/j.procs.2021.12.115.
Katebi, Ali, Peyman Homami, and Mohammad Najmeddin. 2022. “Acceptance Model of Precast Concrete Components in Building Construction Based on Technology Acceptance Model (TAM) and Technology, Organization, and Environment (TOE) Framework.” Journal of Building Engineering 45:103518. doi: 10.1016/j.jobe.2021.103518.
McAran, Dan, and Sharm Manwani. 2016. “The Five Forces of Technology Adoption.” Pp. 545–55 in HCI in Business, Government, and Organizations: eCommerce and Innovation. Vol. 9751, Lecture Notes in Computer Science, edited by F. F.-H. Nah and C.-H. Tan. Cham: Springer International Publishing.
Stoykova, A. (2018). Market Dynamics of Stock Exchanges of South East Europe–Efficiency and Harmonization. Ikonomiceski i Sotsialni Alternativi, (2), 70-87.
Straub, Detmar, Mark Keil, and Walter Brenner. 1997. “Testing the Technology Acceptance Model across Cultures: A Three Country Study.” Information & Management 33(1):1–11. doi: 10.1016/S0378-7206(97)00026-8.
Suppipat, S., & Hu, A. H. (2022). A scoping review of design for circularity in the electrical and electronics industry. Resources, Conservation & Recycling Advances, 200064.
Symeonaki, M., Karamessini, M., & Stamatopoulou, G. (2019). Measuring Labor Market Transition Probabilities in Europe with Evidence from the EU‐SILC. Data Analysis and Applications 2: Utilization of Results in Europe and Other Topics, 3, 121-136.
“The Importance of Networking.” Www.linkedin.com.
Van Ruijven, B. J., De Cian, E., & Sue Wing, I. (2019). Amplification of future energy demand growth due to climate change. Nature communications, 10(1), 1-12.
Voronkova, O., & Volenko, V. (2021). The advanced experience in the organization of the combined systems of the state financial control and its importance for ukraine. Financial and credit activity: problems of theory and practice, 3(38), 182-190. Web.
Yeung, H. W. C. (2022). Explaining Geographic Shifts of Chip Making toward East Asia and Market Dynamics in Semiconductor Global Production Networks. Economic Geography, 1-27.
Zakour, Amel B. n.d. “Cultural Differences and Information Technology Acceptance.” 7.
Venkatesh, V., Bala, H.: Technology acceptance model 3 and a research agenda on interventions. Decis. Sci. 39(2), 273–315 (2008).
Porter, M.E.: How competitive forces shape strategy. Harvard Bus. Rev. 57(2), 137–145 (1979).
Chau, P.Y.K., Hu, P.J.: Examining a model of technology acceptance by individual professionals: an exploratory study. J. Manag. Inf. Syst. 18(4), 191–229 (2002)
Brown, S.A., Dennis, A.R., Venkatesh, V.: Predicting collaboration technology use: integrating technology adoption and collaboration research. J. Manag. Inf. Syst. 27(2), 9–53 (2010)
Appendix A
Definition of Tier 1 to Tier 3
Tier 1
Tier 1 companies are large companies, multi-site, multinational companies that are most likely to need a global expansion system. These companies have revenues of more than 1 billion USD and more than 1,000 employees.
Tier 2
Tier 2 includes fast growing start-ups and mid-sized organizations with revenues of up to 1 billion USD. They may be single-site or multi-site companies and have 300-600 employees.
Tier 3
Tier 3 is majorly used by the start-up businesses and small companies since they cater for customer needs from vertical areas such as manufacturing and retail. The business has an enhanced features for their market segments hence they are often difficult to customize.
Appendix B: Glossary
- B2B- business to business
- B2C-bussines to customer
- COVID – corona virus disease
- HIL- Hardware in the Loop
- IOE- Internet of Everything
Attachments
