Executive summary
Any company doing business has to keep correct records in order to know the progress of the organization. Any business that does not keep proper records might find itself out of business since they will never know which move to take. Woolworth and Westfarmers, just as any other business organization keep their accounting record for better operations. The records in these business organizations help the organizations to know their profitability levels, as well as knowing where to make the necessary adjustments for the organization if they are needed. Therefore, the accounting ratios play an important role in the operations of Woolworths and Westfarmers, which has made them among the best organizations in the world.
Introduction
Woolworth is a big retail chain in Australia and New Zealand. It is the largest retail firm in both New Zealand and Australia in terms of sales and market capitalization. It is also the largest in food retailing in Australia and the second largest in providing the same in New Zealand. The company is the largest retailer in takeaway liquor and poker machine and hotel operator in Australia. The company has been ranked the 19th in the world in retail. The firm’s products are also available online. It operates across all the Australian states and across Waiheke and North Island in New Zealand (Maguire 32).
Westfarmers limited is more diversified and includes home improvements, supermarkets, chemicals, departmental stores, office supplies, energy and fertilizers, Insurance, coal mining and safety and industrial products. The main objective of this company is to deliver shareholder satisfaction in the long run.
This paper aims at giving the analysis of financial ratio in terms of profitability for both Westfarmers and Woolworth companies in the years 2010 and 2011. The paper also provides financial advice on the investment opportunities and the best strategies to put in place in line with the financial conditions of the two businesses (Maguire 31).
Performance Analysis
Profitability Analysis- The major motive of every firm is to make profits. Therefore, profitability ratios are very important in a business. This is because they are used to determine a company’s condition in terms of profits and the risks involved. Profitability ratios also help the managers to make proper and informed decisions of the company. They are also important to the shareholders of a business by demonstrating how their money has been utilized. Profitability ratios can be divided into two: margins which show the ability of a firm to convert sales into profits and returns ratios that shows the firm’s ability to generate income for its shareholders (Maguire 34).
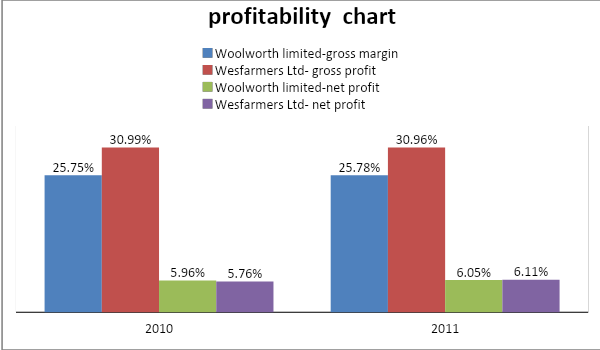
Gross Margin Ratio and Net Profit Margin Ratio- As indicated above, Wesfarmers Ltd’s operation is showing good performance since its gross profit margin has remained stable for the past two years. From the drop in 2010, at 30.99 %, its gross profit margin is now at 30.96% as of the end of last year. However, its operating profit margin has increased for two straight years already. From 5.76% in 2010, profit increased to 6.11% in 2011. This shows that they were efficient in controlling the costs and expenses associated with day-to-day business operations. Net Profit Margin, an indicator of how the company is good at converting their revenue into actual profit, shows good promise. Now, let us look at the performance of its competitor. The same observation can be said of Woolworths Ltd, which shows efficiency in its percentage of revenue available to cover its expenses (gross profit margin) although its net profit margin is the lowest among the two. Woolworth limited had a gross profit margin of 25.73% in 2010 and 20.78% in 2011. Gross profit margin shows how well a business has been able to control its cost of inventory. This shows that the business experienced some improvements. This shows that Woolworth Company was able to pass the costs of inventory to customers successfully(Thompson 3). However, when compared with Wesfarmers Ltd’s, it should be considered that the highest Net Profit Margin earner, however, both are having slight changes in their profitability. Performance-wise, Wesfarmers Ltd is leading the competition but the lead is just a small gap because Woolworth limited is profitability and revenue is not far behind. The graph below shows how the two companies performed;
Return on Equity- This ratio tends to be the most important as far as investors in the business are concerned. It shows the returns resulting from the money invested in the business. Investors look at this ratio while deciding whether to invest in the business or not. It shows how well the company utilizes investors’ money in its operations (Alvarez & Fridson 73). Woolworth Company had a return on equity ratio of 26.07% and 27.28% in 2010 and 2011 respectively. This shows that every dollar that the company receives from investors was able to make another 26.07cents in 2010 while in 2011 the results were up by 1.21%. The results show that the company is committed to making proper utility of investors’ funds. On the other hand, it was performing poorly in making proper use of investors’ funds. It had 6.34% and 7.59% in 2010 and 2011 respectively. Westfarmers Company is not attractive to investors as compared to Woolworth although it is more profitable. The graph below shows:
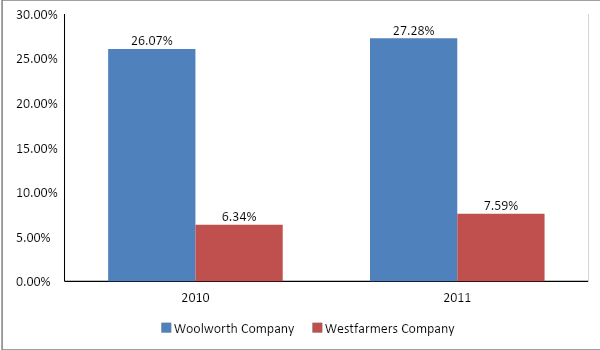
From the graph, we note that Woolworth Company was performing well than Westfarmers Company. This may be a result of the type of financing the company uses in its capital structure.
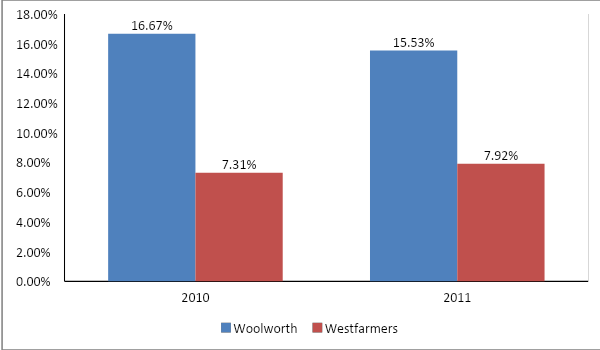
Return on Assets- Assets in a business are used to generate profit. This ratio is important as it shows how efficiently a business is using its assets to generate profit. It measures the amount of profit earned by a business when compared to its investment level. Woolworth had 16.67% and 15.53% in 2010 and 2011 respectively while Westfarmers Company had 7.31% and 7.92% in 2010 and 2011 respectively. This ratio is used to demonstrate how efficient asset management is. The higher the ratio the more efficient is assets management. Woolworth has higher returns on assets showing that the company is doing a great job in managing its assets to generate sales than Westfarmers (Alvarez & Fridson 75). The following graph shows the trend of the performance of the company
Efficiency
Asset Turnover – One of the most revealing ratios, however, is the asset turnover ratio which indicates the type of capacity companies have(Weetman 163). It hovered from just 2.8 to 2.57 both of which are very close to each other for Woolworths Ltd. The difference isn’t even significant for a company of its size because they are just too big to place emphasis on the difference. The asset turnover of Wesfarmers Ltd isn’t as impressive compared to competitors as it is 1.27 and times 1.30 for years 2010 and 2011 respectively. This means that Woolworths Ltd already has a very impressive capability of using its capital assets. At the rate of 2.80, it means that the company will roughly be able to triple its size every year.
Inventory Turnover- the number of days taken by Woolworths Ltd to generate cash from inventory increased from 33 days in 2010 to 34 days in 2011 while for Wesfarmers Ltd it increased from 49 days to 50 days in the year 2010 to 2011. However, Woolworths Ltd was taking fewer days to convert stock to cash as compared to Wesfarmers Ltd. Firms are not obliged to carry these inventories. For example, they could buy materials day by day, as needed. Then they would pay higher prices for ordering in small lots, and they would risk production delays if the materials were not delivered on time. They can avoid that risk by ordering more than the firm’s immediate needs. Similarly, firms could do away with inventories of finished goods by producing only what they expect to sell tomorrow. But this also could be a dangerous strategy. A producer with only a small inventory of finished goods is more likely to be caught short and unable to fill orders if demand is unexpectedly high. Moreover, a large inventory of finished goods may allow longer, more economical production runs.
But there are also costs to holding inventories that must be set against these benefits. These are called carrying costs. for example, money tied up in inventories does not earn interest; storage and insurance must be4 paid for, and there may be a risk of spillage or obsolescence. Therefore, production managers need to strike a sensible balance between the benefits of holding inventory and the costs.
Debtors Turnover- this is the number of days that the company takes to collect cash from debtors. When your customers stretch payables, you end up with a longer collection period and greater investments in accounts receivable. Thus, you must establish a collection policy. Woolworths Ltd has the lowest credit policy of 1.5 days in 2010 and 2 days in 2011 as compared to Wesfarmers Ltd which had 10 days in 2010 before increasing to 2011.
There is always a potential conflict of interest between the collection departments. Sales representatives commonly complain that they no sooner win new customers than the collection department frightens them off with threatening letters(Vasigh, Fleming and Mackay, 78). The collection manager, on the other hand, bemoans the fact that the sales force is concerned only with weaning orders and does not care whether the goods are subsequently paid for. This conflict is another example of the agency problem. Good collection policy balances conflicting goals. The company wants cordial relations with its customers. It also wants them to pay their bills on time.
Creditors Turnover- this ratio shows the time taken to pay creditors. Wesfarmers Ltd had its ratio increase from 49 days to 50 days while for Woolworths Ltd it remained 40 days. For the two years,
Liquidity
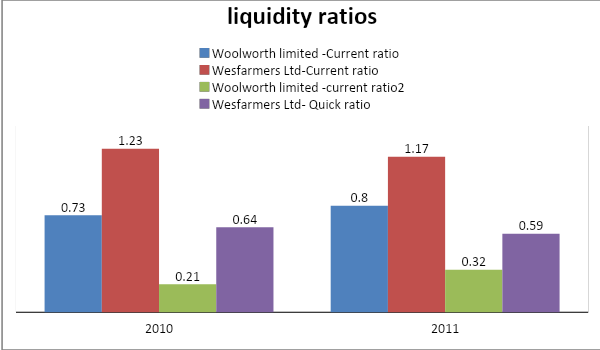
The current ratio informs investors how easily a company can pay off its current liabilities. The Woolworth limited had a current ratio of 0.73 increased to 0.8 in 2011 while Wesfarmers Ltd had a ratio of 1.23 and 1.17. A higher current ratio is desirable to investors because it shows that the company has prudently managed its cash flow and thus can very easily handle its short-term debt thus preventing unnecessary hold-ups and incurred interests that could cost the company.
Quick Ratio is a better indicator of a company’s ability to meet its financial obligations if it lost credit. This is so because stock, which is not easy to value accurately or dispose of at will, has been removed. Comparing the two companies none of them has a ratio of 1:1 that is recommended, however, Wesfarmers Ltd performed well than Woolworth limited as shown in the table above and the graph below.
Solvency
This section will focus on how the companies are organized in terms of capital. Is the company majorly financed by debt or by equity and depending on the dominant financing method, is it the best decision in the long term.
Interest coverage. This ratio is important in indicating whether a company has sufficient cash to finance its debts(Kapil 125). Thus higher interest coverage is desirable to interested investors. This ratio is, however, limited in that it does not guarantee that the cash flow from operating activities will increase and this is the main concern for the investor (Collier 93). The interest coverage for Woolworth limited was times 12.92 in 2010 before decreasing to 10.92 times in 2011 while for Wesfarmers Ltd it was 4.39 times and 6.14 times for 2010 and 2011 respectively. Woolworth limited has higher interest coverage and this is good for investors as it shows that they can service their debts and that they have been prudently managed while having a low-interest coverage ratio although it is also good for investors.
Debt to Equity Ratio. This ratio is usually utilized by investors to determine the solvency of a company. If the ratio is greater than 1, then the company is technically insolvent i.e. if the company was dissolved, nothing would be left for shareholders (Woelfel 75). The Debt to Equity Ratio for Woolworth limited was 136.48% in 2010 before increasing to 168.86% in 2011 while for Wesfarmers Ltd it was 58.89% and 61.14% for 2010 and 2011 respectively. The debt to equity ratios for the two companies being analyzed is above one. This means that is technically insolvent. This reveals to investors that should the company be wound up, then nothing would be left for them as every disposed asset will go into paying off debts. This tells investors that the companies are majorly financed by debt as opposed to equity. While this may not seem a very good idea to a wise investor, it may in fact be a cheaper way of financing the company’s activities as debt is usually cheaper than equity.
Debt Asset Ratio shows how many assets are financed by debt. In this case, 57.71% of the assets of Woolworth limited financed by debt before going up to 62.81% in 2011. The ratio is low in Wesfarmers Ltd which means that the company has fewer assets that are financed by debt as compared to Woolworth limited.
Other information. The companies operate in an environment that is dynamic due to the current slowdown in the economy and this has affected their performance.
Limitations
Ratios have inherent flaws that make them risk relying on while attempting to make a financial decision. It relies on historical data (Bragg 86), which are prepared by people who want to make the accounts to suit their needs as in the case of Enron. The ratios may also not be compared as various companies operate in different industries. It has been established that even companies in the same industry are not always alike(Moles, Parrino and Kidwell 106). With regard to the above point, it is vital to keep in mind that ratios are best used in the analysis of similar competitors. This suggests that industry norms can only be derived from a group of similar companies. It is reported that this flaw makes it difficult for even professional financial analysts to compare company ratios with industry ratios.
Another challenge with regard to the use of ratio analysis is the fact that company size may vary (Taparia 93). This fact suggests that care should be taken when comparing large players with small players in the industry. It has been reported that the size of the company may affect the business strategy used in the company (Taparia 93). In addition to this is the fact inflation may distort the balance sheet. It should be noted that assets are recorded at cost on the balance sheet and not at market value. Though the balance sheet caters for depreciation it has been observed that the actual market value of assets may be much higher due to inflation.
Conclusion
Westfarmers has better methods of reducing costs of inventory than Woolworth as can be shown by higher gross profits margin. It is also clear that Westfarmers had better methods of reducing the costs of the business than Woolworth. However, Woolworth was a leader in return on equity showing that it had adequate utility of investors’ funds as compared to Westfarmers. The ratios also showed that Woolworth had good management as far as managing assets to generate sales was concerned. The analysis showed that Woolworth was efficient in asset management and inefficient in cost reduction while Westfarmers was efficient in cost reduction and inefficient in managing assets and shareholders’ funds.
Recommendations
Wesfarmers Ltd is a good performer in terms of solvency and liquidity. They need to manage their credit policy to make use of debt, assets and inventory efficiently compared to Woolworth ltd that has a risky capital structure.
Works Cited
Alvarez, Fernando and Martin Fridson. Financial Statement Analysis: A Practitioner’s Guide. 4th ed. New York: John Wiley & Sons, Inc, 2011. Print
Bragg, Steven. Wiley Revenue Recognition: Rules and Scenarios. 2nd ed. New York: John Wiley and Sons, 2010. Print
Collier, Paul. Accounting for Managers: Interpreting Accounting Information for Decision-Making. New York: John Wiley and Sons, 2003. Print
Kapil, Sheeba. Financial Management. New Delhi: Pearson Education India, 2011. Print.
Maguire, Marion. Financial Statement Analysis. Munich: GRIN Verlag, 2007. Print.
Moles, Peter, Parrino, Robert and David Kidwell. Fundamentals of Corporate Finance – European Edition. San Francinsco: John Wiley and Sons, 2011. Print.
Taparia, Jay. Understanding Financial Statements: a journalist’s guide. Illinois: Marion Street Press Inc., 2004. Print.
Thompson, Lance. A 2003, “Improving accounting efficiency,” AllBusiness. AllBusiness.com, Inc., n.d. Web. 2011. Web.
Vasigh, Bijan, Fleming, Ken and Liam Mackay. Foundations of Airline Finance: Methodology and Practice. Surrey: Ashgate Publishing Limited, 2010. Print.
Weetman, Pauline. Financial Accounting: An Introduction. 4th ed. New York: Financial Times/Prentice Hall, 2006. Print.
Woelfel, Charles. Financial statement analysis: the investor’s self-study guide to interpreting and analyzing financial statements. USA: McGraw-Hill Publishers, 1994. Print.
Appendix
Student Group Names:_________________________________
ID No.: Class Time/Day
- Zhengqing Peng 211079449 2PM on Monday
- Yulong Zhu 211019872 2PM on Monday
- Wenya Cui 211007984 2PM on Monday