Introduction
Business Intelligence (BI) encompasses IT solutions providing decision support with, chain end, monitoring reports and dashboards both analytical and has advanced visualization. The final aim of (BI) is to consolidate the information available within the organization’s databases. “The processes, technologies and tools needed to turn data into information and information into knowledge and knowledge into plans that drive profitable business action. BI encompasses data warehousing, business analytics and knowledge management” (Leat, 2007).
In the process, all parts are engaged in the definition of analytical layers in order to mask the complexity of the data structures and since the year 1990 and the year 2000, business intelligence (BI) platforms are built depending on data warehouses to integrate and organize information from business applications (via extraction mechanisms, transfer and consolidation). and the aim is to respond by optimized reports for queries and indicators thus giving executive managers the ability to act in a timely manner.
Zeng et al. (2006) define BI as “The process of collection, treatment and diffusion of information that has an objective, the reduction of uncertainty in the making of all strategic decisions.” In recent years, BI platforms benefit of databases, which allow the new technology to directly handle unstructured data. Business Intelligence applications benefit from the powerful hardware architecture, with the emergence of 64-bit architectures, multi-cores, and processing in memory.
They can thus run more quickly complex processes such data mining and multidimensional analysis – which includes modeling data according to several axes. “Real time BI: It allows for the real time distribution of metrics through email, messaging systems and/or interactive displays” (Ranjan, 2005).
In the Traffic Department in the United Arab Emirates there permanently deal with increasing amounts of information, this increase is due to the growing development in the department. So in coming days the Traffic Department in UAE might face kind of tumble in its performance if they didn’t adopt effective solutions to manage the growing of information. “Business intelligence (BI) has two basic different meanings related to the use of the term intelligence.
The primary, less frequently, is the human intelligence capacity applied in business affairs/activities. Intelligence of Business is a new field of the investigation of the application of human cognitive faculties and artificial intelligence technologies to the management and decision support in different business problems” (Ranjan, 2005)
The traffic police work entails a permanent updated reports on issues related to their work, these reports must be updated information about vehicles and drivers, in addition to the condition of roads and traffic accidents, and they can take advantage of external information, such as security reports and the weather also the event of natural disasters. Therefore, the adoption of BI is an effective method to resolve all the difficulties that can face the Department in the coming days from several ways.
“Business intelligence is not necessarily about tools and technologies; rather it is strategies of combining data from various sources with methodologies that make those facts solidify in a cohesive manner” (Nelson, 2008).
Why BI is important for traffic police in UAE?
Improvement in operational performance
The technique which BI works through data collection and then processing and analyzing the data then to issuing periodic reports makes it an excellent assistant for human effort.
If we imagine a hot spot on a highway and were the needed elements in the Traffic Department have prior knowledge of what happened and them able at the same time to anticipate what will happen next. Then we can imagine how would be a positive impact on its performance to provide the suitable service.
Improvement in customer service
The Business Intelligence (BI) ability to identify priorities for action in resolving the problems resulting from traffic accidents , traffic congestion or natural disasters, which can produce problems or injuries, it will gives the Traffic Department the biggest chance to provide the appropriate service and the ability to help those in need as soon as possible.
Identification of new opportunities
By adopting BI system, the traffic department will achieve the required efficiency through rapid response to the requirements of success in providing services to people and help to those who need it, the department will gain greater capacity to expand its services to include, for example, building an a system to anticipate accidents and places of existence and then the permanent readiness of the initiative to help people.
Business Intelligence Tools
- Data Warehouse: The bridge between the rigid data and analyst data , therefore, possible to take the reports detailed overview of the status quo
- Dashboard: it’s the easy way to observe all information by one click , most time you will able to see a full report on one page through the real time user interface showing a graphical presentation of the current status.
- Data Mining: the process to generate useful information by analyzing databases with huge amount of data.
- Business activity monitoring: Through the involvement of all those involved in the work of the traffic department leads to improve its work so creating new opportunities for success, through periodic reports and statistics and studies that diagnosed activity during a specific period.
Potential Barriers to Adaptation of BI Solutions
There will be no major problems by adopting business intelligence tools but the adoption process would creates kind of confusion in the beginning for the department because of the ignorance of the elements of department of how to use the new system. So of the biggest problems that could face the traffic department at the adapting a BI solution, will be how to create a major point of departure from the old style to a modern style, which means the involvement of all the human elements of the Traffic Department in training courses of how to use the new system.
Summary
The massive influx of traffic data in short period of time in Traffic Department can be confusing if it has been processed by just human effort, which requires the use of computer systems and software to carry this process to issue reports and visualization to be help for the human element. These days the specialists in the field of Business Development believe the ability of how to process data is the mainstay of any evolution.
The data that flows on a permanent basis to the Traffic Department which it is resulting of traffic police work and other government organizations is divided into several types like
- Roads situation moment by moment.
- Cases of sudden congestion in big cities and on highways.
- Traffic accidents and the number of casualties and the status of each casualty.
- The expected state of the weather might be a huge help to avoid traffic accidents or unexpected congestion.
- Data of drivers and vehicles, in particular the legal status of some drivers and the technical information about any vehicle.
The lack of implementation the Business Intelligence System will not stop the Traffic Department work, but certainly will cause confusion in the future as a result of the increasing number of vehicles and drivers and thus an increase in the number of accidents and traffic problems so slower to provide help to those in need.
Problem Research: Business Intelligence Systems and Data Organization
Business Intelligence (BI) systems are widely used in the private sector, but its implementation in the public sector is promising as well (Nolan, 2012). The BI may be used in the multiple police organizations to support their working process. Many researchers consider that one of the essential functions of the BI software is the efficient data organization (Agiu, Mateescu, & Muntean, 2014). In this way, police organizations may effectively apply the systems for the allocation, operation of resources, and planning (Carlsson, Skog, & Tona, 2010).
The purpose of the paper is the creation of research plan that would allow the assessment of the BI system usage effects on the performance and efficiency of UAE police. The selected research methods and tools will help to evaluate the overall success of the BI system integration into the context of the police.
Research Plan
Hypothesis
The hypothesis of the study is the following: the integration of the BI systems in the police working process impacts the data organization in a positive way; as a result, it may increase the working productivity and efficiency.
Research Design
According to Moskovitz and Even (2014), the BI software provokes benefits associated with the organizational performance and management (p. 13). To provide the evidence for this statement, the study focuses on the evaluation of the BI’s multiple impacts on such aspects of working performance as 1) quality of data organization, 2) the BI’s user satisfaction, and 3) overall organizational impact. The BI system implementation is the independent variable of the study while its effects on the working process are considered the dependent variables.
The study includes the methods of both quantitative and qualitative research. The qualitative research method is the inductive evaluation of the previous research findings, and the quantitative research method is the analysis of the collected data. Along with the literature review, the main tools of data collection include the survey, questionnaire, and interviews.
The survey will comprise 20 items related to the BI system integration and operation which the study participants will be asked to evaluate on a 5-point scale ranged from the extremely negative estimation to the extremely positive one. The questionnaire will include 15 questions implying the bipolar answers (yes/no). The questionnaire will help to reveal the individual attitudes towards the BI systems application within the organization.
The sample of the study is the randomly selected group of UAE police employees. For the research, one of the police service organizations will be selected, and the sample will comprise from 100 to 150 employees of both genders and different age. The variables of age and gender will be taken into consideration while analyzing the data collected with survey and questionnaire.
For the analysis of the collected data the software tools, such as SPSS and SAS, will be implemented.
Justification of Research Methods Selection
The application of both quantitative and qualitative research methods will help to identify the statistical relationship between the variables and, at the same time, investigate the specific patterns of correlation between the analyzed aspects. According to Collins, Joseph, and Bielaczyc (2004), the qualitative research methods help to understand and interpret the interrelations between the variables while the quantitative methods allow the researcher to test the hypothesis and provide the evidence for the predictions (p. 15). Therefore, the application of both methods will help to receive the comprehensive information about the issue.
The random sampling technique is characterized by the representativeness of the studied population, and it helps to attain the generalized results (Creswell, 2003). However, it is mentioned that for the achievement of a higher level of reliability, it is important to take into consideration the multiple characteristics of the population (gender and age variables). But the data analysis and the descriptive statistics tools, such as correlation and covariance, may help to reduce the test bias.
SPSS and SAS are the commonly used tools of the computerized statistical analysis (Oyeyemi, 2010). The packages are meant to help researchers to comprehend the characteristics of the collected data in details. By using SPSS or SAS, it is possible to learn about the data value, the character of variables, distribution range, etc. The quantitative analysis will help to arrange the data, summarize it, and make the consequent inference and interpretation of the results.
The study will assist in the evaluation of the BI technologies on the working performance within the context of the police organization from the perspective of the specifically chosen performance and quality indicators. The evaluation of the effects of the BI system integration in the randomly selected organizational settings will allow comprehending the overall value of BI for the police operational processes.
It is presumed that the BI technologies may provoke the favorable changes in the police performance and may lead to the significant improvement. Therefore, the current study is of great importance, because it can positively affect the performance of the public sector and, as a result, influence the favorable changes in the society.
Methods of Data Collection
Data Collection Tools
The purpose of the paper is the evaluation of data collection methods and the creation of efficient instruments for the accumulation of information about BI System usage and its effects on organizational performance. It is observed that BI software creates benefits in the data organization and operation (Agiu, Mateescu, & Muntean, 2014; Carlsson, Skog, & Tona, 2010). And the purpose of the study is the identification and assessment of BI’s favorable impacts.
The study will employ both qualitative and quantitative data collection methods. While qualitative methods provide information that may help to identify the patterns between the variables’ interrelations, the quantitative data is associated with a high level of precision, accuracy, and objectivity (Creswell, 2003). Qualitative data is interpretable; it is subjective yet can be effectively correlated with the theoretical frameworks (Morgan & Smircich, 1980).
Quantitative data is numerical and statistical, and it is characterized by a minimal possibility of result biasing (Brown & Hedges, 2009). Survey, questionnaire, and interviews (comprised of expanded versions of survey and questionnaire questions) complement each other and will help to evaluate the accumulated data from multiple perspectives.
The data collection tools will be designed considering the major ethical principles of research conduct. It is important to provide the complete information about the purpose of the experiment to the participants to get their consent. In this way, the researchers act according to the principle of voluntary participation (Trochim, 2006). The conduction of experiments without the consent of the individuals may be regarded as a violation of the ethical code. It is also important to use the personal information confidentially and avoid its disclosure without permission (Beskow, Dame, & Costello, 2008).
Data Analysis
The analyzed BI system was used in UAE Traffic Department to operate, arrange, and locate the massive influx of data. The system was used by the employees on the everyday basis to fulfil various tasks such as reporting, presentation, and sharing data.
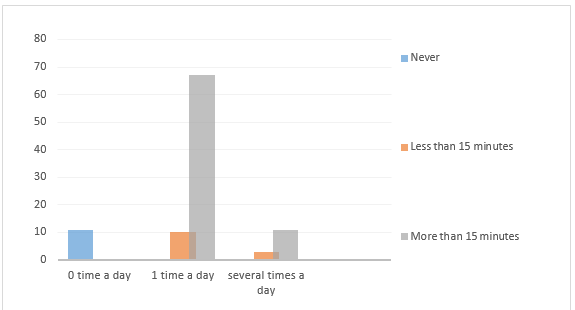
The study results demonstrate that out of 102 sample participants only 11 employees do not apply BI software while 77 employees reported that they use the system at least once a day, and 14 people implement it several times a day. About 20% of participants spend more than 15 minutes working with BI Software (Figure 1). And over 70% of the respondents spend less than 15 minutes applying the system.
It is possible to say that the frequency of use largely depends on the level of access to information. Most of the employees have access to the basic functions of the software, such as reporting and data collection. As a result, some of the respondents do not find it necessary to use BI software and never apply it. At the same time, the employees who have a higher level of access to the information are characterized by frequent use of BI system.
Over 85% of users found that the applied BI system is easy to use, and gave its quality the high scores. The majority of respondents perceived the ability to access the information easily, the immediate response of the program, and its interface as the positive factors influencing the overall quality of BI in a good way. The complex part of the programs implying the interpretation of the represented data required the specific training and, as a result, the System Quality was negatively perceived by some interviewees (n=14).
Overall, System Quality may be regarded as good, but it still has the potential to be enhanced. The organizational management may correlate the information access with the provision of knowledge about the program data sources, its origins, effects, etc. to give the employees opportunity to increase their competence in BI application in a more effective way.
Information Quality has the highest value among the estimated factors (Figure 2). The interviewees positively assessed the sufficient amount of the information, and its orientation to the fulfilment of particular tasks. BI data is associated with a high level of reliability and accuracy that lead to the valid interpretation of information and positively affect decision-making.
It is possible to assume that the System and Information Quality indicators are directly correlated with the frequency of BI system use. A high level of trust in the provided information increases the positive perception of the software and results in the application time increase.
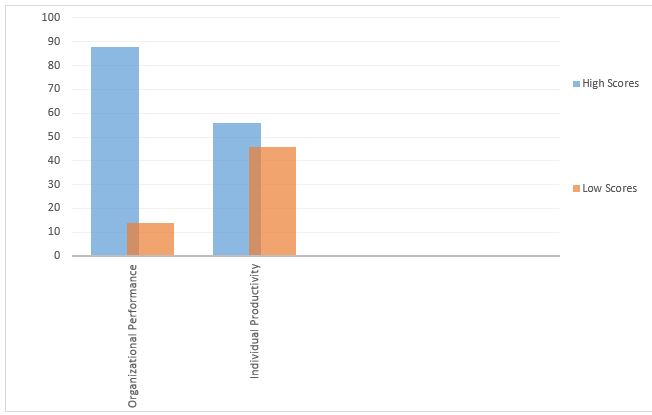
56 participants found that BU system positively affects the individual working productivity while 46 employees didn’t find a significant difference. It was observed that BI primarily impacted individual productivity in planning, sharing information, reporting, and data organization (Appendix 2). At the same time, the informational basis that supports organizational data analysis and decision-making may be regarded as relatively good. Overall, it is possible to say that the Information or System Quality and User Satisfaction indicators impact the individual efficiency demonstrated in the study results.
The impact on the overall Organizational Performance was assessed positively by 88 participants. BI implementation is strongly connected to the cost efficiency increase, and the software application has the major positive impact on the financial and HR departments. Unfortunately, at the current stage of the system application, it is hard to estimate the total savings caused by the BI introduction, but it is expected that the future estimation will show a significant positive result. Nevertheless, most of the study participants believe that the adoption of BI system at the working site has already paid back in the organizational performance improvement.
Interpretation of Results
Overall, the value of the systematic and informational quality, user satisfaction, individual productivity, and organizational efficiency are acceptable. The correlations with the System Quality and Usage Time were found in the study, and the improvement of knowledge management in employee training may have a good impact on the usage frequency and time increase in the future.
The good quality of information was associated with the efficiency of decision-making, and the majority of the participants also noticed a positive influence of BI implementation on the organizational performance. Therefore, the hypothesis about the favourable effect of BI software implementation on working productivity and efficiency found evidence.
Ethical Considerations
The data collection tools were designed and implemented to evaluate the effectiveness and efficiency of BI System application in the randomly selected UAE police office. The items included and assessed in surveys may be regarded as the representative indicators of BI impacts (Moskovitz, & Even, 2014). The tools were designed considering the principles of voluntary participation, informed consent, and confidentiality.
According to other ethical principles the researchers need to reduce the possibility of harm and negative influencing on the participants not merely in terms of physical well-being but in terms of psychological state and social identity as well (Trochim, 2006). However, this principle is irrelevant to the current study methods because the assessed information addresses impersonal characteristics and cannot damage participants.
Conclusion
The objective of the study was the identification of actual effects of BI systems on organizations and individuals. The study was conducted to answer the following questions: whether the integration of BI systems in the police working process impacts the data organization in a positive way? May BI software increase the working productivity and efficiency?
Based on the assessment results, it is possible to say that BI systems application may be considered successful. However, there are still some problems that should be targeted in order to make BI system integration more effective. The extension of free access opportunities for a broader group of organizational positions may significantly increase user satisfaction and frequency of BI use. Nevertheless, the findings demonstrate that the quality of the system itself has a high value, and the improvements should take place primarily within the organizational context.
References
Agiu, D., Mateescu, V., & Muntean, I. (2014). Business Intelligence overview. Database Systems Journal, 5(3), 23-36.
Beskow, L. M., Dame, L., & Costello, E. J. (2008). Certificates of Confidentiality and Compelled Disclosure of Data. Science, 322(5904), 1054–1055. Web.
Brown, B., & Hedges, D. (2009). Use and misuse of quantitative methods: Data collection, calculation, and presentation. In D. Mertens, & P. Ginsberg (Eds.), The handbook of social research ethics. (pp. 373-387). Thousand Oaks, CA: SAGE Publications, Inc.
Carlsson, S., Skog, L., & Tona, O. (2010). The success of a business intelligence system in a police organization: An evaluation study. Web.
Collins, A., Joseph, D., & Bielaczyc, K. (2004). Design research: Theoretical and methodological issues. Journal of the Learning Sciences, 13(1), 15.
Creswell, J. (2003). Research design: Qualitative, quantitative, and mixed methods approaches. London, UK: Sage Publications.
Leat, V. (2007). IBM Software Group: Introduction to Business Intelligence. Web.
Morgan, G., & Smircich, L. (1980). The case for qualitative research. Academy of Management. The Academy of Management Review, 5(4), 491. Web.
Moskovitz, E., & Even, A. (2014). The Impact of a BI-Supported Performance Measurement System on a Public Police Force. International Journal of Business Intelligence Research (IJBIR), 1(5), 13-30. Web.
Nelson, G. (2008). Introduction to the SAS® 9 Business Intelligence Platform: A tutorial. Web.
Nolan, B. (2012). Intelligence analyst training expanded to serve other areas. Dayton Daily News. Web.
Oyeyemi, G. (2010). Complex survey data analysis: A Comparison of SAS, SPSS and STATA. Asian Journal of Mathematics & Statistics, 3(1), 33-39.
Ranjan, J. (2005). Business intelligence: Concepts, components, techniques and benefits. Web.
Trochim, W. M. K. (2006). Ethics in Research. Research Methods Knowledge Base. Web.
Appendix A: Instruments of Data Collection
This survey is a part of an academic assignment. The information provided by you will be kept confidential and will be used for academic/research purpose only.
Questionnaire
- What is your age?
- What is your gender?
- Male.
- Female.
- Do you apply BI software at work?
- Yes.
- No.
- How often do you use BI System?
- At least one time a day.
- More than one time a day.
- For how long do you use BI System a day?
- Less than 15 minutes.
- More than 15 minutes.
- How would you assess System quality?
- High.
- Low.
- How would you assess information quality?
- High.
- Low.
- Does System application impact your working productivity in a positive way?
- Yes.
- No.
- Does it have a favorable influence on the organizational performance?
- Yes.
- No.
- How would you assess your overall satisfaction with BI System application?
- Positive.
- Negative.
Survey
Appendix B: Tables of Findings
Questionnaire
Sample: N=102 Average age of study participants: 29.
Survey
Sample: N=91 (Excluding 11 participants who never use BI System at work)