Introduction
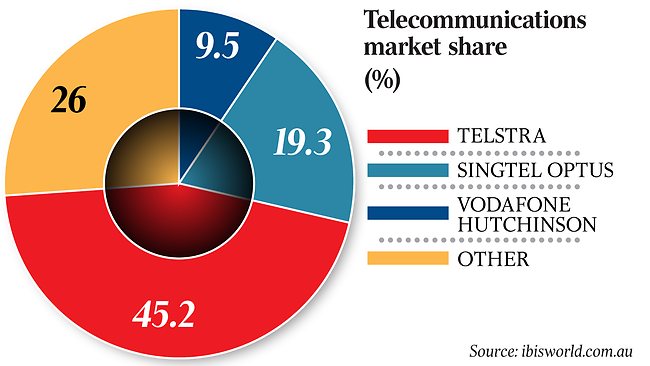
Telstra and Vodafone are public limited companies in Australia. Both companies generate most of their income from the telecommunication industry in Australia. Both companies provide mobile and data communications services in Australia. Moreover, they own shares in subsidiaries across their respective geographical segment. Both companies pride themselves on their outstanding performance over the years. In the modern technology-driven business environment, today both companies have invested massive resources in research and development. Telstra’s market share represents 45 percent of the total market share. However, Vodafone has lost its market share over the years to about 9.5 percent in 2014.
Telstra Company Background
Telstra Company was founded in 1901 when the postmaster general was being established by Commonwealth in Australia. Telstra Corporation is a public limited data and telecommunication company in Australia. According to Hoffman (2012), it is one of the biggest data and telecommunication companies that employ more than 34,000 employees. It is listed in both Australia and New Zealand stock exchanges under the code TLS. The company provides long-distance calls, mobile, and internet services locally. It is estimated to operate over 3.5 million broadband subscribers and also provides necessary access to homes and businesses. The company has gained a competitive advantage over its rival Vodafone by targeting 4G LTA mobile phone users taking advantage of the growing need for internet connection in Australia.
In December 2014, Telstra acquired Asian-based undersea cable network operator Pacnet for an estimated value of $856 million. This acquisition is expected to support continued growth and expansion in the region. In the same year, Telstra had acquired a similar US-based video streaming company for $270 million. However, the company has faced stiff competition in the US private equity industry leading to the sale of Platinum Equity for $454 million. Moreover, in December 2013 the company sold its New Zealand wholly-owned subsidiary to Vodafone. Although Telstra is facing stiff competition in the telecommunication industry, it has sustained growth in the last five years.
A Snapshot of Telstra today
Telstra is a Public limited company based in Australia. The company is ranked at number 9 out of 2000 companies in Australia in terms of revenue and stock valuation. Its primary source of income is generated mainly from telecommunications services. The company made 26.5 billion in revenue including sales from other sources in 2014. The company has more than 34,000 employees including all its subsidiaries companies under its control. Telstra shares closed at $6.45 in February 2015 which represented a 0.6 decline compared to January. However, analysts believe that Telstra shares will regain after two months. The company reported a 22.1 percent increase in profit-driven by the mobile division that had $2.1 billion profit after tax. The company increased its dividends by half a cent in 2015 which was lower than the last two years. Telstra is attracting an enormous number of investors not because it represents a healthy growth rate, but because the firm pays high dividends.
The global financial crisis has negatively impacted Telstra. For instance, the company expected to increase its broadband network in the capital cities by $5 billion. However, due to the drop in the foreign exchange rate during the crisis, the company used $15 billion which had to be outsourced from lenders. Nonetheless, the company has recovered, and it continues to generate positive revenue despite challenges as a result of the crisis.
Vodafone Company Background
Vodafone Hutchison Australia Pty Company is an Australian telecommunication company. It is headquartered in North Sydney, New South Wales. The company operates under the two-band name; Vodafone Australia and Crazy John’s. Vodafone Hutchison is a result of a merger between Hutchison 3G Australia and Vodafone Australia. The company has more than 7 million subscribers and generates more than $4 billion in annual revenue. Vodafone Hutchison has a 9.5 percent market share making it the fourth-largest telecommunication in Australia.
The company is owned on a 50-50 basis by Hutchison Whampoa and Vodafone Group of enterprises. The company was formed in June 2009 to become Vodafone Hutchison. The company is facing stiff competition from its main rival Telstra which has more than 40 percent market share. Vodafone Hutchison is targeting more than $4.5 billion small to medium business market to improve revenue generation.
The company expects to offer 4G services in this market segment aimed at increasing revenues and the number of subscribers. Liu and Liang (2015, p. 1020) take the stance that Vodafone Hutchison reported a total loss of $603.6 million in 2014. Moreover, the company reported an additional loss of 46,000 mobile subscribers. The CEO noted that the company had lost $301.8 million in net revenues compared to $208.2 million in 2013.
A Snapshot of Vodafone Hutchison today
Vodafone Hutchison Australia reported a 1.6 percent decrease in total revenue from $3.55 billion in 2013 to $3.49 billion in 2014. Managers believe the decline in revenue was caused by an enormous loss in its customer base coupled with the falling mobile termination rates. According to Kolk (2014), Vodafone lost an estimated 46,000 customers while its main rival Telstra reported an increase in customer base to 16.4 million subscribers and made $10.13 billion in total revenue. Vodafone’s market price per share is $5.5, but investors believe it will decline as investors lose confidence in the company.
Quantitative analysis
This section critically analyzes Telstra and Vodafone Hutchison’s 2014 consolidated financial statements to help investors make sound investment decisions. The ratios used are liquidity ratios, profitability ratios, debts, and investment ratios. Moreover, this report makes a recommendation to investors on the best company to invest in. However, investors must bear in mind that investment is a personal decision based on a personal evaluation of risk and investment profile (Jose & Lee 2007, p. 310).
Qualitative aspects of a firm are measured using ratios analysis. Financial ratios are more convenient and easier to interpret than financial statements (Belkaoui 2013, p. 128). Creditors are interested in ratios that measure the short-term liquidity of a firm to ensure an organization will be able to pay both interest and principal. More so, creditors are interested in a company’s profitability as an assurance that the business is healthy and will continue to make profits. For instance, an investor would be unwilling to invest in Vodafone since it has been making losses in the last three years. According to Roca and Searcy (2014), Vodafone had a net loss of $301.8 billion while Telstra had a net profit of $10.5 billion in total revenue. However, investors are interested in ratios that measure the firm’s current and future level of risk and return. Specifically, Titus, Covin
and Slevin (2011) argue that investors are interested in ratios that measure the degree of performance in the long run since it has a direct impact on share prices.
Current Ratio
This ratio indicates the number of times the current asset can cover current liability. In simple terms, it shows the number of current assets for every $1 of current liability. Grammig and Peter (2013) posited that current ratios measure the ability of a firm to precursor to financial distress or potentially going into bankruptcy.
Telstra current ratio
Telstra current ratios increased from 2013 to 2014:
Vodafone current ratio
From the ratios above, it is evident that Telstra is more liquid than Vodafone Hutchison. It is generally assumed that a current ratio of 2:1 is ideal which means current assets should be at least twice current liability(Qiao & Sun 2014, p. 4785). Vodafone has a current ratio of less than one which indicates the firm is facing liquidity problems. Vodafone liquidity ratios have declined from 1.04 to 0.7 compared to Telstra, which has gained liquidity from 1.1 to 1.2. Vodafone has been losing market share over the last three years is attributed to the loss of market share (Patten 2014, p. 768). Vodafone Hutchison reported an additional loss of 46,000 subscribers in 2014. The loss of market share has been the key driver attributed to reported loss over the last three years. On the contrary, Telstra has gained market share over the last five years. Telstra reported a 22.1 percent increase in the number of subscribers that has a direct impact on positive liquidity (Hajer & Versteeg 2015, p. 180). Vodafone had to sell some of its assets to improve liquidity since the company has been reporting losses in the last three years. In fact, the company’s asset declined from $1,294,466 to $926,769. On the contrary, Telstra has enough resources that have enabled the company to acquire other firms in 2014. For instance, in December 2014, Telstra acquired Asian-based undersea cable network operator Pacnet for an estimated value of $856 million. The changes are directly evident from the increase in total assets from $7,903,000 in 2013 to $10,438,000 in 2014.
Acid test ratio
Liquid assets = Current Assets- inventory – prepaid expense
When measuring acid test ratios, the most liquid asset does not include stocks because stocks are less liquid, and their price is not constant. On the other hand, prepaid expenses cannot be realized by a firm hence it is subtracted from liquid assets (Holden 2014). The higher the ratio, the more a firm is liquid in the short term. A quick ratio of 1:1 is considered standard and a safe ratio in the short term. This ratio measures the ability of a firm to pay its current liability from the most liquid assets of a company (Megginson, Smart & Lucey 2008). The ratio above shows that Vodafone’s current liability is more than current assets hence the company cannot be able to pay current obligations from its most liquid assets. On the contrary, Telstra has a positive 1.16 acid test ratio meaning the company can adequately meet its current liability from the most liquid asset of a firm. Cagle, Campbell, and Jones (2013) noted that Vodafone’s liquidity is below the industrial standard of 1:1 which means the company is highly vulnerable and can potentially go into bankruptcy.
Price earning ratio
Price earning ratio measures the relationship between stock prices and company earnings. The price-earning ratio of Telstra is $18.58 higher than that of Vodafone of $2.9 which indicates investors have confidence in this stock and have high hopes for future growth. Conversely, a low P/E ratio of Vodafone indicates ‘a vote of no confidence which suggests investors have lost confidence in these stocks (Esteki et al. 2015).
Other financial ratios
From the ratios above, it is can be said that both companies experienced significant growth in terms of EBITDA and sales revenues. However, Vodafone’s total assets declined by -1.5 percent due to liquidity challenges that have compelled the firm to sell some of its assets to generate operating cash flows. As postulated by Brock (2014, p. 121) Telstra acquired Asian-based undersea cable network operator Pacnet and a US-based video streaming company that increased total assets significantly. Vodafone shareholders’ funds were reduced significantly since the parent company (Vodafone Group Plc) announced they would return an estimated $85 billion shareholder funds in 2014.
Conclusion
Telstra and Vodafone operate in the Australian telecommunication industry. In fact, both companies obtain most of their revenue from telephone charges. Vodafone has been facing stiff competition that has led the firm to report losses in the last three years. However, Telstra has gained significant market share and revenue over the last four years due to exceptional services. Vodafone is facing liquidity challenges that have compelled the firm to sell some of its assets to improve liquidity. It has a fragile current ratio of 0.7 which indicates the firm cannot be able to pay its current liability from its current assets. In fact, in 2014, current liability is almost twice the current asset. Conversely, Telstra has a positive current ratio of 1.2 which is higher than the industry average of 1. In summary, Telstra has a stable financial position compared to Vodafone, which has a negative cash flow.
Recommendation
Investors consider many factors before deciding to invest in any company. In the telecommunication industry, pricing decisions are vital in determining the success of an enterprise. These are complex decisions companies have to make since they determine which products consumers prefer to buy. Telstra has achieved dramatic success due to its ability to provide excellent customer services. In a survey conducted in 2014, Telstra scored 99 percent in the capacity to connect and avoid dropout. Moreover, the company has invested in 4G technology where it scored 98.5 percent compared to its main rival Vodafone Hutchison which had 66.3 percent. That is why Telstra has remained profitable in the last four years. Moreover, Telstra has invested enormous resources in research and development. In fact, Telstra plans to spend $100 million in research and development in 2015 alone. If Telstra manages to develop a unique product, it could leverage its investment in technology by over $2 billion which will increase sales and share price of the next five years. Moreover, investors consider the competitiveness of a firm in the global marketplace. Telstra has done exceptionally well, in 2014; the company generated almost $4 billion free cash flow.
Competitive companies must have huge cash flow reserves to invest in future research and development. Though Telstra free cash flow has significantly increased to $4 billion, the market price per share declined by 0.6 percent to 6.45 in March 2015. These changes are due to massive investments in research and development which presents a buying opportunity for investors. Moreover, Telstra shares are trading at fully “franked dividends” than Vodafone, which does not pay dividends. In fact, Telstra shares have a trailing dividend yield of 5.3 percent. Although the CEO is pessimistic that growth will slow in the near future, Telstra’s plan to roll out the largest wireless network connection will likely even attract more customers. Telstra also plans to acquire a telecommunication firm in Asia with an aim of increasing revenue from Asia by 2020. Although acquiring new companies in Asia establishes new risks, it also opens a new array of investment opportunities to boost the growth rate. Therefore, investors should consider investing in Telstra over Vodafone Hutchison.
References
Belkaoui, A 2013, ‘Financial analysis and the predictability of important economic events,’ Journal Of Financial & Quantitative Analysis, vol. 48, no. 2, pp. 125- 146.
Brock, W 2014, ‘A Study of Prices and Market Shares in the Computer Mainframe Industry: Comment’, Journal Of Business, vol. 52, no. 1, pp. 119-124.
Cagle, C, Campbell, S, & Jones, K 2013, ‘Analyzing Liquidity: Using the Cash Conversion Cycle’, Journal Of Accountancy, vol. 215, no. 5, pp. 44-48.
Esteki, M, Poorali, B, Adib, E, & Farzanehfard, H 2015, ‘Interleaved Buck Converter With Continuous Input Current, Extremely Low Output Current Ripple, Low Switching Losses, and Improved Step-Down Conversion Ratio’, IEEE Transactions On Industrial Electronics, vol. 62, no. 4769- 4776.
Grammig, J, & Peter, F 2013, ‘A New Approach to Estimating Unique Market Information Shares’, Journal Of Financial & Quantitative Analysis, vol. 48, no. 2, pp. 459-488.
Hajer, M, & Versteeg, W 2015, ‘Special Issue: Does discourse matter? Discourse, power and institutions in the sustainability transition’, Journal of Environmental Policy & Planning, vol. 7, no. 5, pp. 175-184.
Hoffman, J 2012, ‘The role of the competitive environment in studies of strategic alignment: a meta- analysis’, International Journal of Production Research, vol. 50, no. 2, pp.567-580.
Holden, L 2014, ‘Fording the Atlantic: Ford and Fordism in Europe, Business History,vol. 4, no. 7 , pp.122-127.
Jose, A, & Lee SM 2007, ‘Environmental Reporting of Global Corporations: A Content Analysis Based on Website Disclosures,’ Journal of Business Ethics, vol. 7, no. 2, 307-321.
Kolk, A 2014, ‘Trends in sustainability reporting by the fortune global 250. Business Strategy and the Environment’, Journal of Business Ethics, vol. 12, no. 5, pp. 279–291.
Liu, Y, & Liang, L 2015, ‘Evaluating and developing resource-based operations strategy for competitive advantage: an exploratory study of Finnish high-tech manufacturing industries’, Internation Journal Of Production Research, vol. 53, no. 4, pp. 1019-1037.
Megginson, W., Smart, S, & Lucey, B 2008, ‘Introduction to Corporate finance,’ Cengage Learning EMEA. London, pp.189-201.
Patten, DM 2014, ‘The relation between environmental performance and environmental disclosure: a research note. Accounting’, Organizations and Society, vol. 2, no. 7, pp. 763-773.
Qiao, N, & Sun, P 2014, ‘Study of improved Otsu algorithm and its ration evaluation analysis for PCB photoelectric image segmentation, Optik – International Journal For Light & Electron Optics, vol. 12, no.5, 17, pp. 4784-4787.
Roca, LC, & Searcy, C 2014, ‘An analysis of indicators disclosed in corporate sustainability reports;’ Journal of Cleaner Production, vol. 20, no. 2, pp. 103 118.
Titus, V, Covin, J, & Slevin, P 2011, ‘Aligning strategic processes in pursuit of firmgrowth’, Journal of Business Research, vol. 64, no. 5, pp. 446-453.