Introduction
The Cheesecake Factory is a restaurant company headquartered in California, the United States (“The Cheesecake Factory Annual Reports” par. 1). In order to analyze the company’s ratios and efficiency in terms of planning operations, using assets, and leveraging the equity, it is necessary to apply the DuPont analysis. This financial analysis is based on calculating the return on equity (ROE) for the company (Bauman 193). However, ROE used in the DuPont analysis depends on such three parameters or aspects as Profit Margin, Asset Turnover, and Financial Leverage or Equity Multiplier (Herciu, Ogrean, and Belascu 19). The separate analysis of each component is effective to demonstrate the tendencies and problem areas in the company’s performance.
In order to conduct the DuPont analysis and focus on ROE for the Cheesecake Factory during the recent five years, it is necessary to apply the following formula:
ROE = Net Profit Margin x Asset Turnover x Financial Leverage = Net Income/Sales x Sales/Total Assets x Total Assets/Total Equity = Net Income/Total Equity
The income statements, balance sheets, and cash-flow statements available in annual reports of the Cheesecake Factory include the required information in order to calculate ROE according to the principles of the DuPont analysis (“The Cheesecake Factory Annual Reports” par. 1-6). Table 1 demonstrates the data on ROE, ROA, Profit Margin, Asset Turnover, and Equity Multiplier for the period of 2011-2015 received after calculating the ratios according to the discussed formula. Thus, the additional ratio that should be calculated for the further analysis is the return on assets (ROA). ROA is calculated using the following formula:
ROA = Net Income/Sales x Sales/Total Assets = Profit Margin x Asset Turnover
ROA is also related to ROE with references to the following formula:
ROE = Net Income/Total Assets x Total Assets/Total Equity = ROA x Equity Multiplier
Table 1. ROE, ROA, and Equity Multiplier, 2011-2015.
While referring to the data presented in Table 1, it is important to conduct the separate analysis of components and design graphs in order to understand the tendency in the company’s performance during five years.
Return on Equity (ROE)
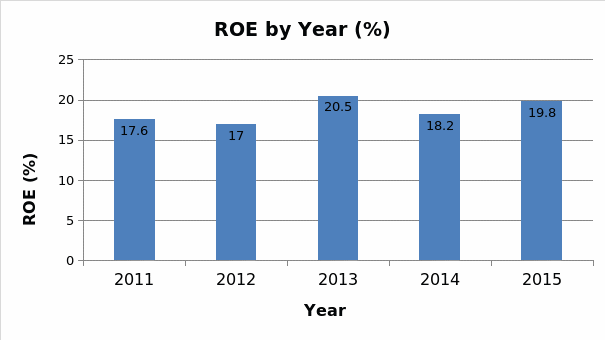
In 2013, the rise in ROE was observed in comparison to the data for 2011-2012 (Figure 1). However, in 2014, there was a decline that was overcome in 2015 when ROE became 19.8%. Such changes in ROE indicate that the company used different approaches to increase the return on equity in 2011-2012, 2013, and then, in 2014 and 2015. The further detailed analysis of ROE components is required. However, it is possible to state that ROE that equals 15-20% is regarded as attractive for investors (Sheela and Karthikeyan 86). From this point, the position of the Cheesecake Factory in the market was rather high during the discussed five-year period, and the tendency to raise returns is observed.
Return on Assets (ROA)
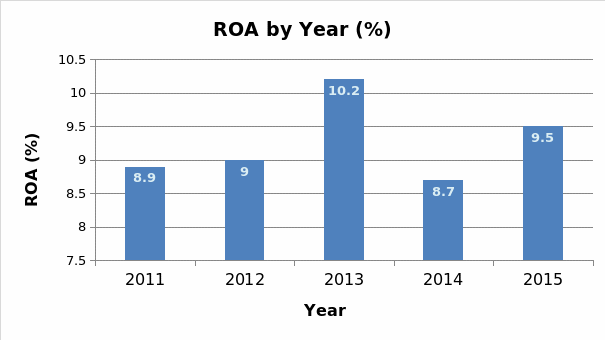
Differences in the company’s strategies to use assets and resources are also observed with references to the ROA ratio. ROA is important to explain whether the managers’ decisions regarding assets are appropriate and efficient in order to discuss the company’s assets as profitable and attractive to investors (Curtis, Lewis-Western, and Toynbee 1215). In the case of the Cheesecake Factory, the lowest ROA was typical of 2014 (Figure 2). However, it was higher than the market’s average. ROA that is higher than 5% is usually discussed as acceptable. The analysis indicates that the most efficient decisions were made in 2013, but in 2014, the company suffered from the decline in operations. Therefore, the ratios related to returns were comparably low. Still, in 2015, the situation improved.
Profit Margin
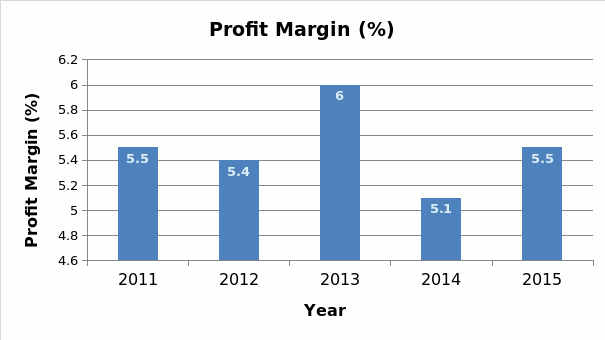
Profitability of the Cheesecake Factory is measured with references to the analysis of Profit Margin (Bauman 194). Figure 3 indicates that significant fluctuations in Profit Margin were not typical of the company, but the growth of Profit Margin in 2013 was followed by the significant decline in 2014. The situation was stabilized in 2015, and Profit Margin for this year equals 5.5%. For the restaurant industry, this margin is average, but it is also possible to achieve the higher profit margin while modifying the operations, decreasing costs, or increasing sales (Guillet 341).
Asset Turnover
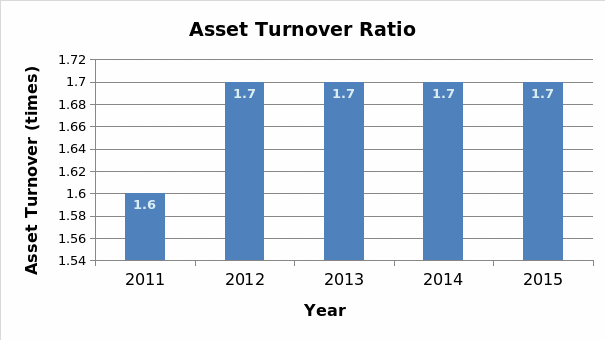
The efficiency in using assets is measured with references to the Asset Turnover ratio. Figure 4 indicates that the ratio was stable for four years. The data demonstrate that for each dollar spent on assets, the Cheesecake Factory generated $1.7, and this measure can be regarded as positive. Thus, the Asset Turnover ratio that is higher than 1 usually demonstrates the positive tendency in utilizing available resources (Herciu, Ogrean, and Belascu 20).
Financial Leverage
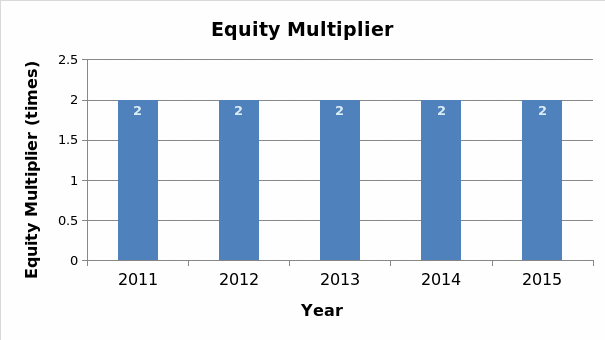
The Financial Leverage ratio related to the Cheesecake Factory’s performance during five years equals 2 (Figure 5). It means that the company uses the equity in order to finance 50% of the assets. The other 50% of expenses are financed by debt. It is possible to state that the company follows a strategy of balancing the use of debt and equity in order to finance the assets (Sheela and Karthikeyan 87). As a result, the risks are controlled because of the limited dependence on debt.
Conclusion
The results of the DuPont analysis indicate that in order to guarantee the further increase of ROE, it is necessary to utilize the assets more efficiently. It is possible to contribute more to generating the sales revenues while changing the Asset Turnover ratio. Furthermore, while improving the use of assets and maintaining the high Asset Turnover ratio, it is possible to reduce costs. As a result, managers can expect more profits, as well as associated changes in the Profit Margin ratio. From this perspective, the Cheesecake Factory requires the more significant reinforcement of its operations. While analyzing the data, it is possible to state that changes in using assets will lead to positive profits quicker than the focus on increasing sales. Therefore, the primary goal is to increase ROA and the Asset Turnover ratio. This strategy can be discussed as appropriate for the restaurant industry where the increases in sales depend on the implementation of complex marketing strategies that require the time and resources.
Works Cited
Bauman, Mark. “Forecasting Operating Profitability with DuPont Analysis: Further Evidence.” Review of Accounting and Finance 13.2 (2014): 191-205. Print.
Curtis, Asher, Melissa Lewis-Western, and Sara Toynbee. “Historical Cost Measurement and the Use of DuPont Analysis by Market Participants.” Review of Accounting Studies 20.3 (2015): 1210-1245. Print.
Guillet, Basak Denizci. “CEO Duality and Firm Performance in the US Restaurant Industry: Moderating Role of Restaurant Type.” International Journal of Hospitality Management 33.1 (2013): 339-346. Print.
Herciu, Mihaela, Claudia Ogrean, and Lucian Belascu. “A DuPont Analysis of the 20 Most Profitable Companies in the World.” Group 13.58 (2011): 18-93. Print.
Sheela, Christina, and Kal Karthikeyan. “Financial Performance of Pharmaceutical Industry in India using DuPont Analysis.” European Journal of Business and Management 4.14 (2012): 84-91. Print.
The Cheesecake Factory Annual Reports. 2016. Web.

