A business incurs two types of costs including fixed costs and variable costs. Fixed costs do not change with changes in the production level. On other hand, variable costs change with the level of production (Hansen, Mowen and Guan 586). In the case of the Fly Ash Brick Project, fixed costs and variable costs are identified in the following table.
Total Fixed Costs
Total fixed costs include depreciation expense, interest expense, salaries, and other fixed costs (Tracy 237). These are determined for calculating the break-even level of production.
Depreciation per year
Initial Investment = Rs. 8,000,000
Project Life = 5 years
Depreciation Expense = 8,000,000/5 = Rs. 1,600,000
Interest payment
Loan amount = Rs. 4,000,000
Interest charge = 12%
Interest expense = 4,000,000 x 12/100 = Rs. 480,000
Sharma’s salary per year
Salary per month = Rs. 50,000
Salary per year = Rs. 50,000 x 12 = Rs. 600,000
Administrative salary per year
Administrative salary per year = 12 x 160,000 = Rs. 1,920,000
Other Fixed Costs
Other Fixed Costs per year = 12 x 95,000 = 1,140,000
Total Fixed Cost = 1,600,000 + 480,000 + 600,000 + 1,920,000 + 1,140,000 = Rs. 5,740,000
Total Variable Cost = 250,000 + 250,000 + 300,000 + 40,000 +10,000 + 50,000 = Rs. 900,000
Variable Cost per Brick = 900,000/2,000,000 = Rs. 4.5
Selling Price = Rs. 7
Contribution Margin = 7 – 4.5 = Rs. 2.5
Break-Even Point (BEP) = Fixed Costs / Contribution Margin (Warren, Reeve and Duchac 141).
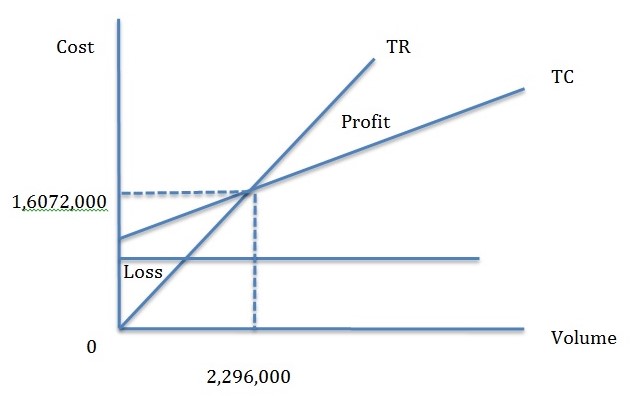
Break-Even Point (Qty.) = 5,740,000/2.5 = 2,296,000
At Break-Even Point, total revenues are equal to the total costs of the business. There is no profit or loss if the business produces 2,296,000 bricks. If the business sells more than 2,296,000 bricks per year, then it will generate profit. Otherwise, the business will incur a loss. The break-even point is presented in the following graph.

It could be indicated that the manager’s decision to produce 2,400,000 fly ask bricks per year is supported by the break-even analysis. As the expected production level is higher than the break-even point, it is feasible for the company to accept the current production structure.
Target Income = Rs. 2.5 million
The following formula is used to determine the number of bricks to be produced to generate the target income of Rs. 2.5 million.
Profit = P x Q – V x Q – FC
2,500,000 = Q (7-4.5) – 5,740,000
Q = 8,240,000/2.5 = 3,296,000
A business needs to generate a high return on shareholders’ equity that could be achieved by improving business strategies (Stowe 172). In the given case, the management can take decisions regarding the number of fly ash bricks to be produced per annum. The return on equity is calculated by using the following formula.
ROE = Net Profit / Shareholders Equity
Where,
- Net Profit = Revenues – Variable Cost – Fixed Cost = P x Q – VC x Q – FC (Albrecht, Stice and Stice 679).
If the production quantity changes, then the net profit of the business also changes. The changes in ROE are indicated in the following by considering different quantities of production.
The table indicates that the return on equity increases when the production/sales of the company increase. The highest ROE is obtained when 5,000,000 fly ash bricks are produced.
Based on the analysis, it is recommended that the business should at least produce 2,296,000 bricks to break even. The management estimated cost figures based on the production level of 2,000,000 bricks per annum. The break-even point is higher than the estimated production level. Therefore, the company will be required to increase its production. If the production level increases then, the management must reconsider their cost estimates. If the business uses more resources to meet its production requirements, then these costs estimations can change. The analysis also indicates that the company can achieve a profit of Rs. 2.5 million by producing 3,296,000 fly ash bricks per year. The analysis indicates that the company can generate a high return on equity for its shareholders if the production level increases. There is a direct relationship between costs, profit, and return on equity (Drury 181). Although the market conditions are favorable, the management must be prepared to respond to any changes in the government regulations related to the environment. The government can impose high tariffs on the production of bricks that will change the outlook of the business.
Works Cited
Albrecht, W. Steve, Stice, James D., Stice, Earl K. and Swain, Monte R. Accounting: Concepts and Applications, Mason, Ohio: Cengage Learning, 2007. Print.
Drury, Colin. Management and Cost Accounting, Mason, Ohio: Cengage Learning EMEA, 2007. Print.
Hansen, Don, Maryanne Mowen and Liming Guan. Cost Management: Accounting and Control, Mason, Ohio: Cengage Learning, 2007. Print.
Stowe, John D. Equity Asset Valuation, New York, NY: John Wiley & Sons, 2007.
Tracy, John A. Accounting Workbook For Dummies, New York, NY: John Wiley & Sons, 2011. Print.
Warren, Carl, James Reeve, and Jonathan Duchac. Managerial Accounting, Mason, Ohio: Cengage Learning, 2015. Print.

