Introduction
To a great extent, the administrative authorities are responsible for managing the available resources to cater to the civilian’s needs. Generally, governments gather levies as revenues and design budgets to assist them in the collected resources management. A financial condition is an event whereby a directorate can balance annual recurring expenditures with revenues to enable a given city to offer required services regularly (Mikesell, 2018). The financial statements typically provide a crucial monetary database concerning a particular entity. The bible requires all leaders of public institutions to uphold core values of transparency and honesty, as Moses did while managing his in-law’s wealth (Schellekens, 2022). As a result, Maumelle’s managers must do what is necessary to ensure that all the firm resources are accounted for and used appropriately. The assessment of Maumelle’s financial statements will aid the stakeholders in comprehending the organization’s financial condition.
Fiscal Condition Analysis of Maumelle, Arkansas
At first, Maumelle city is situated in America, hosting individuals from diverse regions. It has competent personnel and operating infrastructure to improve the locals’ lives. The primary revenue source for the city includes taxes, which help reinforce operations. Several levies types can be imposed on humans, and the rates to be deployed rely on multiple elements that the company wants to achieve over a given period. Public administrative agencies are mandated to provide services without considering whether there are profits or not (Mikesell, 2018). When the losses are realized, different parties must bear the cost as the services should be offered. Maumelle requires to have a budget that assists them plan for the raised revenue and aligning them with the expenses that demand to be settled.
Assessment of Expenditures and Revenues Data of Maumelle and Charts
Total Revenues
As the city’s population expands, it is projected that the demand for service delivery will escalate in a direct correlation. The revenue per household level must remain constant or, at minimum, be equal to each family’s operating expenditures (Lorig, 2018). When the operating expenditures outweigh the available revenue, it deters Maumelle from sustaining the existing scope of services unless new methods of cutting costs or other sources of revenue generation are established. Maumelle city has a warning trend of decreasing the total revenue per household. The city’s revenues and expenditure data are as follows:
Table 1: Total Revenues Per Household
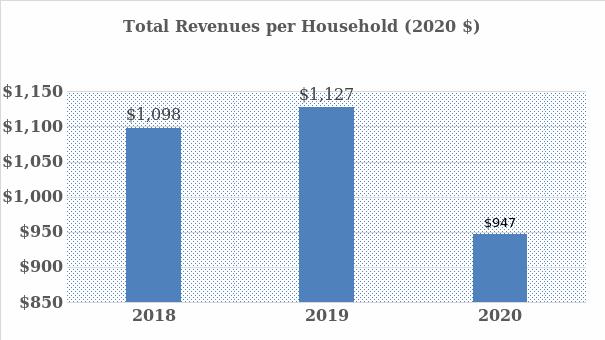
Figure 1: Bar Chart of Total Revenues Per HouseholdSignificantly, revenues manifest the cash inflows recorded from diverse sources owned by a firm. The total revenue per household slightly increased from $1098 in 2018 to $1127 in 2019. Such an increasing trend can be attributed to revenue collection in Maumelle. The company has several streams for generating revenue to ensure efficient service delivery to its locals. The small revenue margin revenue escalation is due to the Maumelle’s different streams, including grants and donations and public, the municipal courts, and public safety (Lorig, 2018). Multiple revenue sources are essential for the city as it assists in minimizing the dangers related to the high dependability of a single stream, which can impede them from countering unforeseen events. At the same time, the 2020 revenue per household stood at $947. Between 2019 and 2020, the net operating revenues in each family slightly declined, which can deter Maumelle’s ability to maintain its services due to escalated populace. Therefore, city leaders must find ways to reduce expenditures or generate more revenue.
Property Tax Revenue
The value of commercial and residential property drives the local property revenues, whereby the Maumelle authority determines the tax bills by examining the levy based on the asset’s worthiness. Significantly, the tax collections and property bills reflect the value of the assets from twelve to eighteen months before, since local examination takes a prolonged period to match with changes (Militaru & Stratmann, 2018). Deterioration in new development, transferring taxable property to levy-exempt entities, and a general asset value decline spearheaded the negative growth trend of property tax revenues, which can harm Maumelle.
Table 2: Bar Chart of Property Tax Revenue
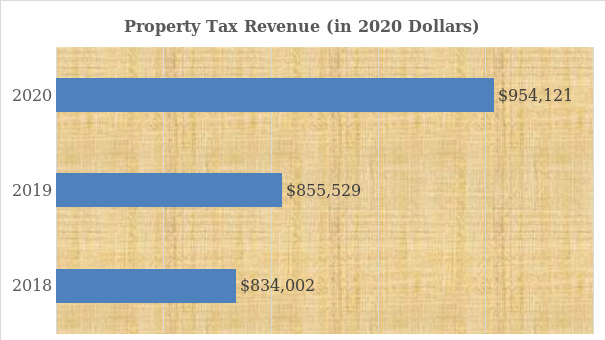
Several towns accumulate income from levies on assets held by multiple investors or people. The sales taxes that Maumelle city collected in 2018 was $834002, 2019 stood at $855529, and in 2020 it was $954121. The trend shows that the figures continued increasing, indicating that the city recorded intense new property registration for the sales tax. In addition, the yearly property taxes increase showcases that the entity is developing new properties, including establishing a charter school. The increase in the property tax income escalates the total revenue, making Maumelle city effectively address the service demands of the locals.
Sales Taxes
The sales tax collection changes indicate tremendous transformations in economic conditions. Individuals spend more on services and products when there is high consumer confidence, making the city merit due to the escalation in sales levy (Mikesell, 2018). A robust economy spearheaded by a feasible real estate market increases extra wealth for householders due to improved sales and enhanced client confidence (Anderson & Shimul, 2018). Maumelle should work towards avoiding the warning trend of decreasing the sales amount revenue as a percentage of total revenues.
Table 3: Sales Taxes Revenue
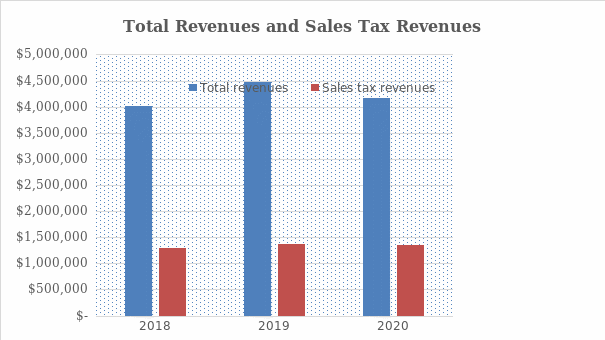
The sales tax is the cash ratepayers rescind to reputable government representatives based on the made vends. Sales tax can create income that may fund the city’s operations. The chart indicates the sales tax and total revenues have steadily increased from 2018 to 2019 except for the period between 2019 and 2020. The total revenue in 2018 was $4020770 and increased to $4473133 in 2019, mainly due to donations and grants acquired in 2019 and the usage of appropriation money from the fund balance. The city made fewer sales in 2020 than in 2018 and 2019, with a total sales income of $415647. The sales tax revenues were generally high in 2019 ($1369330) and 2020 ($1351092) contrasted to 2018, which stood at $1284083. The escalated sales tax revenue between 2019 and 2020 shows that Maumelle made some significant sales. The escalation of both the sales tax and total revenues indicates a positive trend that the city is economically growing. Therefore, it can adequately sustain the service need of the locals without indulging in losses.
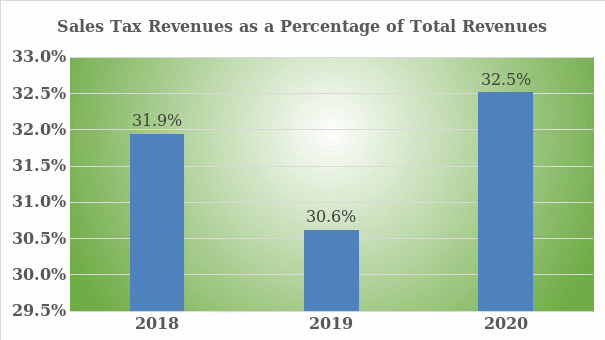
Significantly the bar chart showcases the sales tax revenues as a percentage of total revenues. Notably, there was a slight decline in the sales tax revenues as a percentage of total revenues from 2018 and 2019 from 31.9% to 30.6%. The escalation of total tax revenues spearheaded the reduction by a larger margin than the sales tax revenue gathered from other sources. At the same time, from 2019 to 2020, it can be noted there was a slight increase in sales tax revenues as a percentage of total revenues from 30.6% to 32.5%. The discrepancy was due to the increased profit collected from the sales tax than the total sales revenue in the same period. Maumelle city can establish methods to streamline sales tax collection to maximize the current sales tax.
Operating Expenses Per Household
Substantially, the transitions in expenditures relative to the populace changes are reflected by the operating expenditures per household. The city cannot pay its costs when household expenditures escalate, indicating the increased price of service provision (Stone et al., 2015). When the spending soars faster than what inflation or new initiatives can account for, it shows that Maumelle is utilizing excess funds to support similar service levels or that the approaches to offering the services are ineffective (Mikesell, 2018). The warning trend the city should consider is increasing operating expenditures per household.
Table 4: Operating Expenses Per Household
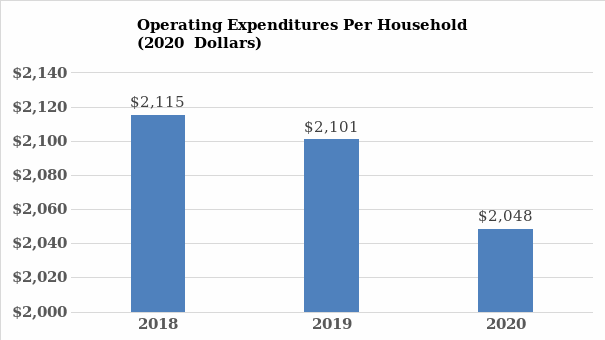
Operating expenses are the firm’s daily incurred costs, which are essential in determining sustainability. There was a declining operating expenditure per household from 2018 to 2020, whereby in 2018 stood at $2115, in 2019 was $2101, and in 2020 was $2048. This acts good sign as Maumelle city regulated its costs of service provision to sufficient levels. Therefore, the trend indicates minimal cash to reinforce or maintain similar-level services. For example, the number of municipal workers reduced significantly over the years, thus increasing the city’s service effectiveness and efficiency, and between the three years, there was no warning trend.
Personnel Costs
To a great extent, worker benefits and salaries can represent a substantial cost to a city, including Maumelle. The United States law does not mandate discretionary employment benefits, including pension plans, health and prescription drug insurance, and vacation and sick leaves (Maher et al., 2019). However, federal policies highly embrace other bonuses, such as unemployment and employee compensation. Maumelle city should ensure it has a feasible budget to avoid the warning trend of increasing personnel costs per household.
Table 5: Personnel Costs Per Household
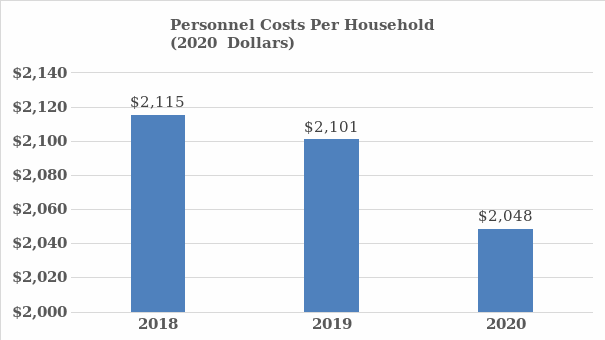
From 2018 to 2020, the personnel costs per household have been steadily declining. The personnel costs per household in 2018 were $2115; in 2019 stood at 2101, and in 2020 decreased to $2048. Maumelle city encounters a positive indication as no warning trend as per the data presented. Therefore, despite a deteriorated number of municipal workers per family, the city continued providing improved services to the locals.
Fiscal Condition Analysis Using Financial Indicators
Total Revenue Indicators
Maumelle has several revenue sources to aid in financing its operations. Regarding its operating income, several conditions, including reliability, diversity, flexibility, administration, and growth indicators, showcase how the firm performs in revenue collection (Yan & Reschovsky, 2021). Maumelle city’s revenue assessment showcases its income growth for different financial years, indicating that the entity can cater to liabilities in its daily activities (Jiang, 2021). The city has flexible sources of revenue generation, such as public safety, which means it can attain its set goals as it is positioned to meet the expenditures (Galle & Stark, 2012). However, the decline in income showcases the city cannot perform well during an economic situation, so it must continue expanding the flexibility of sources, including property and sales taxes, and avoid the decreasing warning trend.
Property Tax Revenue as an Indicator
The previous year’s residential and commercial property value impacts the property tax revenues. To a great extent, from 2018 to 2020, the Maumelle city property taxable value has been significantly escalating in the earlier years, indicating that it is proceeding in the right direction due to its positive trend. However, the low amounts of property taxes gathered in the first two years should be adequately addressed as it showed the company did not develop new properties, such as charter schools, or most individuals engaged in levy avoidance practices (Militaru & Stratmann, 2018). The increased property tax revenue showcases a low economic inflation rate, which led to the elevated value of commercial properties (Prante, 2009). The property tax income increment enhanced Maumelle’s total revenue, which was beneficial as the city could sustain all the services required.
Sales Taxes as an Indicator
Sales and uses revenues tend to reflect the short-term economic changes, particularly in Maumelle city. The leaders must work integratively to ensure that the town does not struggle economically by providing avenues for the homeowners to generate capital and sell products and services to the clients, who have enhanced consumer confidence (Anderson & Shimul, 2018). Therefore, the escalation of sales tax revenue shows that Maumelle can collect more levies and be able to fund the vital services needed by the citizens.
Operating Expenditure Indicator Analysis
If public entity records escalated expenditures in a single financial year, it indicates that it offers quality services or that some issues must be solved. The budgetary control measures of Maumelle city are highly effective as they have reduced the number of municipal workers who earlier had been performing similar jobs (Bunch, 2010). The cutting of expenditures showcases the organization’s continued expansion and sustaining itself. Maumelle’s leaders ensured proper alignment between expenses and revenues to avoid deficits in the city’s operation, which is a pragmatic indication.
Personnel Cost as an Indicator
The financial statements and budget analysis show that Maumelle city has declining personal costs from 2018 to 2020. The entity has been implementing appropriate employment policies, including reducing the number of municipal workers per household performing a similar job (Bunch, 2010). Maumelle city encounters a positive indication as no warning trend, indicating the firm has reduced legal costs by not hiring more employees but focusing on offering quality services.
Conclusion
The financial indicators have showcased how Maumelle city effectively and efficiently balances its recurring revenues and expenditures, enabling it to constantly offer essential and adequate services to its populace. The warning trends are minimal and do not impact the city’s general performance. Therefore, Maumelle has a well-balanced and stable overall fiscal condition and can operate efficiently during the economic crisis as it has sufficient resources.
References
Anderson, J. E., & Shimul, S. N. (2018). State and local property, income, and sales tax elasticity: Estimates from dynamic heterogeneous panels. National Tax Journal, 71(3), 521-546. Web.
Bunch, B. S. (2010). Budget deficits in the states: Illinois. Public Budgeting & Finance, 30(1), 105-129. Web.
Galle, B., & Stark, K. J. (2012). Beyond Bailouts: Federal tools for preventing state budget crises. Indiana Law Journal, 87(2), 599. Web.
Jiang, Z. (2021). US fiscal cycle and the dollar. Journal of Monetary Economics, 124(3), 91-106. Web.
Leiser, S., & Mills, S. (2019). Local government fiscal health: Comparing self‐assessments to conventional measures. Public Budgeting & Finance, 39(3), 75-96. Web.
Lorig, A. N. (2018). Determining the current financial position of a city. The Accounting Review, 16(1), 41–49. Web.
Maher, C., Majumder, M., Liao, W. J., & Liao, Y. (2019). Spatial analysis of local government fiscal condition in Nebraska. Socialiniai Tyrimai, 42(1), 19-31. Web.
Mikesell, John L. (2018). Fiscal administration: Analysis and applications for the public sector (10th ed.). Cengage Learning.
Militaru, A., & Stratmann, T. (2018). A survey of sales tax exemptions in the states: Understanding sales taxes and sales tax exemptions. Social Science Research Network Electronic Journal. Web.
Prante, G. (2009). Fiscal Fact: Where do state and local governments get their tax revenue? Tax Foundation, 194(2), 1-7. Web.
Schellekens, J. J. (2022). To what extent is the Moses story modeled on other biblical stories? Journal for the Study of the Old Testament, 86(2), 44-50. Web.
Stone, S. B., Singla, A., Comeaux, J., & Kirschner, C. (2015). A comparison of financial indicators: The case of Detroit. Public Budgeting & Finance, 35(4), 90-111. Web.
Yan, Y., & Reschovsky, A. (2021). Fiscal disparities among local governments in Zhejiang province, China. Journal of Urban Affairs, 46 (3), 1-22. Web.
