Introduction
Profitability ratios measure a firm’s ability in generating profit from its operations and assets. Operating profit margin considers the percentage of sales that form earnings before interest and taxes. Operating profit margin shows that Debenhams’ efficiency is declining at a higher rate than Sainsbury’s. Return on investment shows that Debenhams generates more profit from its assets than Sainsbury. Debenhams generated more earnings for shareholders than Sainsbury. Liquidity ratios show the firms’ ability to settle short-term debts.
Both firms would have problems meeting their debt obligations if all short-term creditors were to demand payment at the same time. Sainsbury manages inventory more efficiently than Debenhams. One of the weaknesses of ratio analysis is that it cannot be used to compare companies in different industries. Ratio analysis may fail to indicate changes caused by the external environment.
Profitability Ratios
Net profit margin
Net profit margin = (net income/ net sales) X 100 (Horner & Mott 2013, p. 339).
Tables 1. Debenhams’ ratios.
Sainsbury’s ratios.
Sources of data: Debenhams (2013, p. 85 & 87), Debenhams (2012, p. 11 & 13), Sainsbury (2013, p. 73 & 75) and Sainsbury (2012, p. 68 & 70).
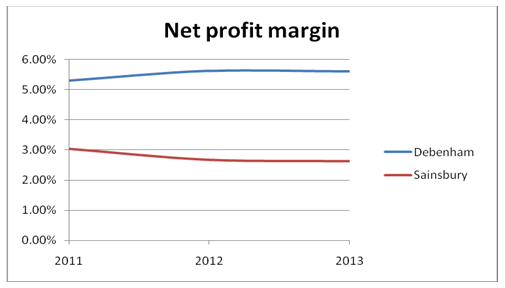
Tables 1 and graph 1 show that Debenham is more profitable than Sainsbury. Debenham earns a higher amount of profit from a dollar of sales than Sainsbury. Sainsbury needs to increase its efficiency to match the competitor. Debenham generates more value for shareholders.
Gross profit margin
Gross profit margin = (gross profit/ net sales) X 100 (Horner & Mott 2013, p. 338).
Gross profit margin shows the firms’ efficiency in obtaining goods for resale. Gross profit margin can be affected by changes in selling prices, costs of goods and intensity of competition (Horner & Mott 2013, p. 338).
Tables 2. Debenhams’.
Sainsbury’s.
Debenhams against Sainsbury.
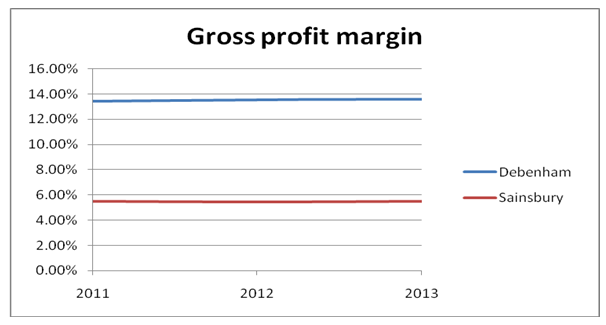
Tables 2 and graph 2 show that Sainsbury has a higher cost of goods sold than Debenham. Sainsbury needs to find out whether Debenhams is using lower cost of goods sold or higher selling prices.
Operating profit margin
Operating profit margin = (operating profit/ sales revenue) X 100 (Horner & Mott 2013, p. 338).
Tables 3. Debenhams’.
Sainsbury’s.
Debenhams against Sainsbury.
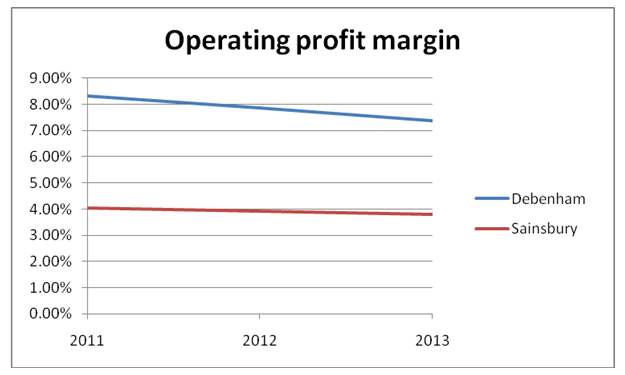
Tables 3 show that Debenham is run more efficiently than Sainsbury. Graph 2 shows that Debenhams’ efficiency is declining at a higher rate than Sainsbury’s. It could be an indication of increasing competition which lowers the selling price. It could also be a higher cost of goods sold.
Return on investment
Return on investment = net earnings/ total assets
Return on investment measures a firm’s efficiency and effectiveness in using assets to generate net income (Horner & Mott 2013, p. 337).
Tables 4. Debenhams’.
Sainsbury’s.
Debenhams against Sainsbury.
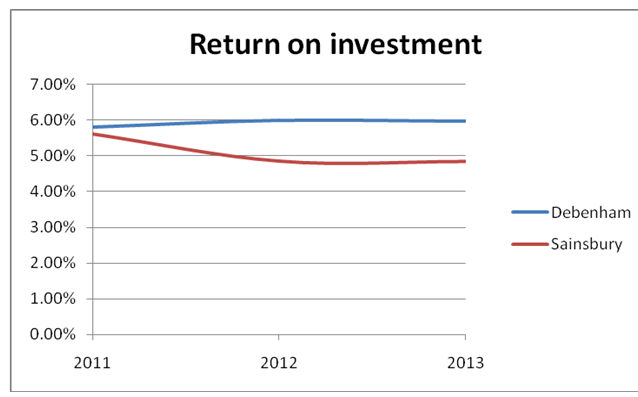
Tables 4 show that Debenhams generates more profit from its assets than Sainsbury. Graph 4 shows that Sainsbury’s ROI declined when Debenhams’ has remained stable.
Return on equity
Return on equity = net earnings/ stockholders’ equity (Horner & Mott 2013, p. 337).
Tables 5. Debenhams’.
Sainsbury’s.
Debenhams against Sainsbury.
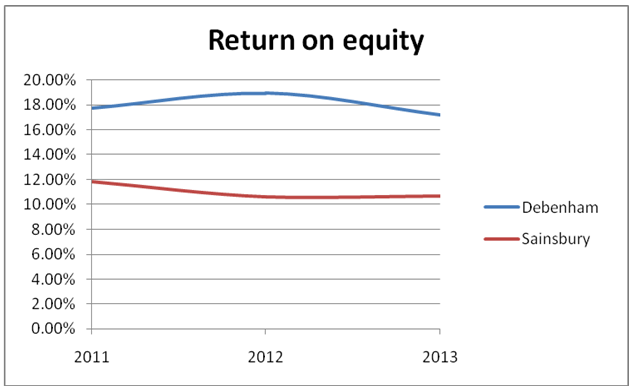
Tables 5 indicate that Debenhams generated more earnings that could be shared by shareholders than Sainsbury. Both firms show a decline in returns.
Liquidity Ratios
Current ratio
The current ratio measures a firm’s ability to honour the demands of short-term creditors about settling their debts.
Current ratio = current liabilities/ current liabilities (Horner & Mott 2013, p. 348).
Tables 6. Debenhams’.
Sainsbury’s.
Debenhams against Sainsbury.
Sources of data: Debenhams (2013, p. 85 & 87), Debenhams (2012, p. 11 & 13), Sainsbury (2013, p. 73 & 75) and Sainsbury (2012, p. 68 & 70).
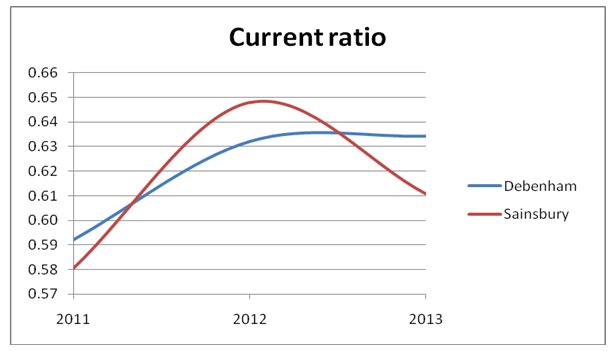
The current ratio tables show that both firms maintain similar levels of liquidity. A current ratio less than 1.0 shows that the firms would have problems meeting their debt obligations if all short-term creditors were to demand payment at the same time. Graph 6 shows that the firms’ current ratios improved then declined.
Quick ratio
Quick ratio = current assets – inventory/ current liabilities (Horner & Mott 2013, p. 348)
Tables 7. Debenhams’.
Sainsbury’s.
Debenhams against Sainsbury.
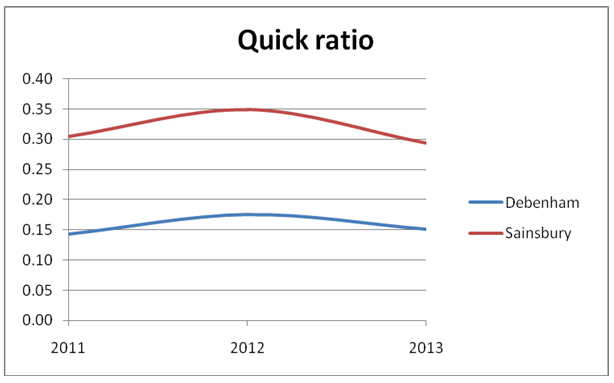
Tables 7 show that Sainsbury has a better quick ratio than Debenham. It also shows that Debenham relies a lot on inventory for its liquidity than Sainsbury.
Trade receivables days
Trades receivable days = (trade receivables/ credit sales) X 365 days (Horner & Mott 2013, p. 345).
Trades receivable days show the average number of days that a firm has to wait to collect cash from debtors (Britton & Waterston 2006, p. 197).
Tables 8. Debenhams’.
Sainsbury’s.
Debenhams against Sainsbury.
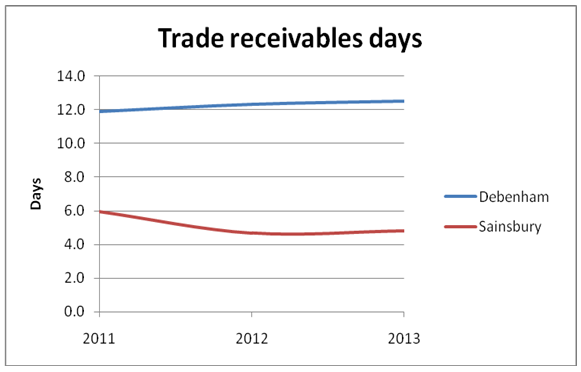
The fewer the trade receivables days, the better for the firms. Graph 8 shows Debenhams’ average days in receivables increased when Sainsbury declined. Sainsbury has a better performance.
Trade payables
Trades payable days = (trades payable/ credit purchases) X 365 days (Horner & Mott 2013, p. 345)
Tables 9. Debenhams’.
Sainsbury’s.
Debenhams against Sainsbury.
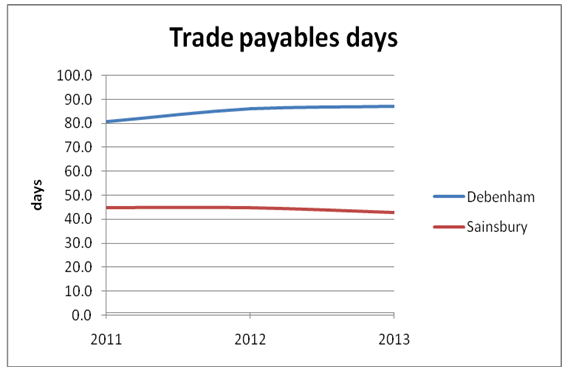
The longer a firm makes creditors to wait, the less cash it will require for operations. Tables 9 show that Debenham has a better arrangement with suppliers.
Average stock days
Average stock days = (average stock/ cost of goods sold) X 365 days (Britton & Waterston 2006, p. 197).
Tables 10. Debenhams’.
Sainsbury’s.
Debenhams against Sainsbury.
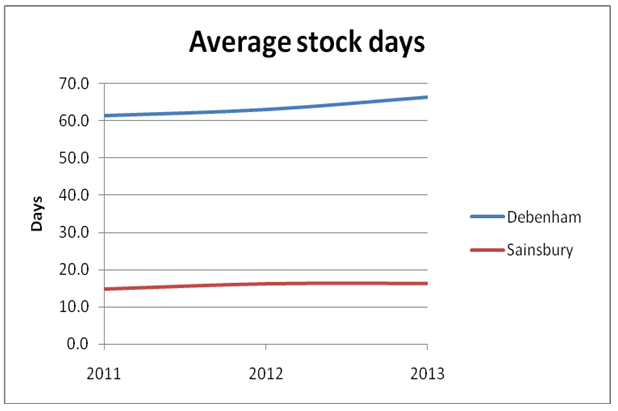
The firm that keeps stock longer may incur higher costs of maintaining inventory. Tables 10 show that Sainsbury manages inventory more efficiently than Debenhams. Graph 10 shows Sainsbury’s efficiency remained fairly constant when Debenhams’ declined.
Weaknesses of ratio analysis
One of the weaknesses of ratio analysis is that it cannot be used to compare companies in different industries. Different industries provide different rates of return and different levels of risk (Chapter 13: Financial statement analysis n.d., p. 693). Sainsbury and Debenhams are comparable because they fall under the variety stores industry.
Ratio analysis may fail to indicate changes caused by the external environment such as inflation and national consumption.
Accounting practices may affect the ability to compare financial performance accurately (Chapter 13: Financial statement analysis n.d., p. 693). The firms above cannot be compared accurately because their financial statements are compiled for different periods of the year. Debenhams’ financial statements cover years that end in August and Sainsbury’s cover years that end in mid-March. It is also difficult to calculate trade receivable days and trade payable days because firms do not disclose the amount they sell on credit.
Conclusion
Debenhams performed better than Sainsbury in all profitability ratios. Debenhams needs to improve on the operating profit margin, trade receivables, average stock days and ROE. Sainsbury performance is better than Debenhams in managing inventory, trade payables and the quick ratio. Both firms do not keep the required level of the current ratio. Their current liabilities are more than current assets by a big margin. Ratio analysis cannot be used to compare companies in different industries. It may be difficult to compare companies in the same industry if they are based in different countries because of different accounting practices. The two firms are based in the same country but have different periods in which their calendar ends. Debenhams’ financial statements cover years that end in August. Sainsbury’s covers years that end in mid-March. It creates a weakness in analyzing the financial statements.
Recommendations
Similar trends among firms in ratio analysis should be followed by an analysis of the external environment to determine the influence of external factors.
Both firms need to improve their current ratio towards a ratio of 1.0.
Sainsbury needs to check its efficiency in generating profits to match Debenhams.
Debenhams is a better choice for an investor than Sainsbury based on the level of profitability.
Reference List
Britton, A & Waterston, C 2006. Financial accounting, 4th edn, Pearson Education. Harlow.
Chapter 13: Financial statement analysis n.d., Web.
Debenhams. 2013. A leading international multichannel brand: Debenhams plc annual report and accounts 2013. Web.
Debenhams. 2012. Debenhams plc: Full year results 2012. Web.
Horner, D & Mott, G. 2013. Accounting for non-accountants, 9th edn, Kogan Page, Philadephia.
Sainsbury. 2013. J Sainsbury plc annual report and financial statements 2012. Web.
Sainsbury. 2012. J Sainsbury plc annual report and financial statements 2012. Web.