Executive Summary
The supplier’s appraisal is a complex procedure that is based on collecting the data regarding the potential supplier that are retrieved from different sources, the analysis of the company’s position according to the set criteria, and the determination of the maximum contract value. The prioritized data selected for this type of the supplier’s appraisal are the income statement and the balance sheets for the company’s financial performance retrieved for two past years. The goals of the assessment are the complex evaluation of the strengths and weaknesses of the supplier’s current financial position and the provision of recommendations for Facilities Management Services regarding the choice of the company for the planned sourcing exercise.
The report presents the discussion of the selected type of sourcing, pre-qualification criteria oriented to analyzing the financial stability of the company because of the available profit statements and balance sheets, the results of the ratio analysis regarding profitability, liquidity, gearing, and investment, the SWOT Analysis, and the analysis of the company’s position according to Kraljic’s Matrix and the Supplier’s Perception Matrix. These techniques are appropriate in order to assess the suitability of the supplier to work with Facilities Management Services.
The evaluated organization can be selected as the short-term supplier because the company demonstrates the stable and slow growth regarding profits and the high indicators in relation to the Return on Capital Employed and the Return on Investment. However, the low liquidity level and the high level of gearing influence the expected financial risks, and the maximum contract value for this supplier is determined to be 30,000 (£ or $ ’000, referring to the data of the income statement and balance sheet).
Introduction
The process of selecting suppliers for the sourcing exercise depends on choosing the pre-qualification criteria according to which the supplier is evaluated and on the detailed analysis of the organization’s strengths and weaknesses regarding its current position (Hofmann, Beck, & Fuger, 2012). The focus on the type of sourcing that is relevant for Facilities Management Services is important to analyze the appropriateness of the supplier for the concrete client. The selected pre-qualification criteria for the supplier appraisal include the questions regarding the financial performance during the past two years.
The effective evaluation of the potential supplier should be complex, and it includes the use of such matrices as Kraljic’s Matrix and the Supplier’s Perception Matrix (CIPS, 2015b; Supply Management, 2010). The SWOT Analysis is the effective tool that should be used in the evaluation process in order to discuss the organization’s strengths and weaknesses (Colwell, 2012).
The actual analysis of the financial data should be performed with the focus on the ratio analysis in order to determine the company’s profitability, liquidity, gearing, and investment in the concrete situation (Financial ratio tutorial, 2016). For the purpose of the supplier appraisal for Facilities Management Services, the sources of information that are used for the evaluation of the organization’s appropriateness include the company’s financial data on two 12-month periods ended on March 31 of 2013 and March 31 of 2014 (Appendix A). The first part of the analysis includes the evaluation of the strengths and weaknesses associated with the company’s financial position.
Evaluation of the Financial Information Identifying Strengths and Weaknesses
The financial reports and statements provide the detailed information on the organization’s profitability and the potential for developing the short-term and long-term relationships with partners. The appraisal of the supplier based on the analysis of the financial information includes the discussion of the appropriate type of sourcing, the use of templates of pre-qualification questionnaires, the ratio analysis, the SWOT analysis, and the application of such typically used matrices as Kraljic’s Matrix and the Supplier’s Perception Matrix (Colwell, 2012).
Types of Sourcing: Sole, Single, Dual, and Multiple
While analyzing the possibilities of selecting the discussed organization for the sourcing exercise, it is important to assume the single sourcing choice for Facilities Management Services, and this assumption influences the strategy that is used for the supplier appraisal. In comparison to the sole sourcing associated with the monopolistic supplier, single sourcing provides more opportunities to set the conditions that are advantageous for Facilities Management Services (Hofmann et al., 2012).
However, in comparison to dual and multiple sourcing, the supply risks are higher (Hofmann et al., 2012). While focusing on the high risk of selecting the inappropriate supplier, it is necessary to set the contract duration and the financial exposure referring to the detailed analysis of the company’s financial performance (Colwell, 2012). It is important to note that seeing the supplier as the single choice in the industry, it is significant to predict the future trends in the company’s development in order to avoid the financial losses and possible delays in sourcing when no other suppliers are available.
The Supplier Appraisal According to Pre-Qualification Criteria
In order to complete the first stage of the supplier appraisal, it is necessary to use the standard template of the pre-qualification questionnaire and refer to the ‘fast-track’ procedures (The Scottish Government, 2015). For this supplier’s appraisal, it is relevant to focus on the part of the pre-qualification questionnaire that asks for the information regarding the financial stability of the organization (CIPS, 2015a). The choice of this pre-qualification criterion is based on the availability of financial data regarding the company’s performance during two past years. The standard questionnaire asks for providing the following data:
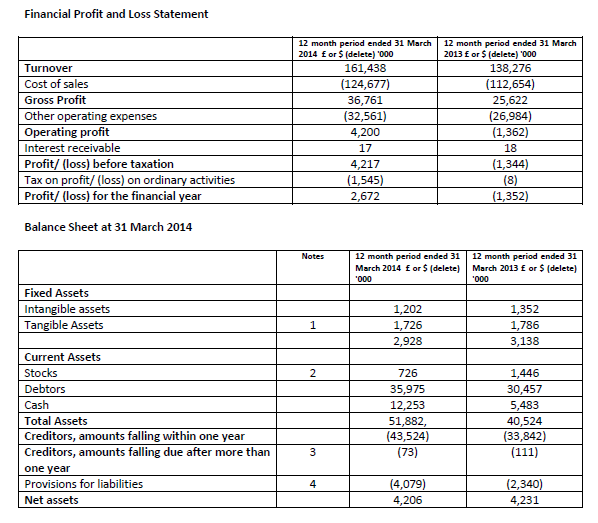
- Income statement (profit or loss statement) for two years.
- Balance sheets for two years.
- Additional information as notes and annexes (The Scottish Government, 2015).
The potential supplier has provided the information required regarding the income statement and balance sheets for 2013 and 2014 years, as well as notes on the numbers on the balance sheet (Appendix A). This information is used for the further analysis and the ‘fast-track’ appraisal procedure based on the quick analysis of the balance sheet numbers.
The Ratio Analysis
The analysis of ratios associated with the organization’s profitability, liquidity, gearing, and investment allows concluding regarding the future development of the company and its discussion as the competitive actor within the market and industry (The Office of Government Commerce, 2013, p. 19). The analysis is most detailed when it is based on the discussion of trends noticed during the past two years in order to compare the observed dynamics in the company’s financial development.
Profitability
While referring to the provided income statement, it is possible to assess the organization’s profitability in order to conclude about the changes in the company’s development during two years. The focus is on measuring Gross Profit Margin, Markup, Net Profit Margin, and Return on Capital Employed. For 2013, Gross Profit Margin was 19%, and for 2014, Gross Profit Margin increased to 23%, as it is calculated with references to the available financial data (Appendix A). The determined growth by 4% influenced the overall profit of the company in 2014 because a loss was observed in 2013.
The overall Gross Profit can be discussed as increasing, providing the company with possibilities to control its costs. The markup for 2014 increased by 6%, demonstrating the amount of profit that was added to costs of sales. The positive tendency can also be observed with references to changes in Net Profit Margin. For 2013, it was lower than 1%, and for 2014, the ratio is 2.6%. This profit is important to explain the overall positive changes in the income statement for 2014 in comparison with the data for the year of 2013. In spite of the fact that Net Profit Margin is minimal, it grows, and this fact can be discussed as a positive tendency.
While focusing on Return on Capital Employed, it is important to state that in spite of having the low working capital, in 2014, the organization also had the low capital investment and achieved Return on Capital Employed in 100%. This indicator is one of the most significant factors to determine the profitability of the organization, and it is possible to speak about the premises for the future growth of the company’s profitability in the long-term period (The Office of Government Commerce, 2013).
Liquidity
In order to conclude about the current potential of the organization to cover the liabilities, it is necessary to assess the aspect of liquidity according to such ratios as the Current Assets Ratio and Acid Test Ratio (Financial ratio tutorial, 2016). These indicators demonstrate how quickly the organization can turn its assets into the cash and address the liabilities. The Current Assets Ratio for 2013 and 2014 is 1.03, 1:1 that means that the organization almost had no working capital, and there were no changes for two financial periods. Thus, the company works only to cover its liabilities, but it cannot provide payments and address other obligations on time. Therefore, Acid Test Ratio for 2013 and 2014 is also almost equal, 1:1. From this perspective, the possibility of the organization to turn the assets into the cash is rather limited.
Gearing
The conclusions regarding the financial structure of the organization are also based on measuring the gearing. For 2013 and 2014, the gearing did not change, and it was rather high, indicating 73%. Thus, the company relied on the fixed-return capital, and this fact influenced the possibility of the company to remain stable during a long period of time (Financial ratio tutorial, 2016).
Investment
The company’s indicators regarding its dependence on investment are measured with the focus on Return on Shareholders’ Funds or Return on Investment (ROI). In 2013, there was observed the loss on ROI by 34%. In 2014, the ROI was 64%, and this result demonstrates increases in the company’s potential regarding its relations with shareholders.
The SWOT Analysis
In order to evaluate the organization’s strengths and weaknesses related to its current financial position, it is necessary to conduct the SWOT (strengths, weaknesses, opportunities, threats) analysis, and complete the SWOT Analysis Matrix (Figure 1).
Figure 1. SWOT Analysis Matrix.
Figure 1 summarizes the strengths and weaknesses that are observed in the company’s development with the focus on the ratio analysis, and it also predicts opportunities and threats associated with the further company’s progress. These observations are important to conclude regarding the company’s successfulness during the two recent years.
Kraljic’s Matrix
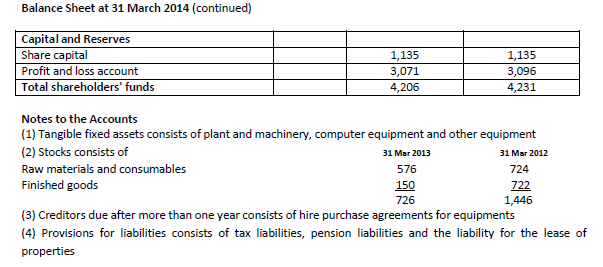
While referring to the information provided in the financial reports regarding the current positioning of the organization, it is possible to analyze the supply risks and the profit impact according to the Kraljic’s Matrix (Figure 2).
According to the organization’s financial statements, the expected profit impact is rather high because of the possible high purchased volume. The available volume of products allows the minimization of the price (Hofmann et al., 2012). While assuming that the substitution possibilities are medium in this industry, it is possible to state that the supply risk is rather low. As a result, the products can be discussed as ‘leverage’ ones.
The focus is also on the buying power. Discussing the proposed products as leverage, Facilities Management Services should avoid long-term contracts and relationships with this supplier because of its comparably slow growth (CIPS, 2015a). There are difficulties associated with the impossibility to predict the company’s further progress adequately; therefore, much attention should be paid to the market monitoring in order to assess the supply, prices, and the changes in the company’s profitability.
Supplier’s Perception Matrix
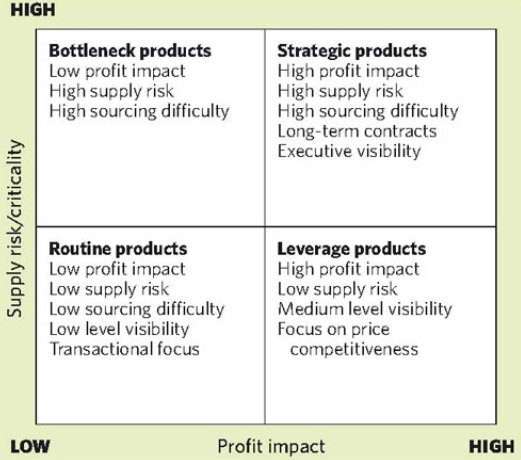
The selection of the supplier also depends on the supplier’s vision of the company that plans the sourcing. According to Supplier’s Perception Matrix presented in Figure 3, Facilities Management Services is viewed as the opportunity business with the high level of attractiveness, but it also has the comparably low level of account profitability.
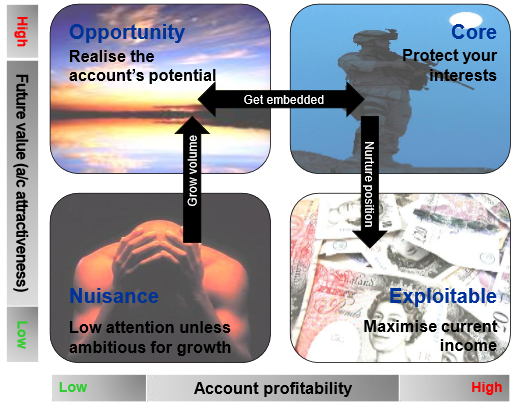
The supplier’s interest in partnering with the company depends on flexibility, innovativeness, the effective pricing strategy, and the focus on constant improvements typical of Facilities Management Services. The problem can be observed only with references to the high buyer’s power and the limited relationships with the focus on the short-term contracts under the situation of selecting the single supplier.
Summary of the Determined Strengths and Weaknesses
The conducted evaluation of finances of the organization that is appraised as the potential supplier demonstrates the presence of the positive tendency regarding the increases in the company’s Gross Profit. These numbers indicate the potential for the future growth. However, the observed changes are remarkable only in the context of comparing the income statements for 2013 and 2014 because the company overcame the loss in 2013 (Appendix A). Referring to the net assets, the significant changes are not observed.
As a result, the weak points in the position of the company are the low potential for liquidity, the absence of the adequate working capital, and the high gearing. However, in spite of these measures that indicate the problems with turning the assets into cash and covering extra liabilities, the Return on Capital Employed for 2014 is 100%, and the ROI is 64%. In addition, it is important to state that the total debt tends to decrease, and these measures point to strong features in the financial position of the company. It is also important to state that these measures demonstrate that the company increases its attractiveness for investors in spite of reducing the overall dependence on the investors’ capital and increasing the profitability because of higher sales while comparing the data for 2013 and 2014.
Appropriateness of the Organization for the Sourcing Exercise
In order to decide on the organization’s potential to be used for the sourcing exercise, it is necessary to refer to the actual quantitative analysis of the available financial data, the conducted ratio analysis, and the assessment of the financial indicators according to Springate’s Model that is relevant to demonstrate the financial risks associated with the prediction of the company’s bankruptcy (Hofmann et al., 2012). This part of the supplier’s appraisal includes the analysis of the company’s financial performance with the focus on Springate’s Model and the analysis of the ratios with the focus on determining the maximum contract value for the sourcing exercise with the discussed supplier.
The Evaluation of Financial Risks
Springate’s Model
In the supplier’s appraisal procedure, Springate’s Model is used in order to assess the company’s financial position with the focus on the Z score that is relevant to identify the financial soundness of the organization. The Z score is calculated with the help of measuring the ratio of the working capital to total assets, the net profit before taxes to total assets, the net profit before taxes to current liabilities, and sales to total assets (Hofmann et al., 2012).
In relation to the financial data of 2014, the company’s Z score is 3.3 (Appendix A), as the sum of 0.02 for the ratio of the working capital to total assets, 0.08 for the ratio of the net profit before taxes to total assets, 0.09 for the ratio of the net profit before taxes to current liabilities, and 3.11 for the ratio of sales to total assets. This indicator is compared to 0.862, identified by Springate as the indicator of the company’s failure (Hofmann et al., 2012). According to the determined Z score, the level of financial risks can be discussed as rather low for the analyzed company.
Determination of the Contract Value
The maximum contract value that is safe for Facilities Management Services can be determined according to the formula that involves comparing the contract value that is annual for the company with the observed average annual turnover that was noted with references to the data of 2013 and 2014 years (Hofmann et al., 2012; The Office of Government Commerce, 2013). While comparing the financial data, it is possible to state that the contract limit to address all possible financial risks is about 33,000 (£ or $ ’000).
The focus is on setting the maximum threshold for the contract in less than 25%, as it is recommended by the financial consultants (The Office of Government Commerce, 2013). However, in order to guarantee that Facilities Management Services is on the safe side while working with this supplier, it is reasonable to reduce the maximum contract value appropriate for this type of the sourcing exercise to 30,000 (£ or $ ’000). While applying this contract value, it is possible to address the trends in changes in the company’s gross profit examined for the period of 2013 and 2014.
Summary and Recommendations Regarding Using the Organization for the Sourcing Exercise
Recommendations regarding the discussion of the appraised organization as an appropriate choice for a sourcing exercise for Facilities Management Services should be based on calculations of ratios regarding profitability and liquidity, the identified Z score, and the determined contract value. For Facilities Management Services, it is possible to recommend the work with the assessed supplier while emphasizing maximum contract value in 30,000 (£ or $ ’000, according to the income statement and the balance sheet) that is equal to the contract threshold of about 20%. The percentage is lower than the recommended 25%, it is possible to expect the response to the main financial risks (The Office of Government Commerce, 2013).
The reasons to recommend the cooperation are in the fact that the evaluated company demonstrates the effective balancing between increasing the profitability, responding to the low liquidity, and addressing the assumed financial risks. In spite of the fact that the liquidity of the company is rather low because of the lack of the effective working capital, the organization’s risk of bankruptcy is also minimal, while referring to Springate’s Z score (Hofmann et al., 2012). Moreover, the investment capacity is rather high, and this area is the source of the potential for the company’s further growth in the industry as a supplier.
As a result, it is possible to predict the slow and stable growth of the company within the long-term period. However, it is important to state that in order to eliminate the risks for Facilities Management Services, the focus should be on signing the short-term contract. The assessed supplier can be discussed as able to address the size of the contract and provide Facilities Management Services with the necessary volume of products, but the company’s orientation to the long-term growth and the low liquidity requires establishing the contracts according to the conditions that are safe for the company but also attractive for the supplier.
While summarizing the conducted supplier’s appraisal procedure, it is possible to state that the company under the assessment can be selected for working with Facilities Management Services because its financial indicators are within the norm, and it is possible to expect the growth in profitability and liquidity within the next years. However, the situation of selecting the company as the single supplier limits the possibilities of the buyer to address the financial risks effectively.
Therefore, focusing on the ratio analysis and the determined financial risks measures, it is possible to propose the short-term contract for the organizations, and the maximum contract value should be determined while taking into account the company’s high gearing and low liquidity. From this perspective, the conducted appraisal demonstrates that in the situation of the single sourcing, this company is an appropriate choice, and the interests of Facilities Management Services can be protected with the focus on the short-term contract and properly calculated contract value.
References
- CIPS. (2015a). How to appraise suppliers. Web.
- CIPS. (2015b). Portfolio analysis: Spend segmentation tool. Web.
- Colwell, T. (2012). How to select strategic suppliers: Beware the supplier’s perspective. Web.
- Financial ratio tutorial. (2016). Web.
- Hofmann, E., Beck, P., & Fuger, E. (2012). The supply chain differentiation guide: A roadmap to operational excellence. New York, NY: Springer Science & Business Media.
- Supply Management. (2010). Using the Kraljic portfolio purchasing model. Web.
- The Office of Government Commerce. (2013). Supplier financial appraisal guidance. Web.
- The Scottish Government. (2015). Standard pre-qualification questionnaire. Web.
Bibliography
CIPS. (2015a). How to appraise suppliers. Web.
CIPS. (2015b). Portfolio analysis: Spend segmentation tool. Web.
CIPS. (2015c). Supplier evaluation and appraisal. Web.
Colwell, T. (2012). How to select strategic suppliers: Beware the supplier’s perspective. Web.
Financial ratio tutorial. (2016). Web.
Hofmann, E., Beck, P., & Fuger, E. (2012). The supply chain differentiation guide: A roadmap to operational excellence. New York, NY: Springer Science & Business Media.
Johnsen, T., Howard, M., & Miemczyk, J. (2014). Purchasing and supply chain management: A sustainability perspective. London, UK: Routledge.
Murigi, P. M. (2014). Influence of supplier appraisal on procurement performance in the real estate industry in Kenya: A case study of International House Ltd. International Journal of Operations and Logistics Management, 3(3), 250-262.
Supply Management. (2010). Using the Kraljic portfolio purchasing model. Web.
The Office of Government Commerce. (2009). Procurement resources. Web.
The Office of Government Commerce. (2013). Supplier financial appraisal guidance. Web.
The Scottish Government. (2015). Standard pre-qualification questionnaire. Web.
Appendix A