Abstract
In the world, today investment decisions play an important role in determining the level at which the business is operating. A company is planning to expand its product base by introducing a new model into the market. To successfully the company carried research and development on two models, the spring model, and autumn model but can only support one in production. The viability of each should be analyzed to determine which is taken. This paper undertakes to analyze and recommend the best model to produce. The model to be produced should greatly impact the profitability of the company.
Alternative solutions
In evaluating these products it has been assumed that tax does not exist. There are many alternatives to evaluating this problem the alternatives include
Accounting Rate of Return
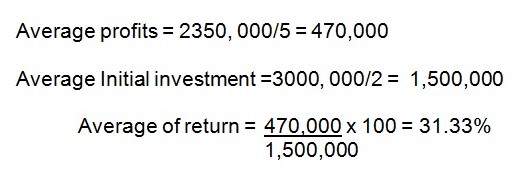
Accounting rate of return is one of the methods which consider average profits and average investment. The figures available in the balance sheet are used in determining the profits to be used. The average accounting profit from the project is expressed as a percentage of the average investment. The denominator needs to be defined and the definition consistently applied. The decision rule under ARR is a defined minimum are acceptable; the greater the ARR, the more desirable (Rao 1989).
Advantages and disadvantages
- It does not relate directly to shareholders wealth.
- Its use can lead to illogical conclusions.
- Takes almost no account of the timing of cash flows.
- Ignores some relevant information and may take account of some irrelevant.
- Relatively simple to use.
- Much inferior to NPV.
Analysis
The formula is calculated as:

Spring Model “000”.
Autumn Model “000”.
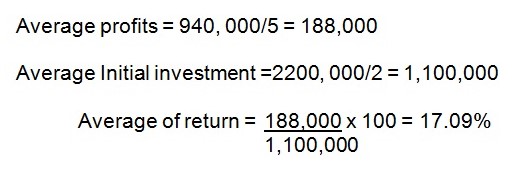
Decision: take spring model based on this criteria
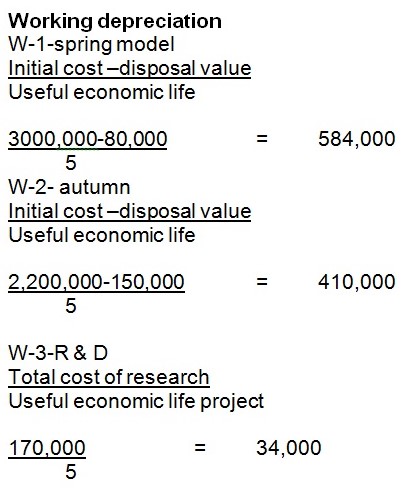
Note that whichever project will be taken R& D cost has been incurred for the two.
Pay back period
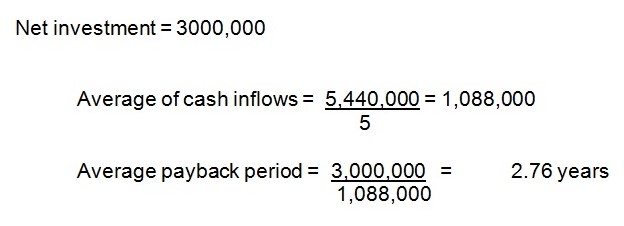
Pay back period is the number of years required to recover the net investment. The length of time it takes the cash outflow for the initial investment to be repaid out of resulting cash inflows. Decision rule- projects with a PBP up to defined maximum period are acceptable; the shorter the PBP, the more desirable (Pandey 2009)
The formula for average pay back period is shown below:

Advantages and disadvantages
- It does not relate to shareholders wealth; ignores inflows after the payback date
- The discounted version takes little account of the timing of cash flows
- Ignores such relevant information
- Does not always provide clear signals and can be impractical to use.
- Much inferior to NPV, but it is easy to understand and can offer a liquidity insight, which might be the reason for its widespread use.
Analysis
The formula is calculated as:

Spring Model “000”.
Autumn Model “000”.
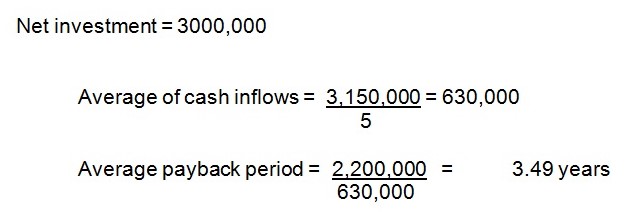
Decision: take spring model based on this criteria.
Net Present Value (NPV)
This method considers time value for money. NPV= the sum of the discounted values of the cash flows from the investment. Decision rule-all positive NPV investments enhance shareholders’ wealth; the greater the NPV the greater the enhancement and the more desirable. Present value of a cash flow (Cn) =Cn/(1+Rn), assuming a constant interest rate. The act of discounting brings cash flows at different points in time to a common valuation basis, which enables them to be directly compared (Gitman 2009). Net present value = present value of cash inflows – net investments
The criteria for accepting rejecting the project are if NPV ≥ 0 accept the project otherwise rejecting the project. The project is accepted when the NPV ≥ 0 because it will increase the shareholders wealth.
The formula for average pay back period is shown below:
![]()
Advantages and disadvantages
There are many advantages for these methods of analyzing the project. The net present value and expected values normally brings together a large amount of data into one value, it also gives an easy way of spreading many options to arrive at one potion that is acceptable. This method however, has not many disadvantages because it keeps away some vital information such as it the net present value and probability occurrence of the worst scenario (Gitman 2009).
- Relates directly to shareholders.
- Takes account of the timing of cash flows.
- Takes all relevant information into account.
- Provides clear signals and practical to use.
Analysis
The formula is calculated as:

Spring Model “000”.
Net present value is 503,960.
Autumn Model “000”.
Net present value is 88,200.
Decision: take spring model based on this criterion as it has higher net present value.
Internal Rate of Return
Internal rate of return is the rate of discount that causes the present value of cash inflows to be equal to the net investment value of the project that is the rate which produces 0 net present values. IRR=the discount rate that causes a project to have a zero NPV. It represents the average percentage return on the investment, taking account of the fact that cash may be flowing in and out of the project at various points in its life. Decision rule- projects that have an IRR greater than the cost of capital are acceptable, the greater the IRR, the more desirable. Usually cannot be calculated directly; a trial and error approach is usually necessary. The criteria for accepting and checking the project is that internal rate of return ≥ cost of capital the project is accepted otherwise the project is subject to rejection (Gitman 2009).
Internal rate of return is calculated as follows:
Annuity :
- calculate the payback period of the project
- Using the present value annuity factor table find the factor closest to the payback period. This could produce internal rate of return.
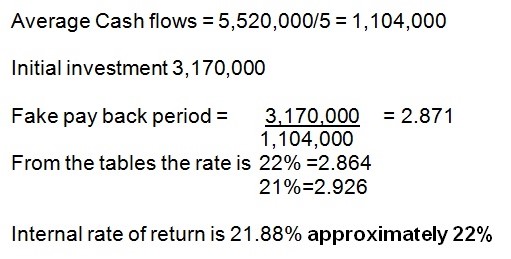
For mixed stream of cash flows:
- Calculate the average annual cash flow to get fake annuity.
- Divide by average annual cash flow into initial net investment in order to get a fake pay back period.
- Use the table of annuity to estimate internal rate of return.
- Calculate the net present value using the new internal rate of return obtained then adjust the net present value accordingly if the result is different.
Advantages and disadvantages
It does not relate directly to shareholders wealth. Usually it will give the same signals as NPV, but it can mislead where there are competing projects of different scales.
- Takes account of the timing of cash flows.
- Takes all relevant information into account.
Does not always provide clear signals and can be impractical to use:
- Often cannot cope with varying costs of finance.
- With unconventional cash flows, problems of multiple or no IRR.
- Inferior to NPV.
Spring Model “000”.
Autumn Model “000”.
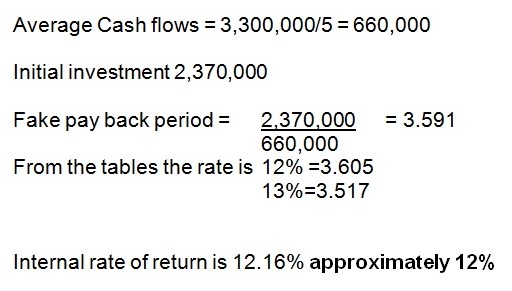
Decision: take spring model based on this criterion as it has higher internal rate of return.
Recommendation
Based on the analysis carried out above, Spring Model should be accepted because it provides a positive net present value, a higher internal rate of return and which is greater than the cost of capital, higher accounting rate of return and lower Payback period.
NPV and IRR
Although several finance practitioners had pointed out that sometimes IRR and NPV shows conflicting result, the study of Singh and Gaur concluded that “It must, therefore, be emphasized that when an evaluator has to reject or accept a project in a real life situation, IRR criterion does not conflict with NPV criterion. Indeed any one of the two would serve the purpose” (2004, p. 1643).
These sometimes conflicting results, however, is due to the fact that IRR and NPV “have intrinsic differences between one another. The IRR is a financial indicator and the NPV is an economic indicator of a capital investment. The former gives the private investor’s point of view and the latter the society’s point of view. The value of IRR varies with the change of financial arrangement of an investment. The NPV, however, does not but remains constant no matter how the financial arrangement changes” (Tang & Tang 2003, p. 69). So, there should really be no confusion as regards the results of these two financial tools.
Extra Information
There are many factors that should be taken into consideration before deciding whether to undertake an investment apart from quantitative analysis. One such information that is required is how financing will be obtained. Financing plays an important role in project management. Especially these times of financial crisis the type of finance to be sourced for the project is of paramount importance. The management also should consider risk associate with the investment. They should consider the risks inherent in the business such as competition management and analyze to gauge whether they are capable if undertaking the project.
The government policy economic conditions and environmental risks should also play an important role before making a decision. Suppose the company was intending to manufacture and supply goods to a country that is politically unstable. The political risk associated with the instability should be in consideration before making the decision. The company should also consider the ability of companies with similar products to enter into the market thus destroying the company’s market.
In the analysis, one must also consider the cash flows associated with a delayed investment. Therefore the management should be candid enough to provide information relating to delayed investment i.e. if the management delays investing today what will be the returns for the company?
After evaluating using quantitative then comes in qualitative Phase in Project budgeting. When the project passes through the quantitative analysis test it has to be further evaluated in terms of qualitative factors. Qualitative factors are those which will affect a project but are impossible to evaluate accurately in monetary terms.
- The societal effect of an increase or decrease in employees’ number.
- The positive and negative government political attitude towards the project.
- Strategic consequences of conception scarce low materials.
- A positive or negative relationship with the labor union about the project.
- The possible legal difficulties are possible to the use of patents, copyrights, brand names.
- Impacts on the firms’ image if the project is socially questionable.
The above factors should be factored into the project. To enable project address them adequately to be certain of meeting at ultimate objectives.
List of References
Gitman, L. 2009. Principles of Managerial Finance. Addison Wesley, Boston.
Pandey I. 2009. Financial management. Vikas Publishing House PVT ltd, New Delhi.
Rao, R. 1989. Fundamentals of Financial Management. New York: Macmillan Publishing Company.
Ryan, P. & Ryan, G. 2002. ‘Capital budgeting practices of the Fortune 1000: How have things changed?’, Journal of Business and Management, vol. 8, no. 4, pp. 355-364.
Singh, S. & Gaur, P. 2004. ‘How Close are NPVI and IRR as Criteria for Project Choice in Real Life?’, Finance India, vol. 18, n0. 4, pp. 1643-1650.
Tang, S. & Tang, H. 2003. ‘The variable financial indicator IRR and the constant economic indicator NPV’, The Engineering Economist, vol. 48, no. 1, pp. 69-78.