Types of Risk and Beta in Relation to a Company’s Required Rate of Return
Investors are always attracted to industries and economic avenues with a higher rate of return. Profitability and rate of return depending on how the risks are understood and eliminated. The three common types of risks alongside beta are market risk, industry-specific risk, and idiosyncratic risk (Assefa et al., 2020). Market risks are losses a company incurs as the prices of goods and services change. Fluctuations in the foreign exchange rate and changes in equity mostly cause them. Industry-specific risks are threats that are unique to particular industries. For example, an insurance company depends on another company’s willingness to pay fixed-rate annuities. Idiosyncratic risks are outside the Company’s control. Such risks include changes in the country’s tax policies and inflation rates. Beta measures an organization’s security and ability to overcome risks and make profits.
The risks have a direct correlation with the Company’s rate of return. When the idiosyncratic risks are higher, inflation and tax may inflate prices and, consequently, lower sales. Further, higher market and industry-specific risks are key in jeopardizing the business, and a lower rate of return will be experienced (Watanabe et al., 2020). Beta and security are important because they give an investor an overview of a business’s profitability, allowing them to determine the rate of return.
The Company’s Beta and the Company-Specific Required Rate of Return
Beta measurement helps organizations understand the volatility and systematic risks of the stock in a given fiscal year. The selected Company for beta calculation is Amazon, a technology corporation that has thrived in the last couple of years. Amazon’s beta measurement is 1.17 for the year ending 31st December 2021. The market stock for comparison is 1.0. The Company has a positive deviation of +0.17. The aberration shows that the Company’s security is more volatile than the market (Huang et al., 2022). Consequently, stock prices may change quickly, and management must be keen on the decisions.
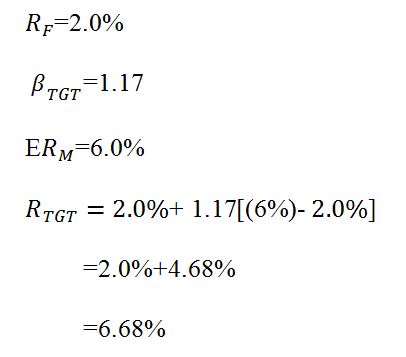
The target corporation’s return rate is calculated using capital asset pricing model. The formula for the calculation is given as Expected return = Risk-Free Rate + [Beta x Market Return Premium (Watanabe et al., 2020). For Amazon’s calculation, a risk-free rate of 2.0%. Since Amazon is a large incorporation, the market risk premium is 6.0% and a beta of 1.17.

where ![]()
![]() is the common stock’s systematic risk, and E
is the common stock’s systematic risk, and E ![]() is the expected rate of return. Assuming that:
is the expected rate of return. Assuming that:

The expected rate is 6.68% which is lower than 10%. 6.68% is, therefore, the minimum percentage that will be acceptable to investors to get a return on their investment.
The Estimates of the Stock Price
The constant growth formula is useful for calculating the new stock price in the targeted corporation. The main components used in the formula are the dividends, denoted as D, the rate of discount denoted as r, and the dividend growth rate, denoted as g. The formula is

(Assefa et al., 2020). Investors must note that they use the growth rate to make decisions after a specific period of operation. From the calculation, assuming D=150 lower value and 155 higher value, r=0.97, and g=0.22.
![]() =184.28.
=184.28.
![]() =178.33.
=178.33.
The higher and the lower prices are higher than the current stock price at Amazon, meaning that they are underpriced.
The performance scores for Amazon are calculated from data in February 2021. The Company can improve its trading equity by always sticking to a dynamic plan incorporating changes in the ever-evolving corporate domain. The trading capital must also be protected by ensuring that loss-stopping strategies are always used in the CAPM. Directors must set up a research and development department to ensure that advertisement for the shares is personalized to increase demand (Huang et al., 2022). Through price discrimination there, Amazon can expand its ventures to other parts of the world.
References
Assefa, T. A., Haroon, B. F., & Raphael, S. H. (2020). Tech slock returns and empirical Analysis of CAPM. Journal of Accounting and Finance, 20(5). Web.
Huang, W., Shi, X., Wang, Y., & Zhu, Z. (2022). Standard option and power option of Amazon. Inc and sensitivity analysis. In 2022 7th International Conference on Financial Innovation and Economic Development (ICFIED 2022) (pp. 316–323). Atlantis Press. Web.
Watanabe, C., Tou, Y., & Neittaanmäki, P. (2020). Institutional systems are inducing R&D in Amazon-the role of an investor surplus toward stakeholder capitalization. Technology in Society, 63. Web.
