ROE Trends
Apple Inc. has been a stable performer in terms of Return on Equity (ROE) for the past three years. In 2019, ROE was 0.56, which is higher than in 2018 (0.49) and significantly than the consumer electronics industry’s average of 0.2 (CSI Market, 2020; Yahoo Finance, 2020a). This implies that the management of Apple Inc. continues to improve the effectiveness of using assets to create profits (Hargrave, 2020).
In 2019, the company was stable in terms of profitability. Its profit margin (PM) ratio has not experienced any significant change during the past three years, which implies that no changes were affecting the income to sales ratio occurred. In comparison with the industry’s average, Apple Inc. had a PM ratio of 0.25 in 2019, which is somewhat higher than the industry’s average of 0.23 (CSI Market, 2020; Yahoo Finance, 2020a).
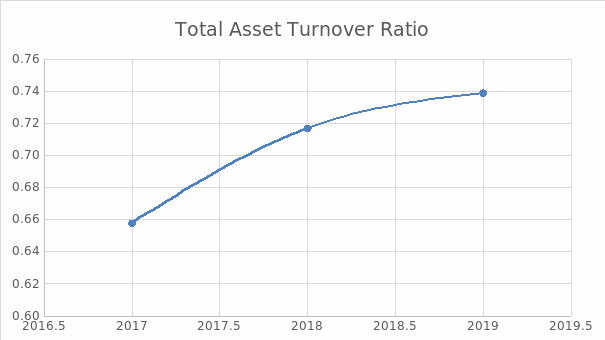
In the previous year, Apple Inc. continued to improve its total asset turnover (TAT) ratio. In the course of three years, TAT has increased from 0.66 to 0.74 (Yahoo Finance, 2020a). Apple’s performance was higher than the industry’s average of 0.69 (CSI Market, 2020). This implies that the company is using the assets effectively to generate sales.
In terms of financial leverage, Apple Inc. uses debt aggressively to increase shareholder equity. The debt to equity (D/E) ratio rose significantly during the past three years, from 1.8 in 2017 to 2.74 in 2019 (Yahoo Finance, 2020a). These numbers are substantially higher than the industry’s average of 0.01 (CSI Market, 2020). Thus, it may be concluded that ROE increases due to the aggressive utilization of debt to finance the development, which may be a possible threat for investors.
Table 1 below provides a summary of ROE, PM, TAT, and D/E ratio changes during the past three years in comparison with the industry’s average for 2019.
Table 1. Apple Inc.’s ROE Decomposition (CSI Market, 2020; Yahoo Finance, 2020a)
Profitability
Profitability is usually measured in PM ratio and return on assets (ROA) ratio. Table 2 below presents the changes in these two ratios for the past three years and compares them to the performance of competitors, including Samsung, Huawei, and Xiaomi.
Table 2. Apple Inc.’s Profitability (Yahoo Finance, 2020a; Yahoo Finance, 2020b; Yahoo Finance, 2020c; Yahoo Finance, 2020d)
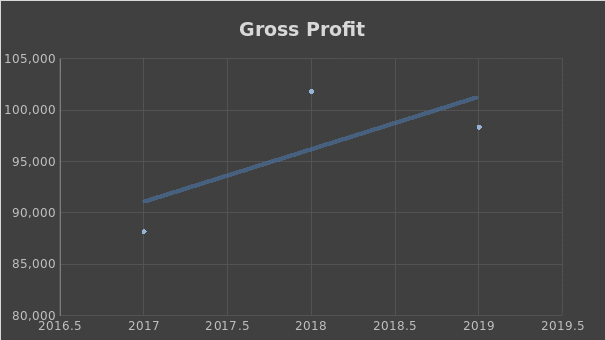
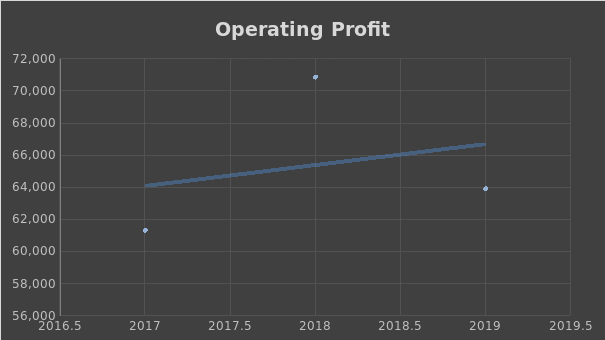
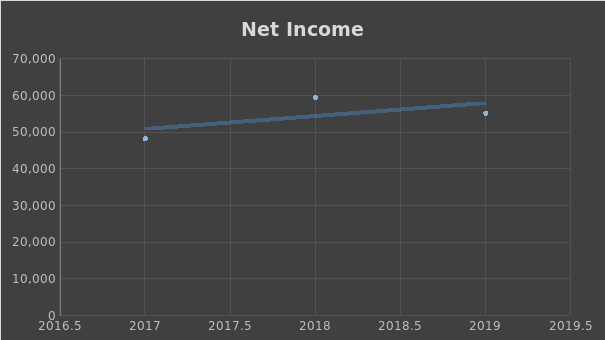
According to the analysis, Apple outperforms its major competitor in terms of both PM and ROA ratios. However, there were no significant changes in Apple Inc.’s profitability for the past three years. There were no significant changes in gross profit, operating profit, or net income for the last three years, which can be seen in Figures 1-3.
Efficiency
Efficiency is usually measured using the inventory turnover (IT) ratio, which demonstrates how efficient is the company in managing its inventory, and TAT ratio, which shows how well the company uses its assets to generate sales. Table 3 below includes changes in these two ratios and compares them to the efficiency of Apple’s competitors.
Table 3. Apple Inc.’s Efficiency (Yahoo Finance, 2020a; Yahoo Finance, 2020b; Yahoo Finance, 2020c; Yahoo Finance, 2020d)
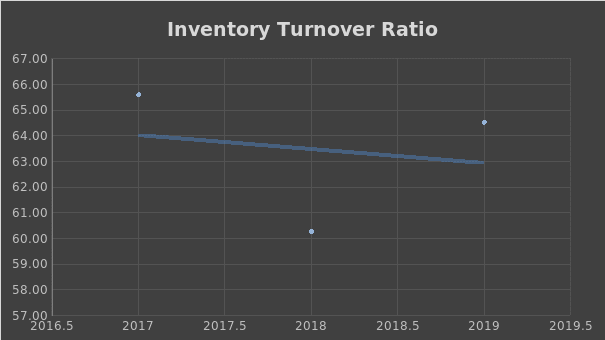
According to the analysis, Apple outperforms all the competitors in terms of IT, but lags behind Xiaomi in terms of TAT. This phenomenon can be explained by the revenue structure of the company. In 2019, Apple Inc. experienced a decline in sales of iPhones, but an increase in service sales (Apple Inc., 2020). Thus, even though inventory in 2019 increased in comparison with 2018, IT grew due to positive changes in net sales. The changes in TAT can be explained by the same factor. Figures 4 and 5 below picture the changes in Apple Inc.’s TAT and IT ratios correspondingly.
Leverage
Apple Inc.’s performance in terms of financial leverage is questionable, as it uses debt aggressively to generate income. Financial leverage is measured using D/E and debt to assets (D/A) ratios. Table 4 below demonstrates the changes in Apple Inc.’s leverage and compares it to the major competitors’ performance.
Table 4. Apple Inc.’s Leverage (Yahoo Finance, 2020a; Yahoo Finance, 2020b; Yahoo Finance, 2020c; Yahoo Finance, 2020d)
Table 4 demonstrates that Apple uses debt most aggressively in comparison with its major competitors. Even though the company has diminished its total liabilities from $259 billion to $249 billion, total assets also decreased, raising the D/A ratio. At the same time, total shareholder equity decreased due to a significant fall in the price of shares. The reasons behind the changes are global concerns, such as the US-China trade war, and a drop in iPhone sales (Apple Inc., 2020). In 2019, the company issued unsecured short-term promissory notes for general corporate purposes, including dividends, and repurchase of 92,629 shares. While debt can be harmful to companies, it did not have a negative effect on either liquidity or profitability.
Liquidity
Apple’s performance in terms of liquidity is satisfactory, as it has enough funds to cover current liabilities. The assessment of the company’s liquidity in comparison with three competitors is presented in Table 5 below.
Table 5. Apple Inc.’s Liquidity (Yahoo Finance, 2020a; Yahoo Finance, 2020b; Yahoo Finance, 2020c; Yahoo Finance, 2020d)
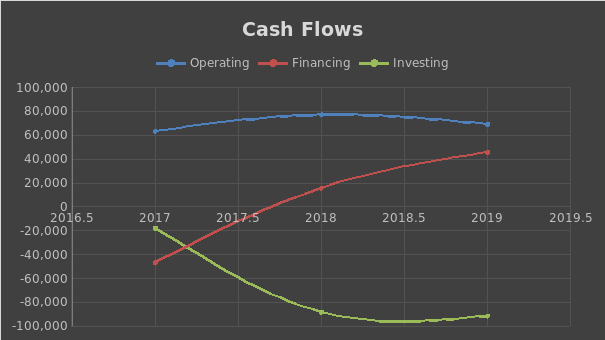
According to the analysis, Apple’s performance in terms of liquidity is improving even though the asset to equity ratio (A/E) is growing. In 2019, the current ratio increased from 1.13 to 1.54. These happened as the company increased its total assets and decreased its liabilities by repaying its short-term debt (Apple Inc., 2020). Moreover, in the previous year, Apple Inc. had an acid test ratio above 1, which was not the case in 2017 and 2018. However, in comparison with its competitors, Apple Inc.’s liquidity is lower than that of Samsung’s or Huawei’s. However, since the acid test and current ratios are slightly above 1, the company uses debt adequately to increase its sales. Figure 6 below demonstrates changes in the company’s operating, financing, and investing cash flows for the past three years.
Investment Recommendation
In 2019, Apple’s P/E ratio was 18.63, which indicates that the shares were significantly overvalued in comparison with earnings (Yahoo Finance, 2020). The P/S ratio was 3.96, which also demonstrates that the stocks were overvalued (Yahoo Finance, 2020). During the last year, the company increased per-share dividends from $2.4 in 2017 to $2.72 in 2018 and to $3 in 2019. This implies that the annual growth rate of dividends per share was 12.5% even though the company experienced a 2% decline in revenues in 2019 (Yahoo Finance, 2020) The matter can be explained by the aggressive stock repurchase campaign started by the company in 2018 (Apple Inc., 2020). Considering that the company expects to invest in the repurchase program, the market value of shares and dividends per share are expected to increase, given the company does not experience a significant decline in revenues in 2020.
However, before giving recommendations, it is crucial to estimate the intrinsic value of the company’s shares. First, it is central to calculate the dividend growth rate using the data for the past five years. The results of the calculations are presented in Table 6 below.
Table 5. Apple Inc.’s Dividend Growth Rate.
The analysis of the dividend growth rate demonstrates that the value remains relatively stable at 10.1% with an exclusion of 2018. Thus, it Gordon Growth Model (GGM) can be used to estimate the intrinsic value of the company. According to GGM, the intrinsic share price can be calculated using the following formula (Hayes, 2020):
![]()
Where:
- P = Current stock price
- g = Constant growth rate expected for dividends
- r = Constant cost of equity capital for the company (or rate of return)
- D1 = Value of next year’s dividends
To calculate intrinsic value, it will be assumed that the constant growth rate (g) is 10.5% as calculated in Table 6 and the value of the next year dividends (D1) 3.31, which can be calculated by adding 10.5% to dividend per share in 2019. Therefore, if the minimal rate of return an investor is willing to accept is 12%, the current stock price will be the following:
![]()
Because the intrinsic value $220.67 of is lower than the current value of $384.76, the stock qualifies for sell (Hayes, 2020).
References
Apple Inc. (2020). Annual report 2019. Annual Reports. Web.
CSI Market. (2020). Consumer electronics industry Financial strength information.
Hargrave, M. (2020). Return on Equity – ROE. Investopedia. Web.
Hayes, A. (2020). Gordon Growth Model – GGM Definition. Investopedia. Web.
Yahoo Finance. (2020a). Apple Inc. Web.
Yahoo Finance. (2020b). Huawei Culture Co., Ltd. Web.
Yahoo Finance. (2020c) Samsung Electronics Co., Ltd. (2020). Web.
Yahoo Finance. (2020d). Xiaomi Corporation. (2020). Web.
