Littlefield Technologies is a company that manufactures digital satellite system receivers and sells them to their customers. It recently opened a single factory in order to produce these receivers which don’t last long in the high tech market. This requires the factory to shut down after only 268 days of operation. During this time, the demand for these receivers was predicted to increase at a constant rate for about 5 months, level out for 1 month and then decrease at a steady rate until the factory runs out of production. My team was brought in to manage the capacity of the factory using this demand schedule in order to satisfy as many orders as possible.
The main problem my team was brought in to address was the capacity of the factory. If the capacity was not efficient, our lead times would begin to increase and our expected time of delivery on each order would not hold true to our promise, causing orders to be cancelled.
The aim was to examine why the company cannot address the customers’ needs satisfactorily. The production plant utilizes all the stations during the production process. However, it is unfortunate that it cannot attend to all the customers’ orders in time. Additionally, the production plant fails to complete many orders in station two. Therefore, some have to go through station three. The company incurs a very high production cost. However, its returns on investment remain low. The high production cost is attributed to the high cost of raw materials and improper negotiation with customers before processing an order.
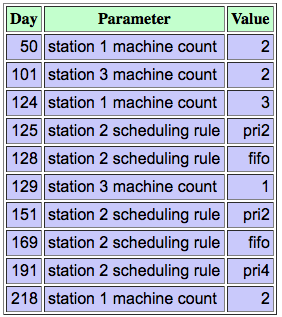
Within the factory, there are three stations that carry out four steps in order to assemble each device. The stations began with board stuffing then testing then tuning. The cost of a machine is dependent on which station the machine was being purchased for; some steps require more expensive machines. In order to determine when a machine needed to be bought or sold to maximize capacity, our team had to consider a number of elements. Some of the more important elements were the utilization, queue, lead time, demand and priorities of each station. Our solution to maximize capacity was to monitor these elements and buy or sell accordingly.
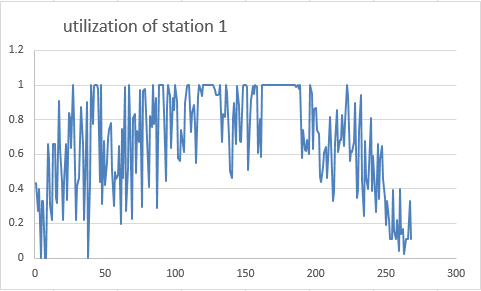
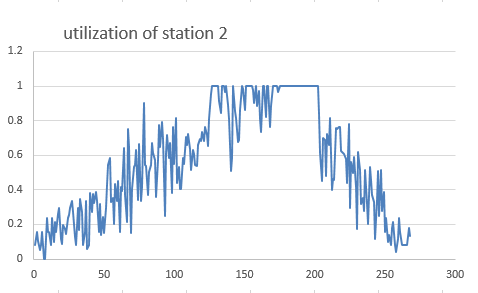
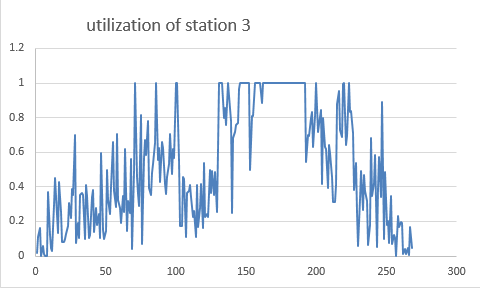
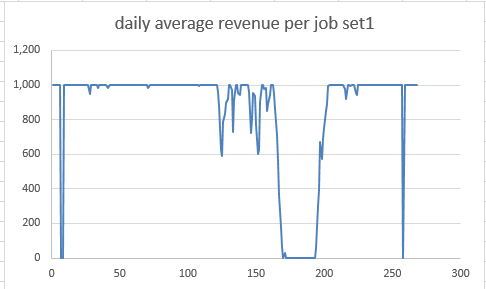
The utilization rate was one of the main indicators of when a machine needed to be bought at a station. This is because if the utilization rate is maxed out, a new machine is necessary so that the factory can handle more orders. The queue size also helped with determining when a new machine was needed because if the queue increases, it is evident that we do not have sufficient capacity for the orders being placed. Lastly, monitoring the lead times was very important as well because if our lead time increased to more than a day, the factory would have to turn down orders, therefore losing revenue. Looking at the graphs below, it is clearly noticeable where our capacity management was misjudged.
For each station, there is a span where the utilization rate was maxed out at each station because the demand was exceeding the capacity of the factory. Below are the graphs of the utilization rates for each station. My team and I did not purchase enough machines to handle the amount of orders being placed when the utilization is at 1. At this point, the stations are producing all that they can handle; the rest has to wait to be processed. This caused our queues to increase as seen in the graph below as well. At the same time the utilization and queues were at their highest, our revenue was at its lowest. We simply could not keep up with the demand because the capacity was mismanaged. We did not purchase enough machines to handle the demand when it was at its peak.
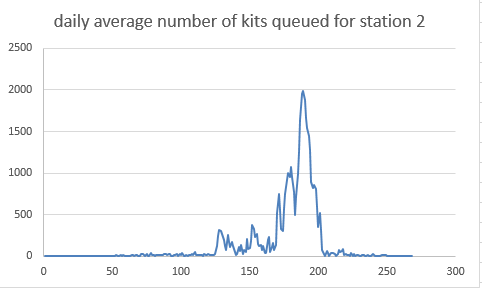
What we should have done is purchased multiple machines right before the demand peak. When the simulation began, our team only bought one machine at station 1 because that was all that was required to handle the amount of orders being placed. As demand continued to increase, we did not act accordingly and lost a large amount of revenue. We should have also changed the priority to Station 4 or Station 2 because this would have increased production rates and lessened the queues, which eventually built up to over 500. As our utilization was at 100% we hesitated to buy machines, decreasing the revenues and falling behind the demand capacity.
Overall, our team was timid to sacrifice current capital for future revenue. We had the capacity managed well at the beginning but underestimated the necessity of more machines when the demand increased. We should have bought more machines at all the stations right before the demand began to level out for a month. For future simulations, our team will be more cautious as to when the demand fluctuates and to act immediately instead of worrying about overall capital at that one moment.
History