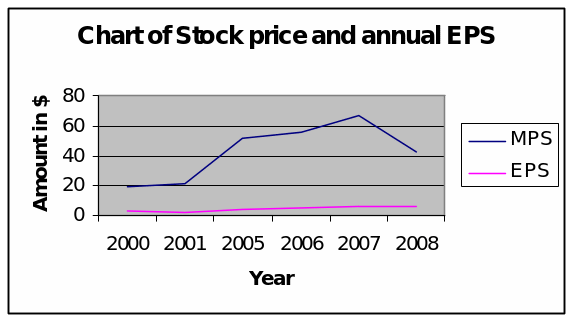
The company’s ticker symbol is CAT.

From the above chart we can see that the company’s stock price has been quite volatile, while the earnings per share have been fairly stable.
Overview of the company
Caterpillar is a manufacturing company which was founded in 1925 as Caterpillar Tractor Co, with its headquarters in Peoria, Illinois. In 1986, the name was changed to Caterpillar Inc. Caterpillar Inc operates in the Farm and Construction machinery industry, in the industrial goods sector. The company is engaged in the manufacture and sale of construction and mining equipment and machinery, engines, diesel and natural gas engines, forestry machinery; as well as the design, manufacture, remanufacture, maintenance, and service of rail-related products. The company also offers remanufacturing and logistics services to other companies, as well as financing and insurance services to its customers and dealers for the company’s products. Caterpillar uses distribution centers to market its products. The company’s main competitors are CNH Global NV., and Komatsu Ltd Spons AD.
ROE component analysis
Caterpillar’s Return on Equity = (Net Income / Sales) * (Sales / Total Assets) * (Total Assets / Shareholders’ Equity)
Return on Equity = (3,557/ 51,324) * (51,324 / 67,782.0) * (67,782.0 / 8,883.0)
Return on Equity = 0.0693 * 0.7572 * 7.63
Return on Equity = 0.4 or 40 %
CNH’s Return on Equity = (Net Income / Sales) * (Sales / Total Assets) * (Total Assets / Shareholders’ Equity)
Return on Equity = (825/ 18,476) * (18,476/ 25,459) * (25,459 / 6,454)
Return on Equity = 0.045 * 0.726 * 3.94
Return on Equity = 0.13 or 13 %
Komatsu’s Return on Equity = (Net Income / Sales) * (Sales / Total Assets) * (Total Assets / Shareholders’ Equity)
Return on Equity = (795,929 / 20,421,646) * (20,421,646 / 19,889,485) * (19,889,485 / 8,231,727)
Return on Equity = 0.039 * 1.027 * 2.42
Return on Equity = 0.097 or 9.7 %
From the computations above, it is evident that Caterpillar’s Du Pont Return on Equity is far much higher than that of its competitors.
Analysis of the company’s trend of sales revenue and net income
Consolidated Results of Operations for the Years Ended December 31
(Dollars in millions except per share data)
From the above income statement, it is evident that the company’s sales revenue increased by 14.3 % between 2005 and 2006, then it increased further by 7.96 % between 2006 and 2007 and increased even further by 14.5 % between 2007 and 2008. It then dropped by 38.5 % between 2008 and 2009.
The company’s net income increased by 23.9 % between 2005 and 2006, then it increased slightly by 0.11 % between 2006 and 2007 and increased again slightly by 0.45 % between 2007 and 2008. It then dropped sharply by 74.8 % between 2008 and 2009.
Analysis of the company’s Long Term Assets
From the table above, we can see that the only intangible asset that the company has is goodwill, which only accounts for 6.3 % of total long term assets.
It is also evident that the company’s assets are fairly old, since accumulated depreciation accounts for 50.4 % of the Gross Property Plant and Equipment value.
Summary
Caterpillar Inc has been a very good company to invest in, since it has been offering its shareholders the highest return on their investment as compared to the other companies in the same industry. However in 2009, the performance was very poor, evidenced by the sharp drop in sales revenue and net income. The cause of this drop needs to be investigated in order to put the company back on track.

