Financial performance is an essential aspect of financial risk management. In a broader sense, it is defined as the degree to which a firm’s business objectives are being attained. As a result, it is utilized in measuring the overall financial health over a given duration. It can also be employed in comparing firms across the same industries, or industries in aggregation. Performance can be evaluated with the help of an analysis, which entails the use of financial statements. These statements comprise data outlining the commercial activities of an individual, business or entity; moreover, in most instances, they are reported in a manner consistent with the Generally Accepted Accounting Principles (GAAP). This ensures that a company’s financial status accurately represents their financial status. There are three types of statements that are usually used; however, this paper will focus on only the income statement.
Income Statement
The income statement, also known as the profit and loss statement, provides an account of a firm’s revenue and expenses, and indicates its total profit or loss over a period of time. Most entities prepare monthly income statements for use by the management, and quarterly and annual statements for creditors and investors, among other outsiders. Therefore, it is used to reflect the financial status of a firm by its ability to report profitability. As per the Ford Motor Company 2012 Annual report, this is achieved through the analysis of several major categories, which comprise revenue, cost of goods sold, general and administrative expenses, interest expense, taxes and net income. Revenue constitutes the total sales, including other sources of income, such as rents, interest and dividends. Second, the cost of goods sold measures the direct cost incurred in the production of products and services. On the other hand, the interest expense outlines the expenses associated with the cost of borrowing or use of capital leases. Lastly, net income is the amount of accounting profit that an entity has remained with after paying off all its expenses.
Recommendations regarding the financial strength of a company, are based on the findings obtained from the successful analysis of the income statement. This is achieved through comparing different line items within the statement, and following trend lines of individual items across multiple periods. Therefore, this will facilitate the comprehension of the business cost structure and its ability to earn profit. An income statement analysis involves the comparison of year-over-year numbers (horizontal analysis) and ratio analysis (Bragg, 2020). The horizontal analysis comprises evaluating seasonality and tax rates, while ratio analysis entails examining the gross margin, contribution margin, operating margin and net profit margin ratios.
Ford Motor Company Income Statement Analysis
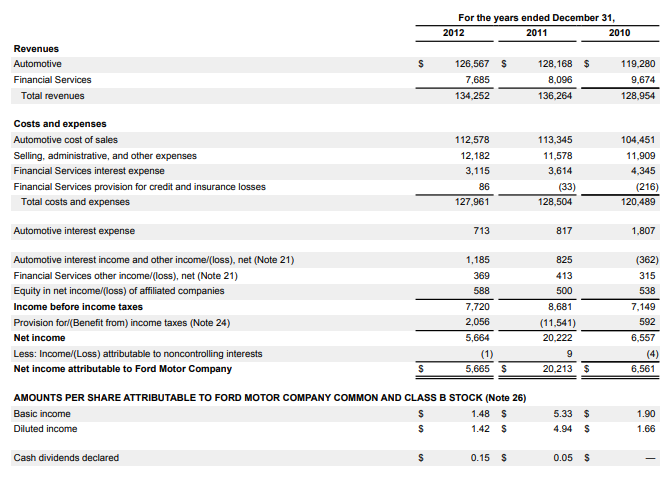
Starting from the top, it can be seen that Ford Motor Company has two streams of revenue – automotive and financial services – which when combined, form the total revenue. The automotive segment significantly contributes to the total revenue earned as compared to the latter (Ford Motor Company, 2012). In addition, there was no gross profit subtotal since the cost of sales was grouped with other expenses.
Net income margin
It is a type of profitability ratio, which is used to measure the total income generated in relation to a firm’s sales. It shows the percentage of revenue available after the deduction of all expenses.
2012: Net income = $7,720 2011: Net income = $8,681
Total revenue = $134,252 Total revenue = $136,264
Ford Motor’s net income margin decreased from 2011 to 2012. This is represented by the values in 2012 and 2011, which were 5.8% and 6.4%, respectively.
Gross margin ratio
It is a type of profitability ration that compares the gross margin of an entity to its revenue.
2012: Total revenue = $134,252 2011: Total revenue = $136, 264
Total cost = $127,961 Total cost = $128,504
The gross margin as of 2012 was 4.7%, and this is a reduction from the 2011 gross margin, 5.7%. A lower profit margin suggests that a lower margin of safety and the increased risk that the decrease in sales will erase profits and lead to a net loss or negative margin.
Earnings before Interest and Taxes (EBIT) margin
It indicates a firm’s profitability from its operations excluding non-recurring items. For most entities, this figure is similar to the operating profit.
2012: 2011: 2010:
Total revenue = $134,252 Total revenue = $136, 264 Total revenue = $128,954
Total cost = $127,961 Total cost = $128,504 Total cost = $120,489
EBIT = $6,291 EBIT = $7,760 EBIT = $8,465
Overall, it is evident that the EBIT value in Ford Motor Company reduces over time.
Earnings per share (EPS)
It measures a firm’s profitability based on the outstanding share of common stock. In normal circumstances, the diluted EPS is often less than the basic EPS. This is mirrored in the income statement, in 2012, when the diluted income stock is less than the basic income stock ($1.48 < $1.42) (Ford Motor Company, 2012). Therefore, indicating that the convertible bonds are dilutive. Furthermore, a higher EPS in 2011 than in 2012 suggests that Ford Motor had more money to either pay out as dividends or reinvest in the business itself in 2012 as compared to 2011.
Conclusion
Income statements reveal much more information when comparisons are made with previous years. Overall, Ford Motor Company indicated a decrease in valuation metrics from 2010 to 2012. Therefore, suggesting that the company’s financial health is decreasing.
References
Bragg, S. (2020). Income statement analysis. Accounting Tools. Web.
Ford Motor Company. Ford Motor Company: 2012 annual report. Web.
Appendix: Ford Motor Company and Subsidiaries Consolidated Income Statement (in millions, except per share amounts)