Executive Summary
This research paper entails an evaluation of how organizations can analyse and interpret financial statements. Some of the users of financial statements include “managers, customers, investors, creditors, and regulatory agencies” (Drake & Fabozzi, 2012, p.43). These users have diverse information needs. Consequently, it is imperative for organizations to ensure that they supply the necessary information to the aforementioned stakeholders. The paper gives the various methods that are applicable in analyzing financial statements, with a special interest in ratio analysis. Various types of financial ratios are discussed. A number of examples are provided in an effort to illustrate and interpret financial ratios. The paper highlights the importance of integrating various types of financial ratios in order to improve the usefulness of financial statements to various stakeholders.
Introduction
Financial statement analysis and interpretation provide a perfect opportunity for one to understand the information presented in the statements. The most common financial statements include “a balance sheet, cash flow, and income statements” (Drake & Fabozzi, 2012, p.86). The information presented in the financial statement is utilized by both internal and external stakeholders. Analyzing and interpreting financial statements to provide the stakeholders with indicators and trends regarding a particular organization. According to Drake and Fabozzi (2012), the information needs of stakeholders vary depending on the decision that the users intend to make. The users of financial statements may experience information overload from the detailed data provided, which highlights the importance of analyzing and interpreting the data provided through the financial statement. Various methods and techniques are used in the process of analyzing financial statements. These methods include “horizontal analysis, trend analysis, vertical analysis, and ratio analysis” (Edwards & Ivancevich, 2010, p.72). Ratio analysis entails analyzing the relationship of various financial statement totals. Two main categories of financial ratios can be used in analyzing financial statements and they include measures of profitability and measures of an organization’s debt-paying ability. This paper entails an analysis of financial statements using the ratio analysis method.
Measures of debt-paying ability
Various ratios can be used in determining an organisation’s ability to pay its debts. An example of such ratios includes liquidity ratios and solvency ratios. The ratios are mainly based on an organisation’s current liabilities and assets. The main liquidity ratios include working capital, current ratio, inventory ratios, quick ratio, current ratios, accounts receivable turnover, and net sales to working capital.
Working capital ratio
This ratio is calculated by obtaining the “difference between current assets and current liabilities” (Edwards & Ivancevich, 2010, p.61). Current liabilities include debts that an entity should pay within its current financial period. On the other hand, the term current assets underscore assets that can be changed into liquid money readily. Consequently, working capital is used to determine the excess amount of money or funds that an organisation has in order to sustain its operations. By maintaining an acceptable amount of working capital, an organisation can protect itself from short-term debt-paying challenges.
An organisation’s working capital does not provide the users of financial information with absolute information, as working capital only provides the difference between current assets and current liabilities. However, the relationship between current assets and current liabilities can be expressed as a ratio. This ratio is referred to as “the current ratio or the working capital ratio calculated by dividing an organisation’s current assets by the current liabilities” (Kieso et al., 2011, p.94). The chart below shows a comparison of the current assets and liabilities of two companies X and Y during their 2012 financial year.
The chart shows that the two companies have an equal amount of working capital. However, their working capital ratio differs as illustrated below.
Company X = Current assets =168,000 =3.65:1 / Current liabilities 46,000
Company Y= Current assets =500,000 =1.32:1 / Current liabilities 378,000
The calculations above show that company X has a strong working capital compared to company Y. Therefore, Company X is in a position to meet its current debt obligations more effectively compared to Company Y.
Quick ratio
This ratio is also referred to as acid-test ration. The ratio is used to “determine an organisation’s immediate debt-paying ability” (Lee, 2006, p.111). Consequently, it only takes into account the most liquid assets, which include the current marketable securities, receivables, and cash. Current assets, which are less liquid such as prepaid expenses and stock/inventories, are not included. The following formula is used in the process of calculating quick ratio.
Quick ratio= Quick assets/Current liabilities
Using the formula above, Company X quick ratio can be calculated as follows.
168,000/46,000= 2.04:1
Accounts receivables ratioIf the company’s quick ratio in 2013 increases to 2.28:1, it shows that its ability to meet its current debt obligations is affected adversely.
In the course of their operation, most organisations aim at maximising their sales revenue. Offering customers credit is one of the strategies that organisations use in their quest to maximise revenue. However, it is imperative for organisations to ensure that they minimise expenses due to bad debts. Therefore, firms should ensure that they maximise their debt collection without losing customers. Two main ratios can be used in the process of determining an organisation’s debt collection period and they include the accounts receivables turnover and the average collection period. The accounts receivable turnover is calculated by dividing the net credit sales by the average accounts receivables. Lin, Liu, and Liang (2010) define net credit sales as “the total sales on account less sales discount and returns” (p.54). The chart below illustrates Company X accounts receivables turnover.
This analysis shows that Company X average receivables turnover during its 2012 financial year is approximately 15.23 times. Mohana and Rao (2011) assert that a company with a high rate of receivables turnover can collect its debts more effectively. On the other hand, a firm that has a relatively low rate of receivables turnover may experience problems in its quest to meet its short-term debt obligations. Based on the accounts receivable turnover, Company X average days to collect its receivables can be determined as illustrated below.
Average number of days to collect receivables = 365 days /15.23 =24 days
This analysis shows that the Company took 24 days to collect its receivables, which represents a relatively short duration within which the firm collects its receivables. Therefore, one can assert that the firm is very effective in meeting its current financial obligations.
Inventory ratios
Effective inventory management is paramount in an organisation’s effort to maximise its sales revenue. According to Heflin and Shaw (2000), too much inventory increases an organisation’s holding cost such as insurance costs. Moreover, the inventory may become obsolete. On the other hand, too little stock means that an organisation may have dropped in sales’ margins or experienced other hitches in production and so forth. Inventory turnover ratio is used to determine the effectiveness of an organisation in managing inventory. The ratio illustrates the number of times that a company replenishes its stock within one year. Inventory turnover ratio is calculated by “dividing the cost of goods sold by the average inventory calculated by dividing the sum of opening and closing inventory” (Heflin & Shaw, 2000, p.5). The chart below illustrates the calculation of inventory turnover.
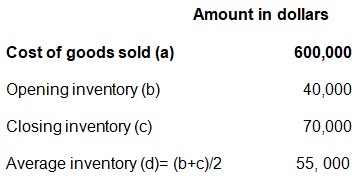
Inventory turnover =Cost of goods sold / Average inventory =600,000/55,000= 10.9 times
The firm’s inventory turnover ratio is 10.9, which is relatively high, and it shows that Company X is very effective in managing its inventory.
Solvency ratios
According to Ryu and Jang (2004), solvency ratios are useful in determining an organisation’s long-term debt paying ability. Moreover, solvency ratios are also useful in illustrating an organisation’s financing structure. One category of individuals who are concerned with solvency ratios includes the creditors. Moyer, McGuigan, and Kretlow (2008) are of the opinion that creditors are concerned with whether their customers will be in a position to repay their debt obligations. A high solvency ratio shows that an organisation is in a position to settle its debts. Stockholders are concerned with an organisation’s investment decisions. Organisations should minimise their investment risk. Various solvency ratios can be used to analyse an organisation’s long-term debt-paying ability. Some of these ratios include “debt ratios, plant-assets to long-term liabilities, and the number of times that the interest is earned” (Moyer, McGuigan & Kretlow, 2008, p.54).
Debt ratios
The two main categories of debt ratios include debt to asset ratio and debt to equity ratios. Debt to asset ratio is used to determine organisations’ assets that are financed using debt. On the other hand, “debt to equity ratio is used in determining the proportion of the creditor to owner financing it is calculated by dividing an organisation’s total liability by the total stockholders’ equity” (Moyer, McGuigan & Kretlow, 2008, p.57). On the other hand, debt to assets ratio is calculated by dividing the total assets by the total assets. Applying these formulas to Company X, the following results are obtained.
Using the information above, the company’s debt to asset ratio is calculated as
Debt to asset ratio=Total liabilities / Total assets = 166,000 / 508,000 =33%
Debt to equity= 146,000 / 362,000 =0.45: 1
The figures show that the company financed 33% of its assets using debt finance. Moreover, the company’s liability to every dollar of the stockholders’ equity is 0.4.
Number of times interest is earned
This ratio “is used to determine an organisations burden of paying interest” (Tugas, 2012, p.88). In most cases, this ratio is used to evaluate an organisation’s financial risk. Moreover, creditors use the ratio to determine an organisation’s ability to pay periodical interest. A ratio of 2 times or more is considered adequate in protecting the lenders’ interest in a particular organisation. However, a very high ratio indicates that a particular organisation is not effective in taking advantage of the available debt facilities. The ratio is calculated by “dividing the Earnings Before Interest and Tax (EBIT) by the interest expense” (Tugas, 2012, p.89). The chart below illustrates the Company’s performance during its 2012 financial year.
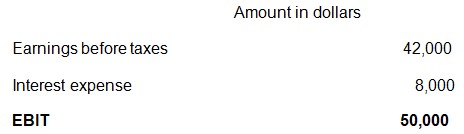
Plant-assets to long-term liabilitiesTimes interest is earned = 50,000 / 8,000 =6.25 times
The ratio is used in determining an organisation’s effectiveness in managing long-term debts. In the course of their operation, companies use their plant assets as collateral in obtaining credit finance from various financial institutions. However, financial institutions evaluate an organisation’s strength with regard to the asset base before advancing loan facilities. Long-term assets “should be financed using long-term liabilities” (Kieso et al., 2011, p.119). Similarly, short-term assets should be financed using short-term liabilities. The ratio is calculated using the following formula.
Net plant asset/Long term liabilities
Amount in Dollars
Net plant assets 300,000
Bonds 100,000
Plant asset to long-term liabilities = 300,000/100,000
=3:1
Profitability ratios
Tugas (2012) defines profitability as an organisation’s ability to generate earnings. Both internal and external stakeholders use financial statements to determine an organisation’s ability to generate profits. Profitability ratios can be categorised into two main groups, which include those that are used in measuring an organisation’s managerial effectiveness and stock market ratios.
Managerial effectiveness measure
These ratios measure the “proportion of sales that results into earnings coupled with how effective an organisation’s assets can be used in generating sales” (Kieso et al., 2011, p.119).
Net margin
This ratio is “calculated by dividing the net income by the net sales” (Kieso et al., 2011, p.119). A high net margin is an indicator of an organisation’s strength.
Asset turnover ratio
The ratio is used in determining the “proportion of sales revenue generated for every dollar invested in an organisation’s assets calculated by dividing net sales by the average total assets” (Kieso et al., 2011, p.120). The chart below illustrates Company X asset turnover.
Return on Investment
This ratio is used to determine an organisation’s earning power. It illustrates the proportion of an organisation’s net income to its total average assets. A high rate of return on investment shows that an organisation has a very strong financial performance. Return on Investment is calculated by “dividing the net income by the average total assets” (Moyer, McGuigan & Kretlow, 2008, p.93).
Return on assets (ROA)
The ratio is used to analyse the ability of a business in generating profit using its assets. A high ROA shows that an organisation is effective and efficient in utilising its assets. During its 2010, Kentucky Fried Chicken (KFC) was estimated to be 3.97%, which represents a relatively low rate of return on assets hence meaning that the firm is not effective in utilising its assets.
Return on Equity
The ratio is used to determine the profitability of shareholders’ investment. In most cases, Return on Equity (ROE) is higher than the return on investment due to the financial leverage. Drake and Fabozzi (2012) define financial leverage to include debt finance that is used to secure assets. ROE indicates the effectiveness with which a firm re-invests its earnings in order to generate additional earnings. ROE is calculated by “dividing the net income by the average total shareholders’ equity” (Moyer, McGuigan & Kretlow, 2008, p.95). This is well illustrated by the calculation below.
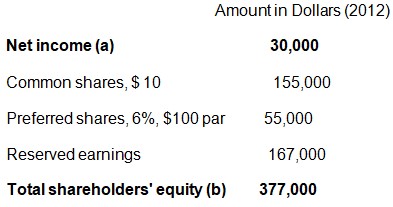
Return on equity = a÷b= 30,000/377,000=7.96%
Stock market ratios
Potential investors rely on various ratios in the process of making investment decisions. Some of the components that investors are concerned with include the company’s dividends and earnings. Investors use these components in making decisions on whether to purchase shares.
Investors can rely on a number of stock ratios including earnings per share, book value, price earnings ratios, and dividend earnings. The earnings per share [EPS] is calculated by “dividing the net earnings available for distribution to common shareholders by the average outstanding common shares” (Tugas, 2012, p.46). The book value per share is calculated using the following formula.
[Shareholders’ equity-Preferred rights] ÷ [Outstanding common shares]
The price-earnings ratio is used to compare the EPS of a particular organisation with prevailing market price. Price-earnings ratio is calculated by dividing the market price per share by the EPS.
Conclusion
In the course of their operation, businesses are required to prepare financial statements, which are used by various internal and external stakeholders. Their significance arises from the fact that they play a critical role in indicating the performance of an organisation. However, the information presented in the financial statements may be voluminous. Therefore, the intended users may not benefit as expected due to information overload, which underscores the importance of analysing and interpreting the financial statements. Various methods and techniques can be used to analyse the financial statements. The main methods include horizontal analysis, trend analysis, vertical analysis, and ratio analysis. The main categories of financial rations that can be used in the process of interpreting financial statements include profitability ratios, leverage ratios, liquidity ratios, and efficiency or activity ratios. Profitability ratios provide users of with information on the effectiveness of a firm in generating earnings.
Financial ratios provide sufficient information that users such as the managers can use to compare a firm’s performance with that of its competitors and the industry average. Additionally, managers can use financial ratios to understand the firm’s trend. As a result, a firm can be able to implement the necessary changes.
Recommendations
In a bid to ensure that the users of financial statement understand the information presented through various financial statements, it is imperative for organisations to take into account the following issues.
- Firms should integrate various types of methods of financial statement analysis in order to eliminate information overload amongst the users.
- Organisations should integrate various types of financial ratios in order to meet the information needs of various internal and external stakeholders.
Reference List
Drake, P., & Fabozzi, F. (2012). Analysis of financial statements. Hoboken, NJ: John Wiley & Sons.
Edwards, H., & Ivancevich, E. (2010). Managerial accounting. New York, NY: Freeload Press.
Heflin, F., & Shaw, K. (2000). Adverse selection, inventory holding cost and depth. Journal of Financial Research, 2(3), 1-7.
Kieso, D., Weygndt, J., & Warfield, T. (2011). Intermediate accounting. Hoboken, NJ: John Wiley.
Lee, T. (2006). Financial reporting and corporate governance. Chichester, UK: John Wiley & Sons.
Lin, W., Liu, C., & Liang, G. (2010). Analysis of debt-paying ability for a shipping industry in Taiwan. African Journal of Business Management, 4(1), 77-82.
Mohana, R., & Rao, R. (2011). Financial statement analysis and reporting. New York, NY: PHI Learning.
Moyer, R., McGuigan, J., & Kretlow, W. (2008). Contemporary financial management. New York, NY: Cengage Learning.
Ryu, R., & Jang, S. (2004). Performance measurement through cash flow ratios and traditional ratios: A comparison of commercial and casino hotel companies. Journal of Hospitality Financial Management, 12(1), 16-28.
Tugas, F. (2012). A comparative analysis of the financial ratios of listed firms belonging to the education subsector in the Philippines for the year 2009-2011. Manila, Philippines: De La Salle University.