Recognition and Experience
The findings show that a significant proportion of employees do recognize SS and RE in DEWA. According to Table 1, most employees (46.3%) have participated in the implementation of SS in DEWA as team members while 27.8% and 25.9% participated as project managers and consultants respectively.
Regarding experience in the field of SS, Table 2 shows that most employees in DEWA (33.3%) had experience of 1-3 years followed by 22.2% who had experience of less than one year. Moreover, employees with 4-6 years and 7-10 years of experience had the same proportion of 13% whereas the ones without experience comprised 9.3% employees. Employees with over 10 years of experience constituted 9.3% of employees.
Comparatively, Table 3 depicts the distribution of employees with experience in RE. Most employees (22.2%) had experience of 1-3 years followed by 20.4% of employees with experience of less than one year. Furthermore, 18.5%, 14.8%, 13%, and 11.1% had experience of over 10 years, 7-10 years, 4-6 years, and no experience respectively.
The senior management considers SS necessary because it promotes good governance, improves the quality of services, and enhances efficiency. According to Kumar (2015), SS is an essential tool of governance for it promotes accountability, transparency, efficiency, and management processes in an organization.
Implementation of SS
In the implementation of SS in DEWA, 61.1% of employees (20.4% strongly agree and 40.7% agree) state that the implementation of SS has been timely, premature, post-due, thoroughly planned, sufficiently funded, supplied with necessary materials and resources, carefully implemented, sufficiently monitored, and successfully implemented. In contrast, 5.6% and 9.3% of employees strongly disagree and disagree to the implementation of SS respectively. However, 24.1% of employees remain undecided regarding the implementation of SS.
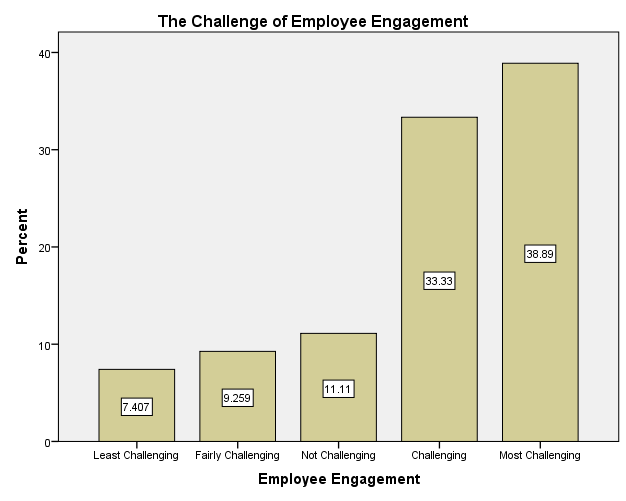
In the aspect of implementing SS, the employees experienced numerous challenges. Figure 1 illustrates that most employees (38.89%) rated employee engagement as most challenging and 33.33% rated it as challenging. A small proportion of employees (7.41%) rated employee engagement as least challenging while 9.26% and 11.11% rated it as fairly challenging and not challenging respectively. Sun and Shen (2014) explain that teamwork is the main driver of employee engagement in an organization.
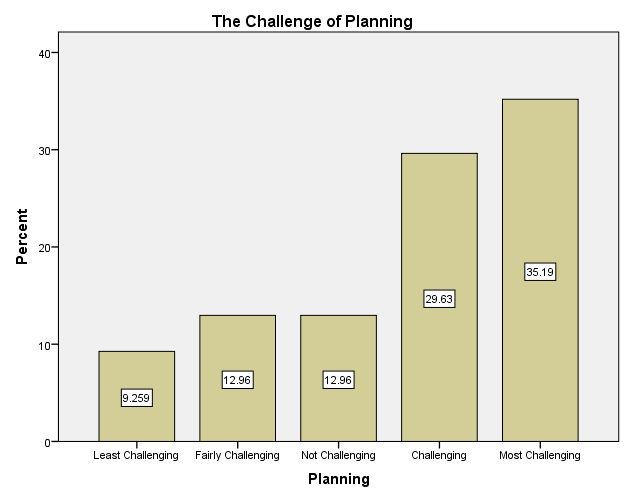
Similarly, Figure 2 shows that most employees (35.19%) rated planning as the most challenging followed by 29363% who rated it as challenging. Comparatively, 9.26%, 12.96%, and 12.6% of employees rated planning as least challenging, fairly challenging, and not challenging respectively.
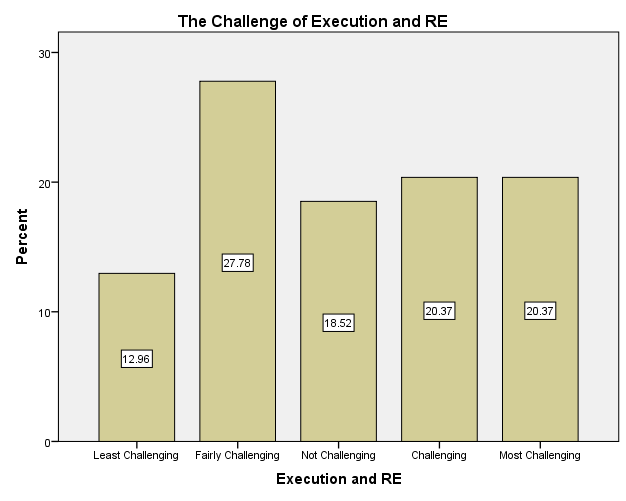
In the aspect of execution and re-engineering, the findings (Figure 3) show that most employees (27.78%) perceived it as fairly challenging while the same proportion of employees (20.37%) perceived it as challenging and most challenging. However, 9.26% employees rated planning as least challenging while 12.96% remained undecided.
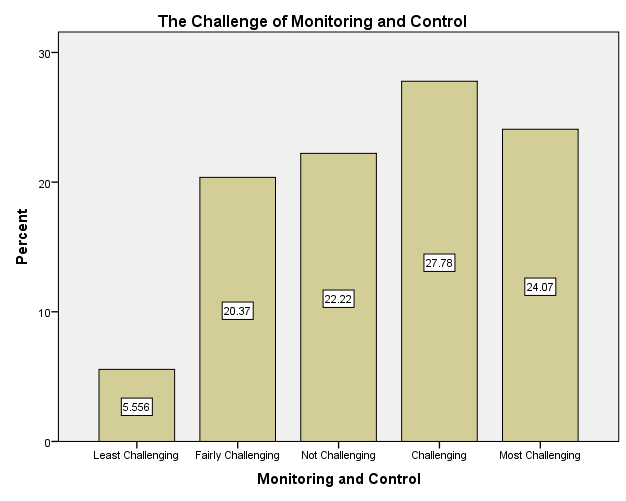
Concerning the aspect of monitoring and control, the findings in Figure 4 shows that most employees (27.78%) rated it as challenging followed by 24.07% who rated it as most challenging. Relatively, 5.56%, 2.37%, and 22.22% rated monitoring and control as least challenging, fairly challenging, and not challenging, correspondingly.
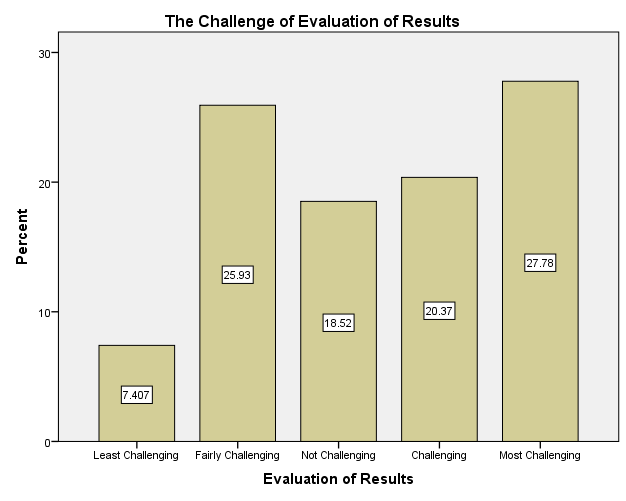
The findings in Figure 3 demonstrates that 27.78% of employees rated evaluation of results as the most challenging and 20.37% rated it as challenging. In comparison, 7.41% rated evaluation of results as least challenging, 25.93% rated it as fairly challenging, and 18.52% rated evaluation of results as not challenging.
Implementation of RE
In the assessment of the RE process involved in the implementation of SS in DEWA, Table 5 illustrates that most employees 38.9% and 31.5% agree and strongly agree that the RE process is timely, premature, post-due, thoroughly planned, sufficiently funded, supplied with necessary materials and resources, carefully implemented, sufficiently monitored, and successful. In contrast, 9.3%, 13%, and 7.4% of employees strongly disagreed, disagreed, and remained undecided in their assessment of the extent of RE implementation. Comparison of SS implementation and RE implementation shows that they have a significant relationship, in line with the observation of Mola, Pennarola, and Za (2015).
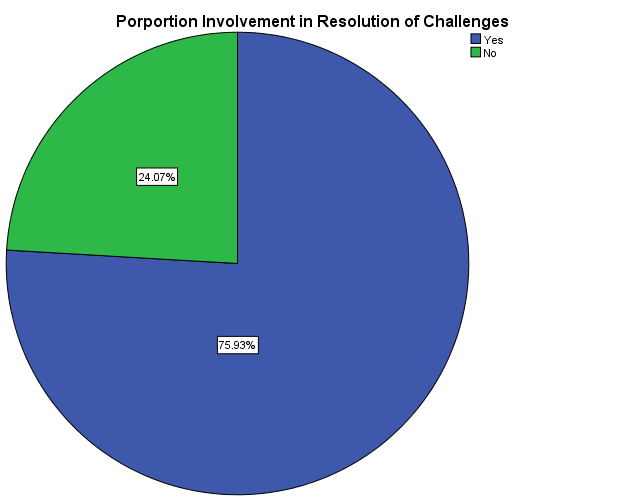
In the resolution of challenges, 75.93% stated that they have participated in the resolution of diverse challenges while the remaining 24.07% stated that they have not participated in the resolution of any form of challenges. The challenges entailed planning, adoption, implementation, monitoring, assessment, team management, and achievements of objectives.
Assessment of Goals and Objectives
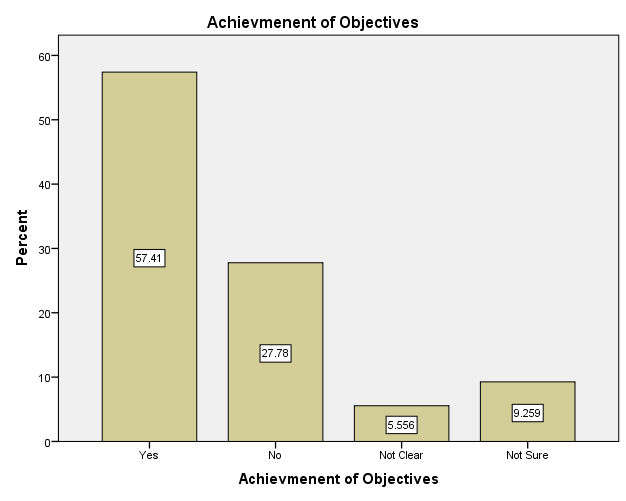
In their assessment, most employees (57.41) perceive that the project has achieved or in the process of achieving expected goals and objectives while 27.78% of employees perceive that the project has not achieved its goals and objectives.
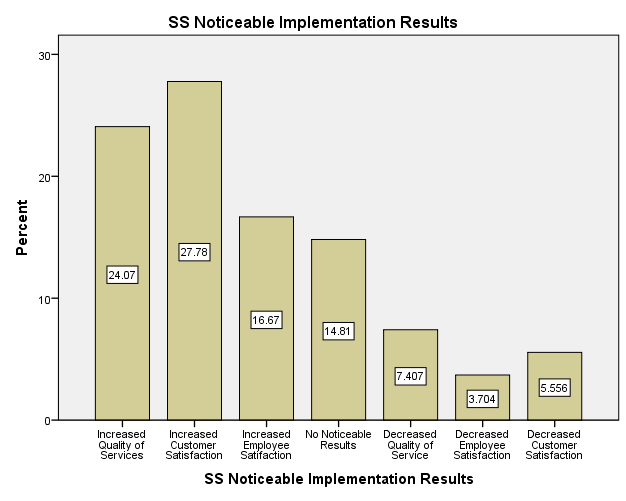
Following implementation of SS, the employees noted that there are noticeable results. Figure 8 shows that 24.1% of employees observed that SS implementation increased the quality of services, 27.8% observed that it increased customer satisfaction, and 16.7% observed that it increased employee satisfaction. In contrast, small proportions observed that SS implementation decreased the quality of service (7.4%), employee satisfaction (3.7%), and customer satisfaction (5.6%).
From their personal perspective, most employees perceive that SS is necessary for DEWA because it improves their working experience, enhances efficiency in the workplace, and provides satisfactory outcomes.
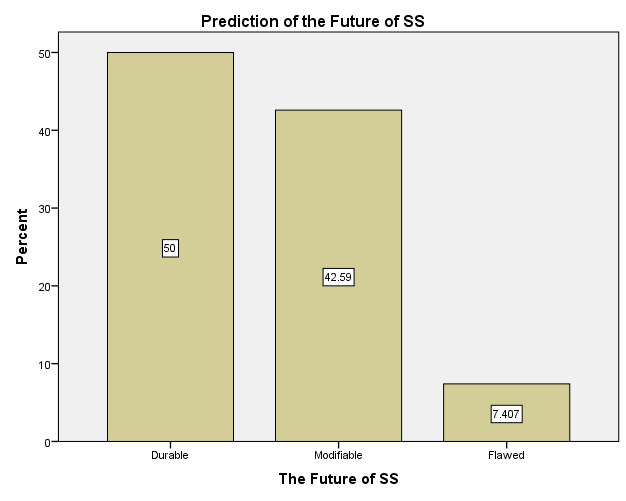
In predicting the future of DEWA, Figure 6 depicts that most employees (50%) predict that SS is durable while 42.59% predict that SS is modifiable. These findings reflect the assertion of Klischewski (2011) that resilience and responsiveness to changing dynamics are key attributes of SS. However, 7.41% predict that the future of SS is flawed.
Recommendations
Therefore, based on the findings, the continued improvement of DEWA’s SS requires training of managers and employees to enhance adoption and implementation of SS and RE (Al-Jenaibi, 2016; Hashmi & Khanna, 2016). Moreover, experts are necessary to aid in overcoming challenges associated with planning, implementing, evaluating, monitoring, and troubleshooting of issues.
References
Al-Jenaibi, B. (2016). Upgrading Society with Smart Government. International Journal of Information Systems and Social Change, 7(4), 20-51. Web.
Hashmi, G., & Khanna, P. (2016). E-governance: A journey of challenges, failures, and success in India. International Journal of Innovative Research in Computer and Communication Engineering, 4(5), 8366-8373. Web.
Klischewski, R. (2011). Architectures for tinkering? Contextual strategies towards interoperability in E-government. Journal of Theoretical and Applied Electronic Commerce Research, 6(1), 26-42. Web.
Kumar, V. (2015). E-Governance for Smart Cities. New York, NY: Springer.
Mola, L., Pennarola, F., & Za, S. (2015). From information to smart society. Cham, Germany: Springer.
Sun, G., & Shen, J. (2014). Towards organizing smart collaboration and enhancing teamwork performance: A GA-supported system oriented to mobile learning through cloud-based online course. International Journal of Machine Learning and Cybernetics, 7(3), 391-409. Web.