Introduction
This project paper discusses Teco Energy Company, a public company, which is listed on the NYSE market. Teco Energy is a diversified utility holding company. Teco Energy Company’s main operating subsidiary is Tampa Electric Company which is an electric utility serving 672,000 customers in West-central Florida (Teco Energy 5- 8). Other operating subsidiary companies are those involved in the transportation of coal and bulk commodities by water, coal mining, and gas production and development. Also, Teco trades in real estate investment, transfer, and storage, an operation terminal in New Orleans, and its power generating facility. Principal subsidiaries of Teco Energy Incorporation include Tampa Electric Company, Teco Power Services Corporation, Teco Diversified Incorporation, Teco Coal Corporation, Teco Coalbed Methane Incorporation, Teco Properties Incorporation, and Teco Transport and Trade Corporation (Teco Energy 12).
Problem statement
This project research aims to establish the viability of buying, selling, or holding Teco energy shares. This will be done through data analyses of the company’s previous financial year’s performance at the New York Stock Exchange. The data will be analyzed by carrying out a financial ratio analysis and comparing earning ratios and return ratios with S&P 500 tracking. Also, the volatility of stock performance will be analyzed through beta and alpha analysis. The data to be used in calculating the ratios are those of fiscal years 2009 and 2010.
Literature review
Teco Energy Incorporation falls under the energy sector of the U.S.A. The Energy sector in the U.S.A is ranked as the third industry in the economy (Teco Energy 9). The energy sector refers to, the stock category that is related to the production and supply of energy. The sector is made up of companies that are involved in the exploration and development of gas, coal, and oil as well as integrated power firms. Energy companies in the U.S.A are involved in the production of oil, natural gas, renewable energy, nuclear power, coal, and electricity technologies. Teco energy incorporation is an energy-related diversified holding company. It serves West Central Florida through various subsidiaries by providing retail electric supply. Additionally, the company sells and buys natural gas for residential, electric power generation, and coal operations.
Teco energy incorporation is traded as an S&P 500 Energy Company in the New York Stock Exchange, under the stock sticker TE. The company started trading at the NYSE on 1st July 2011, Friday (Teco Energy 6).
The New York stock exchange is the center of American commerce, where trading of stocks measured by Dow Jones Averages, NASDAQ Composite, Standard & Poor 500(S&P 500), and NYSE Composite index is done. Dow Jones Averages are indices of the stock market representing the U.S economy. The sectors represented by Dow Jones Averages include industries, utilities, and transport. Wall Street Journal editors have been found to pick lists of companies, which they deem to be representative of the three sectors, as a way of coming up with the Dow Jones Averages. The averages of the stocks in the three sectors are calculated by, dividing the summation of all stock prices by the number of companies in each index.
The outstanding shares are not taken into consideration when using Dow Jones Averages, thus, S&P 500 is, instead, used by many investors. S&P 500 is a stock market index that tracks highly capitalized companies (500) in various industries. The index is the weighted capitalization index, as it takes into account the market cap. Thus, if a stock has a higher market capitalization, the average will be affected more. S&P500 represents the volatility of stock by a beta (β) value and an alpha (α) value. The value of beta (β) shows how an individual stock in the security market is volatile in the market as a whole. The value of alpha, on the other hand, shows the difference between stock returns expected and the actual returns produced (Penman 82)
Research Methodology
The design used to analyze Teco Energy Incorporation is both quantitative and qualitative. The data used in the research design covers the financial reports of the years 2009 and 2010. The data collected has been used to come up with financial ratios, alpha, and beta valuation (Bull 6).
Data Collection and Analysis
Financial ratios
The year 2009
Liquidity ratios: Current ratio (in millions) = Current assets/Current liabilities
Current ratio = 651.6/ 771.3=0.86
Year 2010
Current ratio (in millions) = 757.6/752.3= 1.01
The ratio by average is almost equal to one. This means that Teco Incorporation has one dollar of current assets to satisfy every one dollar of current liabilities.
The year 2009
Quick ratio (in millions) = current assets- inventory/ current liabilities
Quick ratio= 651.6- (124+65.7)/771.3= 0.6
Year 2010
Quick ratio (in millions) =757.6- (169+78.1)/752.3=0.69
The ratios are lower than. This means that Teco Incorporation has 0.7 dollars of the most liquid asset for every one dollar of current liabilities.
Profitability ratio Year 2009
Profit margin = net income/ net Sales
Gross profit margin = 213.9/3310.5*100= 6.5%
The ratio indicates the net income earned as being 6.5% of the sales.
Year 2010
Gross profit margin =239/3487.9*100= 6.9%
The ratio indicates net income earned as being 6.9% of the sales.
The ratio of the two consecutive years indicates that the net income has increased by 0.4%, which means that there is a percentage increase in each dollar sales by the company.
Year 2009
Return on asset = net profit/total assts*100
Return on asset = 213.9/ 72195* 100= 0.3%
Year 2010
Return on asset = 239/7194.6*100= 3.3%
The ratios indicate that, in the year 2010, the company assets were used more efficiently than in 2009.
The year 2009
Return on equity= net profit/total assets –total liability*100
Return on equity= 213.9/7219.5 -5134.1= 213.9/ 2085.4*100=10.3%
Year 2010
Return on equity= 239/7194.6-5024*100= 239/2170.6*100= 11.01%
The ratios indicate that the company has desirable returns, for the two years, from the owner’s equity to award dividend. Teco Company has generated returns of 10.3% and 11.03% in the respective years from the capital invested by the stockholders (Bull 8).
Leverage ratios
Under the leveraging ratio, the analysis will measure the percentage of how Teco incorporation has financed its assets by equity and debt (Penman, 2008).
The year 2009
Total debt to assets ratio= total debts/ total assets*100
Total debts to assets = 5134.1/7219.5*100=71.14%
Year 2010
Total debts to assets ratio= 5024/7194.6*100= 69.84%
The ratios indicate that 70% of Teco Energy’s assets are financed by liabilities.
The year 2009
Long term debts to assets ratio= long term debts / total assets
Long term debts to assets ratio = 4362.8/7219.5*100= 60.43%
The ratio shows the total debts financed by the total liabilities.
The year 2010
Long term debts to assets ratio= 4271.7/7194.6*100= 59.37%
The ratio indicates that of the total liabilities that finance a company’s assets, long-term assets contribute 59.37% of the finance.
The year 2009
Debt to equity ratio= total debts/ total shareholders equity (Troy 61)
Debts to equity ratio= 5134.1/7,219.5*100= 71.11%
The ratio indicates that the company, in financing its assets, has used debts and equity as their source of finance by 71.11%.
The year 2010
Debts to equity ratio = 5024/7194.6*100= 69.83%
The ratio indicates that the company’s relative use of debts and equity to finance total debts is 69.83%. The ratio has declined from the previous year, meaning that, there is a reduction in assets financing through debts and equity (Penman 60).
The year 2009
Times Coverage financial leverage ratio= Earning before interest and taxes/ interest (Troy 77)
Coverage financial leverage ratio= 460.2+79.3/227.0= 2.38 times
The ratio indicates that the firm’s earnings can meet interest obligations by 2.38 times.
The year 2010
Coverage financial leverage ratio= 626.8+ 14.1/ 231.3= 2.77 times
The ratio indicates the companies have earnings as those able to meet interest obligations by 2.77 times.
The year 2009
Fixed charge coverage = (earning before interest and taxes + lease payment/ interest+ lease payment)
Fixed-charge coverage = 460.2+79.3 + 6.9/227.0 + 6.9 = 546/233= 2.3 times
The ratio indicates that the company can meet its interest and lease payment obligations 2.3 times more, from its earning (Bull 7).
Year 2010
Fixed charge coverage = 626.8+ 14.1 +797.2/231.3 +797.2 =1438.1/1028.5= 1.40 times
The ratio indicates that the company is 1.4 times able to meet its obligations of the lease payment and interest.
The ratios further indicate that the company’s ability to meet interest and lease payments has declined by 0.9 times (Penman, 2008).
Price earning per share
The year 2009
Earning per share = net income attributable to common share holders/ average shares outstanding = 212.1/211.8= $ 1.00
The year 2010
Earning per share = 237/212.6= $ 1.12
The earning ratio shows that the earning has increased by $ 0.12 in the past year.
Beta and alpha analysis
Beta valuation is calculated as yi =α + βx + e
Where yi is the change, in percentage, of the stock, α is the change, in the percentage of the stock, if the change in the market is zero, β is the change of the market stock in percentage, Xi is the market change, in percentage, as a whole and e is the error difference (Dorsey 142).
Alpha = Actual return – Risk-free return – Beta × (Index return – Risk-free return) (Troy 53)
The beta value of Teco energy incorporation, as rated by S&P500, was to be 0.756 by the 5th April 2012. The beta value is the one used to analyze the returns of Teco energy incorporation (charlotteobserver.com 2).
The 2009 Index return will be given by; (11.93-11.15/11.15*100) +(14.08-11.93/11.93*100)+ (16.22-14.08/14.08*100)/3= 6.5%+ 18.02%+ 15.20%/3= 13.24%
Alpha analysis on return ratio= 6.5% – 0.26% -0.756(13.24%- 0.26%) = 5.99% – 9.81%= -3.82%.
The alpha value is negative, meaning that, the stock returns expected is higher than the actual return (Dorsey 147).
The alpha analysis for 2010
The index return will be (15.07- 15.89/15.89*100)+ (17.32-15.07/15.07*100)+ (17.80-17.32/17.32*100) /3= -5.16%+ 14.93%+ 2.77%/3= 4.18%
Alpha value = 6.9% -0.26%-0.756(4.18% -0.26%) = 6.64% -2.96%= 3.68%
The alpha value is a positive value, meaning that, the actual return is more than the expected return.
Teco energy incorporation 10Q and 10K sec filing for the year 2009 and 2010
1 sec 10Q filing
Financial 10Q filing
Teco energy financial sec 10Q filing for the year 2009 is as shown in the graph below. 10q filing is reported quarterly. The date of filing is 31st July 2009 (charlotteobserver.com 3).
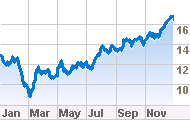
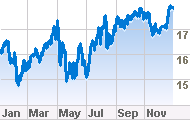
Teco energy incorporation financial 10Q sec filing is represented in the graph below. The date of filing is on 5th November 2010 (charlotteobserver.com 5).
10K sec filing
Teco energy incorporation 10k sec filing is shown below. The filing is for the year ending 31st December for years 2007, 2008, 2009 and 2010.
Teco Energy, Inc. : Ratio of Earnings to Fixed Charges
The following table is a presentation of TECO Energy’s ratio of earnings to fixed charges for the years ending 31st December (Teco Energy 21).
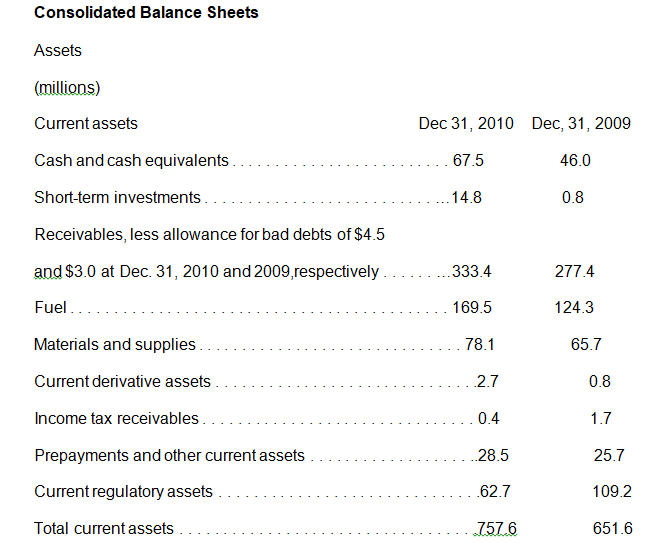
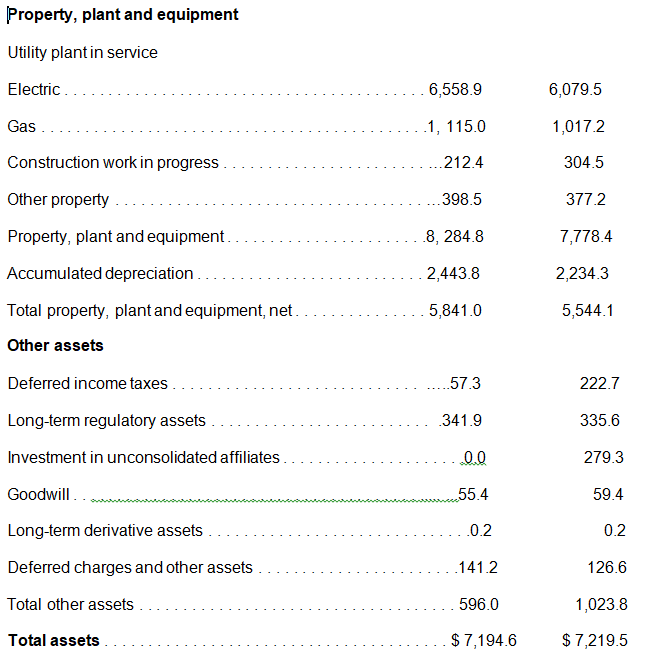
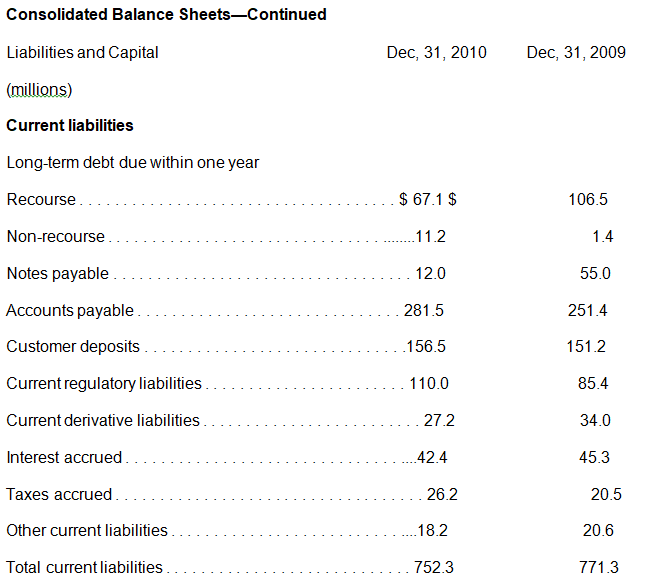
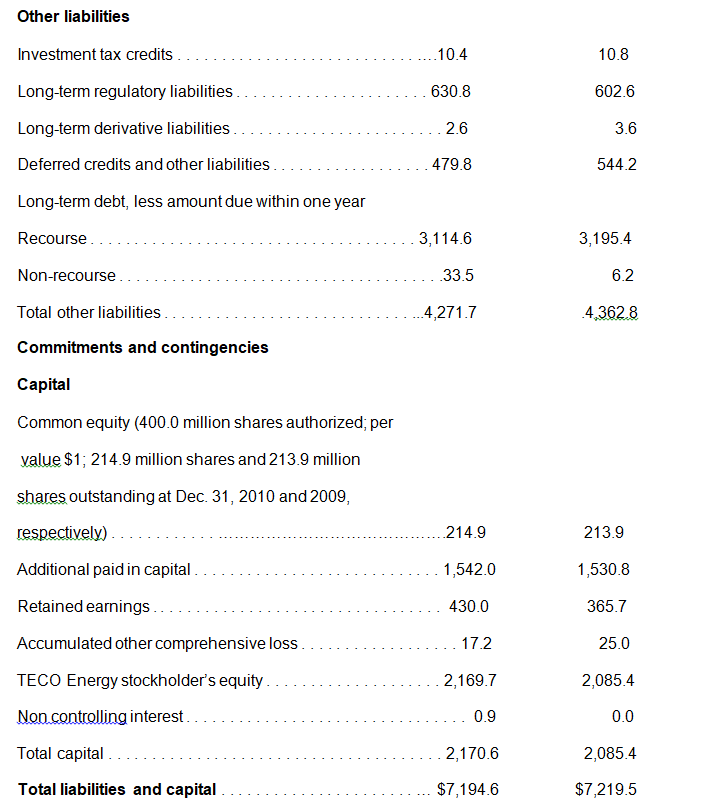
Consolidated Balance Sheets
The balance sheet for Teco incorporation for the year 2009 and 2010 is as shown below (Teco Energy 38).
Conclusion
From the analysis of the ratios and alpha valuation, Teco Company’s performance is on a rising trend. Its competitive strength means that, it is able to withstand competition challenges from its competitors (Bull 7). An investor thinking of investing in the Teco Energy Incorporation is advised to buy Teco shares, and if one already has the shares, then it would be best to hold to them (Dorsey 78). This is because the company is showing a trend of growth in profitability and earning. This means that in future, the dividend pay will increase with increasing earning per share. This will eventually cause the prices of shares to move upwards.
Works Cited
Bull, Richard. Financial ratios: How to use financial ratio to maximize value, New York: Penguin, 2007. Print.
Charlotteobserver. 2010, Financial content of TE IncI. Web.
Dorsey, Alan. Active Alpha: A portfolio approach to selecting and managing, Atlanta: John Wiley and Sons, 2003. Print.
Penman, Stephen. Financial statement analysis and security valuation, London: Oxford press, 2008. Print.
Teco Energy, Delivering value 2010 Annual Report, TE: New York, 2010. Print.
Troy, Leo. Almac of business and industrial financial ratios, Peterson Avenue Chicago: CCH, 2009. Print.