Worksheet
The following is the work sheet of The Business Plc. for at the end of Year 5. This work sheet includes the trial balance, statement of comprehensive income, statement of financial position, and statement of changes in equity. The work sheet also accompanies journal entries, which have been made for making adjustments as per the given information.
Journal Entries
The option to issue right shares for the purpose of raising $10 million has been exercised, which after making relevant adjustments shows that the company will be in a position to pay some dividends to its shareholders. This would in turn motivate investors and shareholders to invest in the company’s stocks (Clendon, 2009; Needles & Powers, 2010).
Financial Statements
Based on the financial information available of the company and worksheet derived as above, the following financial statements of The Business Plc. are prepared, which include Statement of Consolidated Income, Statement of Financial Position, and Statement of Changes in Equity.
Statement of Consolidated Income
The statement of consolidated income for The Business Plc. at the end of Year 5 is provided below:
Statement of Financial Position
The statement of financial position for The Business Plc. at the end of Year 5 is provided below:
Statement of Changes in Equity
The statement of changes in equity for The Business Plc. for the year 5 is given below:
Analysis of Financial Performance – Ratio Analysis
Based on the financial information available of the company – The Business Plc. for the last two financial years, the analysis of its financial performance has been carried out in the following, which is based on values of several useful ratios derived for the respective years (Warren et al., 2011; Needles & Powers, 2010).
Profitability Ratios
In order to determine the financial performance in respect of the company’s profitability during the past two years, the following ratios are determined for The Business Plc.:
- Gross Profit Margin
Source: (Horngren & Harrison, 2009; Clendon, 2009; Needles & Powers, 2010).
- Graphical Illustration of Trends in the Past Years
In order to obtain an overview of the trends in this ratio, the following graph has been made: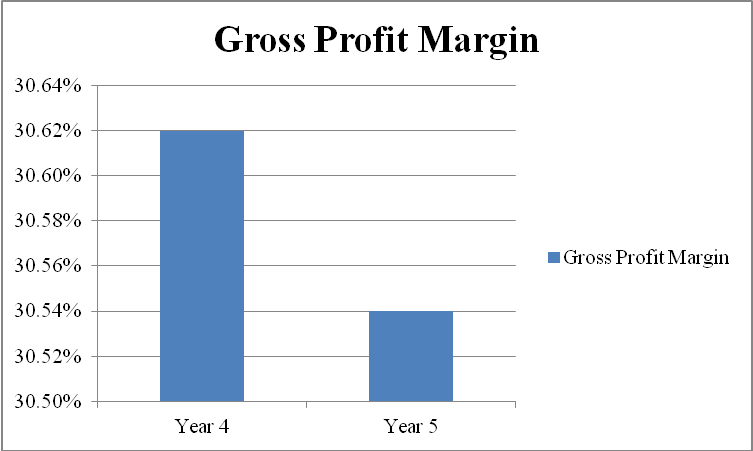
- Operating Profit Margin
Source: (Horngren & Harrison, 2009; Clendon, 2009; Needles & Powers, 2010)
- Graphical Illustration of Trends in the Past Years
In order to obtain an overview of the trend in this ratio, the following graph has been made: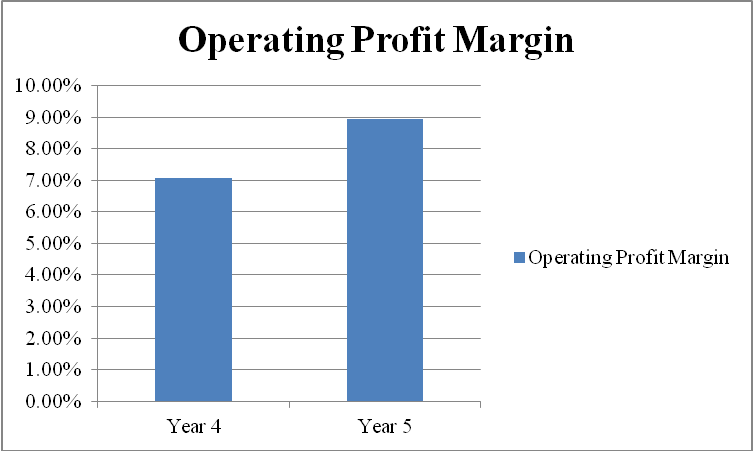
- Return on Capital Employed
Source: (Horngren & Harrison, 2009; Clendon, 2009; Needles & Powers, 2010)
- Graphical Illustration of Trends in the Past Years
In order to obtain an overview of the trend and patterns in this ratio, the following graph has been made: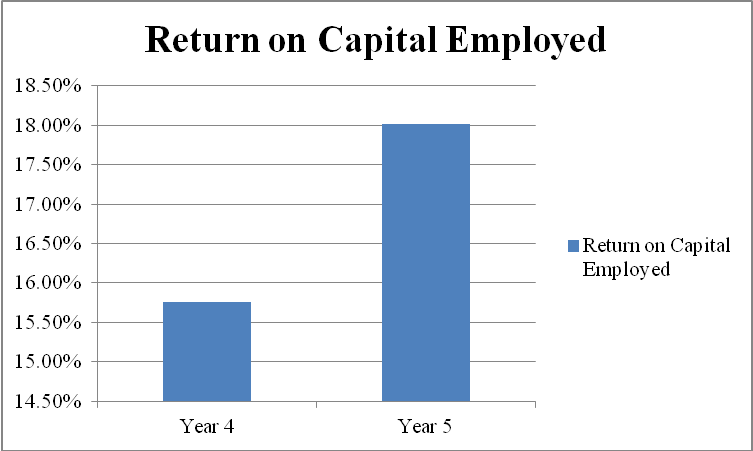
- Return on Ordinary Shareholders’ Funds
Source: (Horngren & Harrison, 2009; Clendon, 2009; Needles & Powers, 2010)
- Graphical Illustration of Trends in the Past Years
In order to obtain an overview of the trend in this ratio, following graph has been made: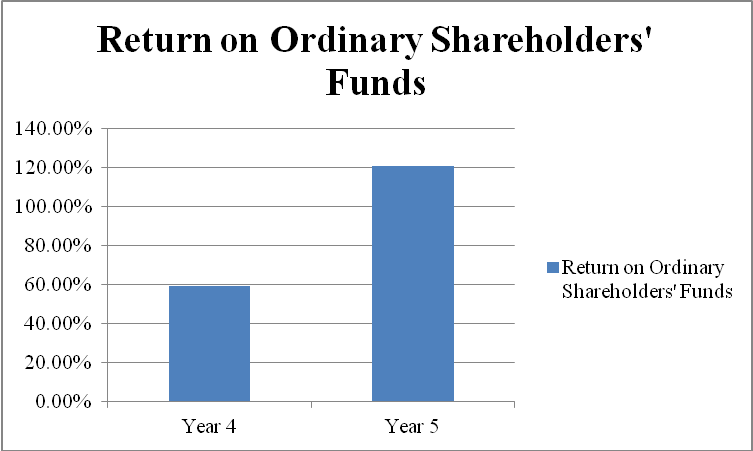
- Return on Assets
Source: (Horngren & Harrison, 2009; Clendon, 2009; Needles & Powers, 2010)
- Graphical Illustration of Trends in the Past Years
In order to obtain an overview of the trend in this ratio, the following graph has been made: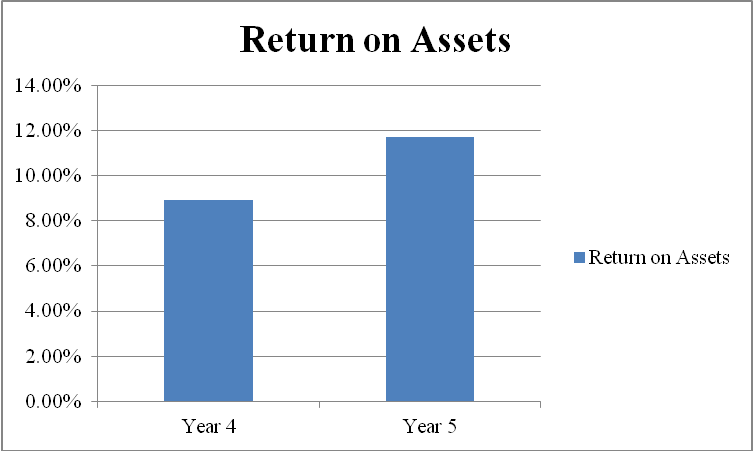
- Liquidity Ratios
For the purpose of analyzing the liquidity position of the company, the following ratios have been determined: - Current Ratio
Source: (Horngren & Harrison, 2009; Clendon, 2009; Needles & Powers, 2010)
- Graphical Illustration of Trends in the Past Years
In order to obtain an overview of the trend in this ratio, the following graph has been made: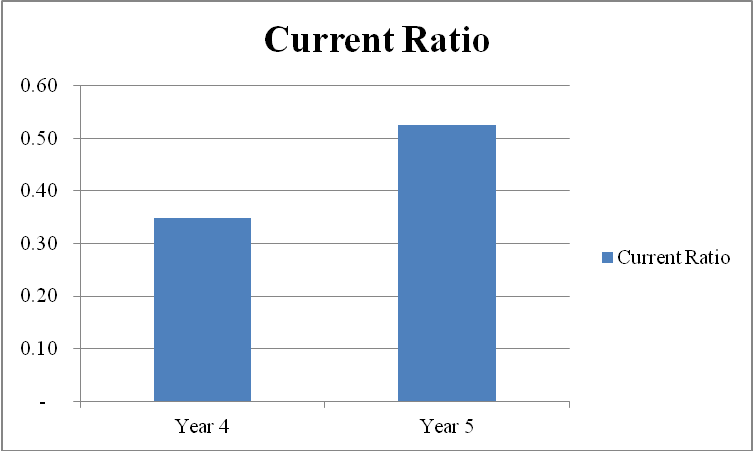
- Acid Test Ratio
Source: (Horngren & Harrison, 2009; Clendon, 2009; Needles & Powers, 2010)
- Graphical Illustration of Trends in the Past Years
In order to obtain an overview of the trend in this ratio, the following graph has been made: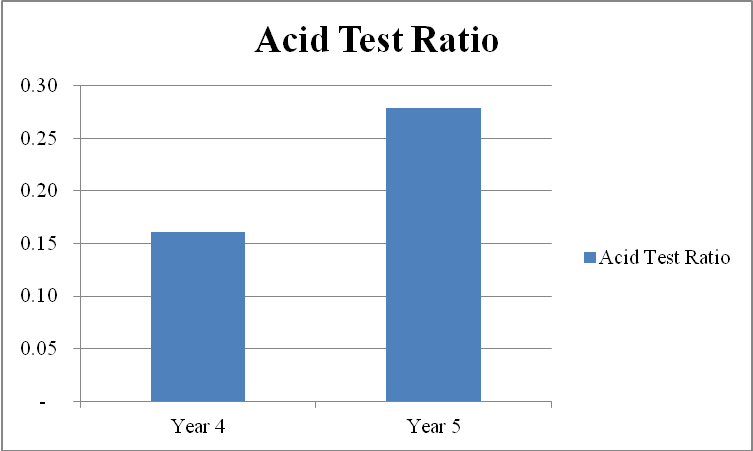
- Management Efficiency Ratios
In order to determine the efficiency of the management of The Business plc for carrying out the company’s business operations and undertaking important decisions in past two years, the following efficiency ratios have been determined: - Average Inventory Turnover Period
(Horngren & Harrison, 2009; Clendon, 2009; Needles & Powers, 2010)
- Graphical Illustration of Trends in the Past Years
In order to obtain an overview of the trends in this ratio, the following graph has been made: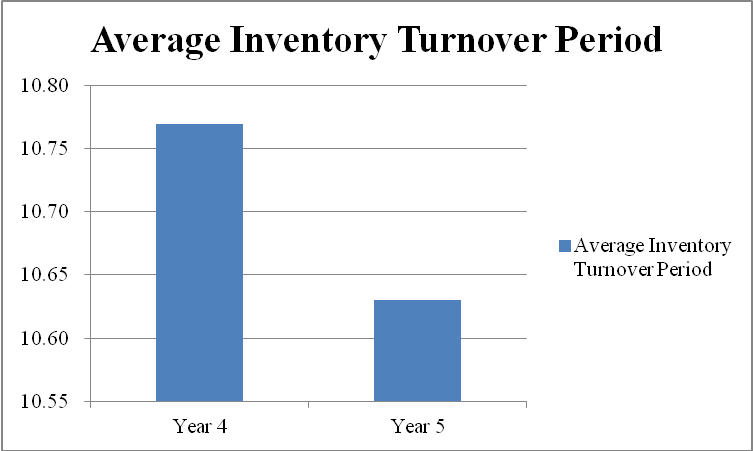
- Average Settlement Period for Trade Receivables
(Horngren & Harrison, 2009; Clendon, 2009; Needles & Powers, 2010)
- Graphical Illustration of Trends in the Past Years
In order to obtain an overview of the trend in this ratio, the following graph has been made: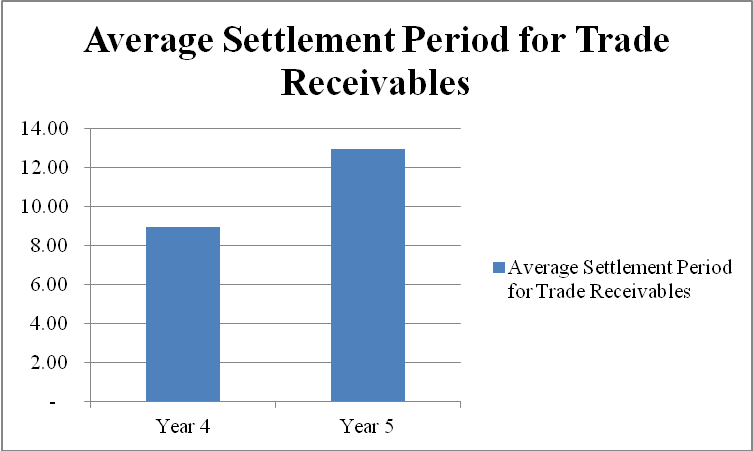
- Average Settlement Period for Trade Payable
Source: (Horngren & Harrison, 2009; Clendon, 2009; Needles & Powers, 2010)
- Graphical Illustration of Trends in the Past Years
In order to obtain an overview of the trend in this ratio, the following graph has been made: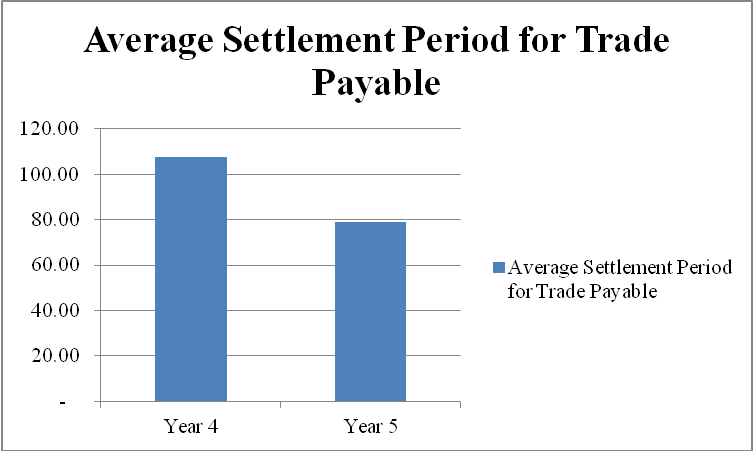
- Gearing Ratios
Source: (Horngren & Harrison, 2009; Clendon, 2009; Needles & Powers, 2010)
- Graphical Illustration of Trends in the Past Years
In order to obtain an overview of the trend in this ratio, the following graph has been made: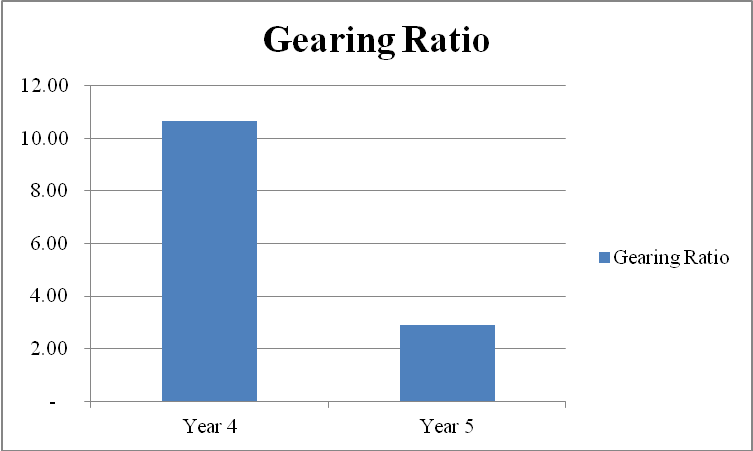
Summary of Findings
Based on ratios determined above, and the resulting patterns and trends shown in the respective graphs for each of the ratios, it can be stated that The Business Plc. has been able to improve its financial position as far as the profitability of the business is concerned. Apart from the decline in its gross profit margin, which resulted due to an increase in the cost of sales of the company, there have been favorable changes noted in values of other ratios including an increase in net profit margin, return on shareholders’ funds, and assets and capital employed (Horngren & Harrison, 2009; Clendon, 2009; Needles & Powers, 2010).
Opposing to the profitability of the company, its liquidity position has remained low at the end of year 5 similar to the position at the end of year 4. Although there have been improvements that are noted in the current and acid test ratios of the company in year 5 as compared to year 4, these improvements are not significant enough to bring the overall liquidity position of the company to a favorable position. The reasons which appear to be the primary factors of the low liquidity of the company include a significantly high level of short-term borrowing and outstanding trade payables of the company (Horngren & Harrison, 2009; Clendon, 2009; Needles & Powers, 2010).
Apart from this, the efficiency of management in conducting the company’s business operations has also been analyzed. In this regard, three ratios have been determined including average inventory turnover period, average settlement period for trade receivables, and average settlement period for trade payables. The results indicate that the performance of the company’s management is deteriorating as shown by the unfavorable changes in the selected three ratios’ values (Horngren & Harrison, 2009; Clendon, 2009; Needles & Powers, 2010).
Lastly, the gearing ratio has also been determined, which shows a significant reliance of the company on external debt for obtaining finance. Considering the total long-term debt of the company, it can be noted that it has remained the same in years 4 and 5. However, a decrease in the equity of the company has resulted in a higher gearing ratio value in year 5, which shows the dependency of the company on the long-term borrowing for obtaining finance (Horngren & Harrison, 2009; Clendon, 2009; Needles & Powers, 2010).
Recommendations
From the analysis presented above, it has been concluded that the company is in a favorable position as far as the profitability of the business is concerned. However, liquidity, management efficiency, and gearing are concerned areas, which require attention from the management and those who are responsible for the governance of the entity.
Recommendations for “The Business plc”
Based on the findings and conclusions reached from the financial analysis of the company, the following recommendations are set out for the company:
- The company shall consider managing its cost of sales more efficiently as there has been a significant rise in the same noted in year 5, which has resulted in a decline in the gross profit margin (Clendon, 2009; Needles & Powers, 2010).
- For improving the liquidity position of the company, it is recommended that the company shall improve its current assets and decrease current liabilities in order to reach a favorable liquidity position. In the current liabilities portion of the company, it has been noted that there is a significant amount of short-term borrowings of the company, which has resulted in an unfavorable liquidity position of the company. By lowering its reliance on short-term borrowing, the company can improve its liquidity position (Clendon, 2009; Needles & Powers, 2010).
- The company shall consider reducing the time it takes to recover receivables from its debtors. This would enable the company to improve the availability of cash (Clendon, 2009; Needles & Powers, 2010).
- In addition to this, the management of the company shall delay its payment to creditors and negotiate in a manner that the company’s cash reserves are not drained.
- The company shall also focus on lowering its inventory balances in order to improve the inventory turnover ratio (Clendon, 2009; Needles & Powers, 2010).
- The company shall consider reducing its gearing level by focusing on equity-based financing rather than looking for finance from long-term borrowings. In this way, it will be possible for the company to improve its solvency position (Clendon, 2009; Jiambalvo, 2010).
References
Clendon, T 2009, A student’s guide to Group Accounts, Kaplan Publishing, Wokingham.
Horngren, C T & Harrison, W T 2009, Accounting. Upper Saddle River, Prentice Hall, New Jersey.
Jiambalvo, J 2010, Managerial Accounting, John Wiley & Sons, Inc., Hoboken.
Needles, B E & Powers, M 2010, Financial Accounting, Cengage Learning, Mason.
Warren, C S, Reeve, J M & Duchac, J 2011, Financial and Managerial Accounting, South-Western Cengage Learning, Mason.

