Introduction
Since the end of the 1992 economic recession in UK, the country has encountered a significant and uninterrupted growth in its economy. In the recent years the country’s growth has continued declining and major factors have caused this decline in growth. In the year 2004, the country faced an increased growth rate of 3.2% but in the following year, the rate went down to 1.6% and this showed that the country was facing pressures which were a constraint to the previous trend in growth rate. From 1992, the economic growth rate has been a relatively constant trend of 2.5% and the decline in 2005 led to a critical review of the economic aspects and policies (Office of National Statistics 2008).
The main feature in the growth of the UK economy is that it has been able to overcome the economic recession and boom and it is out of this that there has been stability in its growth. However, despite overcoming these economic hardships, it is argued that there are possibilities that the economy is unbalanced in respect to the different sectors. For example, from the analysis carried out by various economists, the manufacturing sector has been performing poorly for a relatively long period mainly due to increase in consumer spending (Hunter 2008).
These are some of the factors that have been affecting constant growth in the economy and this study focuses on some of those aspects that have a significant effect on the country’s economy.
Recent trends and the current state of the UK economy
To be able to look into the prevailing trends and state of the UK economy, it is important to take into consideration the major macro-economic variables that affect the growth of the economy.
Unemployment
One of the greatest developments in the economy of UK since the last economic recession in 1992 has been the decline in the unemployment levels. During the recession, studies showed that over three million people were unemployed or did not hold stable employment. Between the years 1992 to 2003, the level of unemployment has continued going down but in the past five years, the country has started experiencing a rise in the rate of unemployment. In the year 2004 alone, the Office of National Statistics (ONS 2008) indicated that the number of people who were unemployed were 1.49 million. This was an increase of up to 4.7% from the 2003 figure of 72 000 unemployed people.
The number of economically inactive people in the UK has also increased to a significant level and this has led to constraints in government financing. There is however, possibility that the levels may go down in the successive years. In 2008, the rate of unemployment had gone down from 5.4% to 4.6% according to the JSA statistics and it is anticipated that it will go down even further in 2009 (ONS 2008).
Inflation
The level of inflation in the UK economy has continued to move towards the government target, despite the high global oil prices. By the end of 2004, the Consumer Price Index had dropped from 3% to 2%. This means that there has been an anticipation that the future interest rates may go down to enable more borrowing and investment and in turn reduce the level of spending. The marginal propensity to consume increased the interest rates to 4.5% in the year 2006 and since then the inflation rate has ranged between 4.1% in 2007 and 3.9% in 2008 which shows that there is a chance to it going even down (ONS 2008).
The AD-AS model
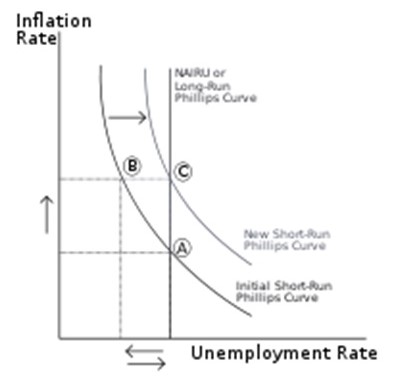
The AD-AS curve represents the relationship between the equilibrium income and the labor market equilibrium at different levels of prices. The AS-curve is represented by the labor market equilibrium while the AD-curve is represented by the IS-LM model. To determine the relationship between the inflation rate and the level of unemployment, the concept of AD-AS model may be used to derive the Phillip’s curve.
In the diagram, the long run Phillips curve shows a constant aggregate supply of labor while the short run Phillips curves show the aggregate demand for labor. When the rate of inflation rises from points A to B at constant supply, the aggregate demand curve shifts upwards, from the initial Phillips curve to the new Phillips curve. This implies that the level of unemployment increases as inflation ate also goes up (Oxford Economics Press 2008).
Government finances
Despite the many years of economic growth, the government finances have been constantly constrained that it has forced it to borrow more. During the year 2005 to 2006 the net government borrowing rose to $37 billion and this led to a current budget deficit of $4 billion. This has shown that the government has gone beyond its targeted limits for borrowing and it must come up with proper strategies of overcoming the huge borrowing especially if finances do not go up. The gross domestic public sector borrowing has risen from 30% in 2002 to 37% in the year 2005 (Credit Conditions Survey 2008).
Current Account deficit
According to the Credit Conditions Survey (2008), current account deficit has risen in the last quarter of 2005 up to a level 3.5% of the gross domestic product. This came after the destructions of the Hurricane Katrina which forced the government to pay huge insurance premiums in form of compensation. A rising deficit in the long term could result in increase in the rates of interest and declined growth rate. However, the UK government has in earlier times successfully been able to overcome the current account deficits.
During the year 2008, the current account deficit was 3% of the gross domestic product and this has been a relatively significant improvement from the 3.6% observed the previous year (Credit Conditions Survey 2008).
The 45-degree line can be used to represent the level of consumption in the country. There is an indirect relationship between consumption and the gross domestic product. Consumption in the country is the aggregate of income, investment and government spending. When consumption is high, the aggregate expenditure is also high and the national income goes down. On the other hand, low consumption lowers the aggregate expenditure and increases gross domestic product and hence makes the current deficit to go down.
The 45-degree line model
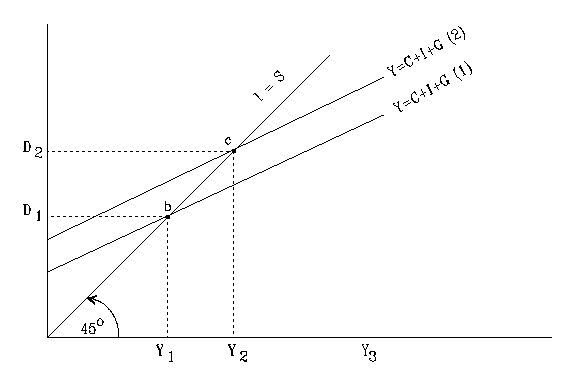
The 45-degree line illustrates the points in the model where the variables in both the X-axis and the Y-axis are equal. In the above diagram, the aggregate demand, d, is equal to the national income, Y, on the 45-degree line. At Y1 level of national income the aggregate demand is d1 and when national income increases to d2 at proportionate level, the consumption level also increases with increase in the gross domestic product, from C=Y+I+G (level 1) to C=C+I+G (level 2). That is consumption shifts from point b to point c when national income or the gross domestic product increases from Y1 to Y2.
Gross domestic product
The Gross Domestic Product (GDP) is one of the most important indicators of economic well-being of a country. Since the end of the economic recession, UK has seen tremendous improvement in its real GDP. In the year 2004 the GDP rose from 2.8% the preceding year to 3.3%. The rate went down to 3.1% in 2007 and there is expected to be a higher decline in 2009 as a result of the high levels of consumption and government borrowing (World Economic Outlook 2008).
The relationship between the gross domestic product and the current rate of interest may be represented by the IS-LM model. The IS-LM model shows the relationship between the goods markets and the money market that is, the relationship between the interest rates in the goods market and the demand for money in the money market, which is determined by the GDP of the country.
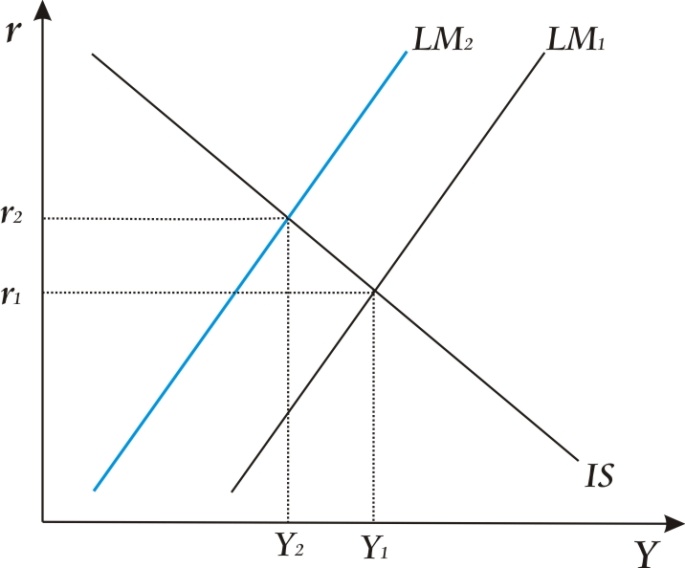
In the above diagram, the equilibrium rate of interest is r1 when the labor market is at the level represented by LM1 curve. The equilibrium level of the gross domestic product is Y1. When the rate of interest increases from r1 to r2, the GDP goes down to Y2 and this in turn leads to a shift of the LM curve to the left and the equilibrium level also shifts.
Budget deficit
Despite observing a long period of economic growth between the years 1997 and 2007, the UK economy experienced a budget deficit of 1.7% mainly due to the fact that government financing was becoming constrained and there were increased rates of borrowing. The budget deficit had gone up to 3.2% in 2007 and there were anticipations that it may rise to uncontrollable levels in 2008 and 2009. The Credit Conditions Survey says that the level may rise to 9.3% of the current GDP in 2008 and then range at 6.7% over the following four years (ONS 2008).
Predictions for the future UK economy
With the changes in the economic conditions of the country, economists have carried out surveys and come up with different possibilities that are likely to occur in the near future.
The United Kingdom has been facing an unexpected decline in its economy and this has seen it ranking low among the highly developing economies of the world. According to the report obtained by the Business Monitor International, the UK is likely to go down to position 21 by the year 2010 from the current 12th position. This has been the result of the continued decline in the real gross domestic product over the last few years (World Economic Outlook 2008).
However, the Business Monitor International predicts a rise in the world ranking position to position 17 by the year 2013, three years’ advancement. This has been obtained by measuring the output per capita in terms of the US dollar and with time, the rank may go up to position 12. The country may however not be able to go up to its top position in a long time especially because of the continued devaluation of the US dollar which is likely to go on for the next ten to fifteen years.
The Credit Conditions Survey (2008) states that the UK economy has also experienced a drastic decline in the effectiveness of its policy credibility, leading to a fall in the short-term public risk rating schedule provided by the Business Monitor International. The schedule has consisted of 150 countries and in the beginning of the year 2008, UK ranked 15 and it has since then gone down to position 31. This shows that the policy credibility in the government sector has gone down to a great extent and this may lead to adverse effects to the business sectors of the economy. With uncertainty in the political sustainability, the fiscal policy is greatly endangered and the BMI report anticipates an even greater fiscal risk come the year 2010 when the elections will be held.
Another major area of concern looked into by the BMI is the UK’s labor force. The country has been experiencing a decline in the efficiency of the education sector mainly due to more professionals shunning away from the education sector. The labor force has also been affected by the deteriorating levels of the social well-being and increased growth in population. Quality index on labor force has been going down from 2007 and it is expected to be worse in the next five years unless the social and demographic conditions are improved (ONS- Labor Market Overview 2008).
The UK economy is likely to suffer a greater recession come the year 2010 especially if the government does not cut on its borrowing. With the increase in the level of consumption, low investments have been carried out in the recent past and this is one cause for the decline in the gross domestic product. The GDP is expected to fall by 3.5% in 2009 and then recover narrowly by 0.2% in 2010 which will stagnate at that level if the consumption level and levels of investment are not improved. The business sector has also declined and this causes the GDP to deteriorate (ONS 2008).
According to the Labor Market Overview report (2008), unemployment level will rise to 3.2 million in the year 2009 which is a rate of 11.2%. The business sector and the financial services sector are expecting to lose 570, 000 between the year 2008 and 2010 as a result of retirement, retrenchment and possible resignation.
On the other hand, property prices will experience a cumulative decline of 41% in 2009, which is greatly significant, and this is likely to take more than 10 years to recover back to its relative levels of 2007. The impact of negative capital formation and declining value in assets will further result in increased consumer spending and low economic growth (ONS 2008).
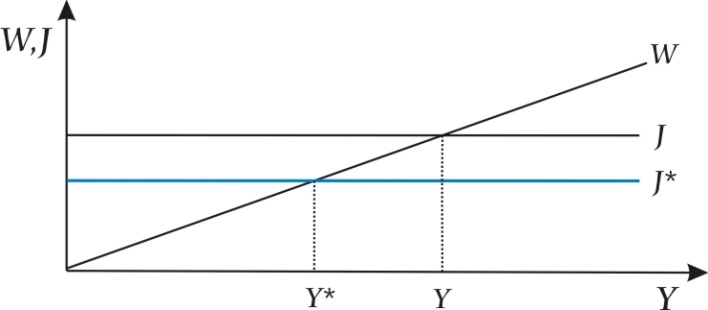
In terms of recovery, the BMI report states that the UK economy, which has one of the most successful manufacturing sectors in the world is well in a position to gain from the improving terms of trade. As the demand for imports goes down and exports go up, the current account deficits are likely to turn into surplus in the year 2011 and may remain in that state for close to five years.
Y* represents the current year (2008) and Y is the predicted year 2011 when exports are likely to increase from J* to J. This results in increased economic growth WJ.
Possible threats and opportunities of the UK business sector
With the prevailing economic conditions in UK, there are possibilities that the business sector will experience threats as well as opportunities. The possible threats include (World Economic Outlook 2008):
- Sustainability of the market share: With the increased borrowing from the government, the UK economy has had to overcome with ways of avoiding possible risks associated with the increased borrowing. There have been possibilities that the high interest rates may affect the future sustainability of the market share.
- Housing valuations: The major challenge that has continued arising is in the housing sector and many businesses feel that the housing prices are over-valued. With rise in the prices, the sector may be losing potential investors.
- Economic imbalances: Different sectors in the economy have been ranked differently because the level of development is not the same. This has created a challenge in the prevailing market share and there are possibilities of declined growth in the business sector especially where some areas become affected by the economic imbalance.
- High level of debt: The UK savings ratio has for a long time been low with debts exceeding the savings Apart from government borrowing, consumer debt is also very high and this proves a threat to the future rates of interest and in turn affects the growth of the business sector.
On the other hand, there have also been opportunities that the business sector may focus on to improve their growth. According to the World Economic Outlook survey (2008), these include:
- Economic Growth: The economic growth for the year 2007 is forecast at 3.1%. This creates a suitable opportunity for the country to improve its business sector and produce more favorable conditions for its growth.
- Inflation rate: The Consumer Price Index has been targeted by the government at 2%. This means that at that level, the government may be able to improve economic growth and support the other sectors of the economy; including the business sector.
- Economic Cycle: The UK economy has been experiencing a long period of uninterrupted economic growth. Since the end of the economic recession in 1992, economic growth has been positive and there is possibility that the average growth will continue to increase to the year 2016 if the population and unemployment levels are put in check. This is a great opportunity for the business sector to advance since there is assured economic stability.
Conclusion
In conclusion, the UK economy is relatively doing well despite the economic imbalances. However, the budget deficit will need to be re-examined in order to help the economy retain its current trend of growth. The government should look into the management of its revenues so that it is able to finance the public activities without having to incur debts. This way, budget deficit will be curtailed and the economy will move towards the right trend.
Bibliography
Bank of England website, 2008.
Britain Faces its own Housing Risk: 2007. The Financial Times.
Budget 2008: What it Means for your Small Business.
Credit Conditions Survey: 2008, Bank of England.
Economic Trends: 1996. Great Britain Office for National Statistics; HMSO.
European Economy: Supplement A: Recent Economic Trends: 1993, Directorate-General for Economic and Financial Affairs of the Commission of the European Communities.
Hunter, M, Smith, G and O’Connor, S. Budget 2008 at a glance: The Financial Times.
Labour Market Forecast: 2008. Oxford Economics Press.
Labour Market Overview: 2008. Office for National Statistics.
Report on Currency and Finance: 1960, University of Michigan.
The UK Economy in 2008 and 2009: 2008, Deloitte.
UK Interest Rates and Importance of Inflation: 2007. Mortgage advice.
World Economic Outlook: 2008.