Introduction
The concept of the efficient market hypothesis was developed in 1960 by Eugene Fama. The idea has widely been used across the market. Besides, several research studies on the efficient market hypothesis have been carried out since 1960. The concept of the efficient market hypothesis “holds that the prices in the market reflect all information available in the market” (Patel, Radadia & Dhawan 2012). “If the prices reflect all information that is available in the market, then the market price of various securities will be an unbiased estimator of the true value of the investment” (Rabbani, Kamal & Salim 2013). However, this does not imply that the market price of the securities exactly equals the true value. The hypothesis holds that any information that relates to a given security is quickly reflected in the market price of the security within the shortest time possible. There are different degrees of efficient market hypothesis. The degrees depend on the type of information and the speed at which any new information is assimilated into the price (Patel, Radadia & Dhawan 2012). The three categories of efficient market hypothesis are the “weak-form efficiency, semi-strong efficiency and strong-form efficiency” (Rabbani et al. 2013). The paper seeks to carry out a test of the random walk hypothesis on the stock market in Canada, China, the United Kingdom, and India.
Hypothesis and literature review
Literature review
Extensive research has been carried out on the weak-form efficient stock market hypothesis. The first research study was conducted by S.K Chaudhuri in 1991 (Chaudhuri 1991). In the research, the market under study was India. The author collected data for a period between 1988 and 1990. Further, the methodology used in the study was serial correlation and the runs test. The results of the study indicated that there was no evidence of random walk in the data collected. Thus, the theory of weak-form efficient stock market hypothesis did not hold. Another research was conducted by Sunil Poshakwale in 1996 (Poshakwale 1996). The research focused on data collected between 1987 and 1990 in India. Further, the author used serial correlation, runs test and KS test to test the hypothesis. The results of his study did not show the presence of a weak-form efficient stock market hypothesis (Poshakwale 1996). Another research was conducted by Martin Laurence, Francis Cai and Sun Quin in 1997 (Laurence, Cai & Quin, 1997). The authors collected data for Chinese stock exchange market for four years, that is, between 1993 and 1996. The authors used several methods to test the hypothesis. These were a unit root test, serial correlation, co-integration, and Granger causality test. The results of the study indicated that there was no evidence of random walk in the data collected.
Another research was conducted by Claire G. Gilmore and Ginette M. McManus (2001) (Gilmore & McManus 2003). The authors used data for the Czech Republic, Hungary, and Poland for a period between 1995 and 2000 (Gilmore & McManus 2003). The methods used were autocorrelation, variance ratio test, co-integration, and Granger causality test. The research indicated that there was evidence of random walk in the data collected for the three markets. Further, Natalia Abrosimova, Gishan Dissanaike, and Dirk Linowski (2002) carried out research in Russia using data collected between 1995 and 2001 (Abrosimova, Dissanaike & Linowski 2002). In the research, the authors used ARIMA and GARCH model, unit root, autocorrelation and variance ratio to test the hypothesis. In the research, the authors established that the weak-form efficiency was present depending on the frequency of the data used. An example of a more recent study was the research conducted by Kashif Hamid et. al. in 2010 (Hamid, Muhammad, Syad & Rana 2010). The authors collected data for Pakistan, India, Sri Lanka, Malaysia, Korea, Hong Kong, China, and Indonesia for a period between 2004 and 2009. The tests that were used in the methodology were auto-correlation, runs test, unit root test, and variance ratio. The study revealed that no market under the study was efficient in the weak-form.
From the studies and tests carried out by different authors, it can be noted that the weak-form of efficiency exists in some markets while in other markets it is not present. The different results can be explained by the level of development of these markets. Further, these studies provide a number of ways through which the null hypothesis can be tested. This leads us to state the hypothesis of the study.
Hypothesis
Null
Ho: Stock markets are efficient in the weak-form
Alternative
H1: Stock markets are not efficient in the weak-form
Data methodology
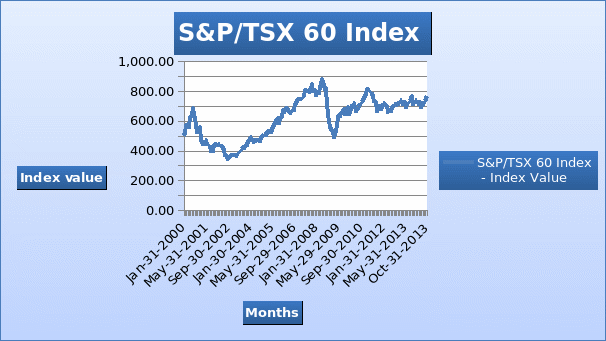
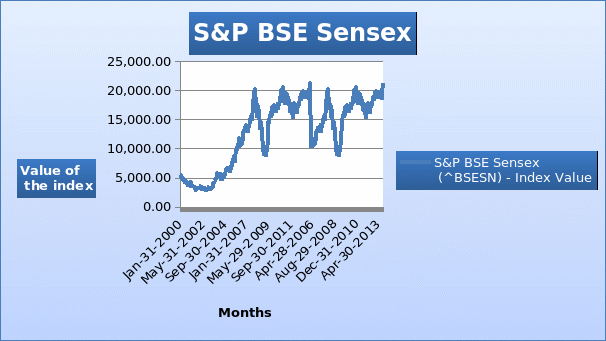
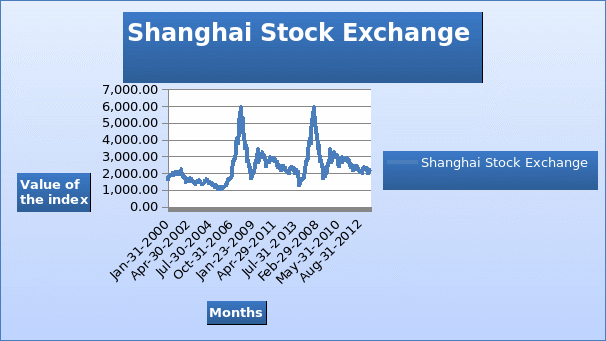
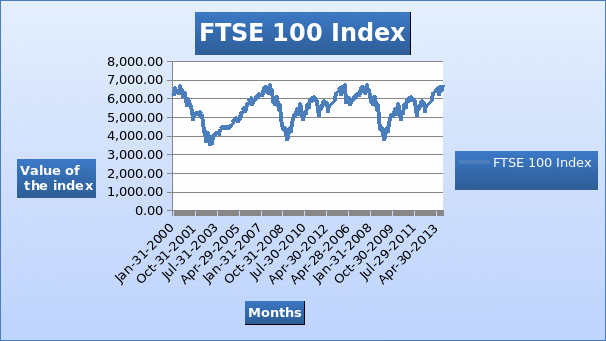
In this study, secondary data of four stock markets, these are, Canada (S&P/TSX 60), India (S&P BSE Sensex), China (Shanghai stock exchange) and the United Kingdom (FTSE 100) will be used to test the hypothesis. The data is for the monthly index for 14 years, that is, between January 2000 and October 2013. The return on the stock indexes will be first estimated using the formula presented below.
Return on stock indexes = (Current price – previous price) / previous price
Further, in this study, the variance ratio test will be used to test for the weak-form efficient stock market hypothesis (Greene 2003). The formula for the variance ratio test (VRT) is presented below (Baltagi 2011).
VRT = Var [rt (q)] / qVar (rt)
Where: Var = variance
rt = return on a specific time period
q = period represented by lags
The stock index for the various stock markets can be represented in a graph as shown below. The graphs will show the trend of the index for the various stock markets over the fourteen years.


Empirical results
Descriptive statistics
The table presented below shows the descriptive statistics of the data used in the study. The table contains the mean, standard error, median, mode, standard deviation, sample variance, kurtosis, skewness, range, maximum value, minimum value, and sum. For instance, it can be noted that S&P BSE Sensex for the Indian stock market has the highest value of the mean, and the stock market in Canada – S&P/TSX 60 has the least mean. The same is observed in the value of the standard error and standard deviation.
Random walk hypothesis for the monthly returns
As mentioned above, the variance ratio test will be used in the analysis. However, the literature review section outlines several measures that can be used to test for the weak-form efficient stock market hypothesis. The results of the variance ratio test are presented in the table below.
The values of variance ratios are presented in the table above. For instance, the values of variance ratio for S&P/TSX 60 were 1.17 (2 lags), 1.39 (4 lags), 1.44 (8 lags), and 1.32 (16 lags). Further, the values of heteroskedasticity-robust test statistics are presented below the values of variance ratio. For instance, the values of heteroskedasticity-robust for S&P/TSX 60 were 1.33, 1.81, 1.41, and 0.75. The value of the variance ratio is always one under the random walk hypothesis. The results indicate that the values of variance ratio are either slightly greater than or slightly less than one (Rabbani et al. 2013).
Conclusion
The results of the variance ratio test show that the random walk hypothesis did not hold in the stock market in Canada (S&P/TSX 60), India (S&P BSE Sensex), China (Shanghai stock exchange), and the United Kingdom (FTSE 100).
References
Abrosimova, N, Dissanaike, G, & Linowski, D 2002, ‘Testing weak-form efficiency of the Russian stock market’, Journal of Financial Research, vol. 27. no. 1, pp. 133-141.
Baltagi, G 2011, Econometrics, Springer, New York.
Chaudhuri, S 1991, ‘Short-run share price behavior: new evidence on weak form of market efficiency’, Vikalpa, vol. 16. no. 4, pp. 17 – 21.
Gilmore, C & McManus, G 2003, ‘Random-Walk and Efficiency Tests of Central European Equity Markets’, Managerial Finance, vol. 29. no. 4, pp. 42 – 61.
Greene, H 2003, Econometric analysis, Prentice Hall, London.
Hamid, K., Muhammad, S, Syad, A, & Rana, S 2010, ‘Testing the weak form of efficient market hypothesis: empirical evidence from Asia-Pacific markets’, International Research Journal of Finance and Economics, vol. 58. no. 2, pp. 121-133.
Laurence, M, Cai, F, & Quin, S 1997, ‘Weak-form market efficiency and causality test in Chinese stock markets’, Multinational Finance Journal, vol. 1. no. 2, pp. 291-307.
Patel, N, Radadia, N & Dhawan, J 2012, ‘Day of the week effect of Asian stock markets’, International Refereed Research Journal, vol. 3. no. 3, pp. 60 – 70.
Poshakwale, S 1996, ‘Evidence on weak form efficiency and day of the week effect in the Indian stock market’, Finance India, vol. X. No. 3, pp. 605 – 616.
Rabbani, S, Kamal, N & Salim, M 2013, ‘Testing the weak-form efficiency of the stock market: Pakistan as an emerging economy,’ Journal of Basic and Applied Scientific Research, vol. 3. no.4, pp. 136 – 142.
