Introduction
General Motors Company is an American multinational vehicle manufacturing organization that is listed on the New York Stock Exchange. The organization is a member of the FTSE 100 Index and its stock code is GM: NYSE. General Motors is headquartered in Detroit. It designs, manufactures, distributes, and markets vehicles and spare parts to consumers in various parts of the world. It also operates in 38 countries under different brand names. The major vehicle brands sold by the company include Chevrolet, Cadillac, Buick, Baojun, Opel, GMC, Jie Fang, and Holden. The organization operates fully owned subsidiaries in the international market and has more than 10 joint ventures in Japan and China (David 2002).
General Motors was founded in the year 1908 as a Buick Holding Company. The organization established its operations in the automotive industry by launching horse-driven vehicles. In the year 1909, Buick Company was merged with GM to form the General Motors Company (Arthur 2003). From Detroit, the organization spread to other areas in America and other countries of the world. By the year 1910, General Motors had opened subsidiary branches in 10 countries, which were mainly situated in Europe and other parts of Asia-Pacific such as China and Japan. Currently, General Motors Company sells its products in more than 150 countries and boasts of a large workforce that comprises 210,000 workers (David 2002).
Operational Overview and Financial Position
Based on the above information, it is, therefore, cardinal to highlight the operational overview and the financial position of General Motors Company. Comparing the total revenue of the organization between the years 2012 and 2011, it is evident that the organization had revenue of $152 million in 2012 against $150 million in 2011. The company, therefore, witnessed an increase in total revenues of $2million in 2012. Profit after tax decreased from $19 million in 2011 to $10 million in 2012. The decrease represents a 47% decline in gross profits. The net income that is applicable to common shares was $4.8 million in 2012 and $7.5 million in 2011. This represents a percentage decline of 36% in common shares (William 2010).
Financial borrowings in the year 2012 stood at $ 48 million compared to $47 million in 2011. This indicates that the firm reduced its financial borrowings by 2%. The results also show that the organization will adopt alternative methods of asset financing in order to reduce financial borrowing by significant margins. However, the financial liabilities of the organization reduced from $ 3.6 million in 2011 to $3.4 in 2012. An assessment of the operating expenses indicates that the organization’s general and administrative expenses increased from $12 million in 2011 to $13 million in 2012, which represents, a 2% increase in operational costs. In 2012 the organization experienced an increase in the cost of operation. Moreover, the company experienced an operational loss of $30 million in 2012 (Bloomberg Businessweek 2012).
Value to Shareholders and Stock Performance
Analysis of the value given to the shareholders must embrace factors such as the value of the share price and the dividend payout. The total value of the shareholder return is derived from the summation of the increase in value of the share price and the dividend paid to the shareholders (Damodaran 2000).
The ability of General Motors Company to deliver value to the shareholders is based on its performance in the stock market. The performance is determined by the share price and the earnings of the organization from the stock market (Statman 2004). The analysis must take into account the share price of General Motors Company for the last five years as indicated in the graph shown below.
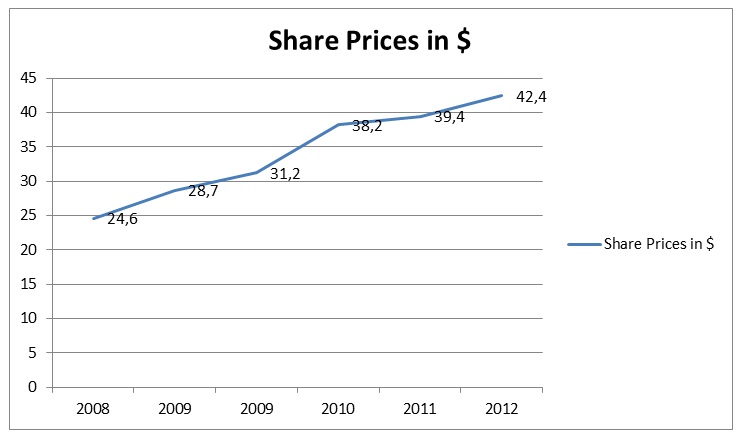
From the graph shown above, it is evident that the share prices of General Motors declined between the years 2008 to 2009. The share prices during the two years were $24.6 in 2008 and $28.7 in 2009. The decline in share prices can be attributed to the factors in the external environment of the organization. One of the key factors that can be associated with the decline in a global financial crisis that took place in 2008. However, in the year 2010 the organization witnessed a significant increase in share prices from $28.7 in 2009 to $31.2 in 2010 (Bloomberg Businessweek 2012).
Another element of this analysis is earnings per share of the organization. The earnings per share determine the level of income of the organization. A high value of earnings per share translates to higher income and profitability of an organization (White 1997). The value also determines the dividend payout percentage given to the shareholders. The earnings per share and the dividends per share of the organization can be compared as shown in the graph below.
From the graph it is evident that the earnings per share declined from 0.55 in 2008 to 0.48 in 2009 due to the effects of the financial crisis. The same case is indicated on the dividends per share where the earnings declined from 0.84 in 2008 to 0.71 in 2009. The results show that during the financial crisis General Motors Company did not give the shareholders a higher value of the shares. From the year 2009 to 2012 the earnings per share increased from 0.48 to 0.63, which represents a 31.2% increase in share earnings (Bloomberg Businessweek 2012). However, it is essential to rely on the information on the basic earnings per share instead of the information provided by the adjusted earnings per share (Penman 1987). The latter can be easily changed by the management of the organization to portray a positive image of the performance to the shareholders (Damodaran 2000). Unlike the adjusted earnings per share that can only be used in determining shareholder value, the basic earnings per share act as performance metrics and benchmarks that can be used to compare the performance of the company to other organizations in the same industry (Litzenberger 1979).
Current Valuation of Equity
Equity Valuation is an important element that enables shareholders to determine the performance of an organization (Booth 1999). Investors use financial indicators to determine the actual value of a company before pursuing an investment initiative (Litzenberger 1979). The current equity of General Motors Company is therefore important in ensuring that the organization is properly valued. The current equity, in this case, will embrace the following techniques:
- Net Asset Value.
- Price/Earnings Ratio.
- Discounted Free Cash Flow.
Net Asset Value Approach
The Net Asset Value technique takes into account the total value of the assets in a company. Investors use the technique to determine the value of the net and the earning power of an organization. However, most investors use the approach to determine the earnings of a company (Partch 1987).
NAV=Total Assets-Total Liabilities.
Total Assets=149, 422,000
Total Liabilities =113,178,000 = 149, 422, 000-113, 178,000 = $ 32, 244,000 million
Book value per share of General Motor Company is calculated by dividing the value of NAV by the total number of shares as per 31st March 2012.
Book value per share= 32.244/11.34 = $ 2.84 = $ 284
Price/Earnings Ratio
The P/E ratio enables investors of an organization to determine the relative value of a company. The ratio gives a comparison of the market price per share with the earnings per share (Fernandez & Campo 2010). The P/E ratio illustrates the stock market valuation of the earnings. A high value of the P/E ratio translates to a high amount of the stock market paid by the investors for the earnings of a company. Investors rely on the P/E ratio as the most reliable technique of stock valuation (Kaplan & Ruback 1995).
Price/Earnings Ratio = Stock Price/ EPS = 42.4/0.63 = $ 673.1
General Motor Company had an EPS of 0.63 as of 31st March 2012 and the market share price was 42.4. However, the share price of the organization fluctuated continuously over the twelve months. The fluctuations caused significant variations in the value of P/E ratio. For instance, P/E ratio in February 2012 was given by 36.2/0.63, which translated to 574.6.p. Despite the fact that most investors prefer the P/E ratio, it is mainly used to estimate future performance of an organization. Therefore, the figures, in this case, can be used to determine the future performance of the company (Penman 1987).
Discounted Free Cash Flow
Discounted cash flow method entails three main models, which include the dividend discounted model, the weighted average cost of capital, and free cash flow to equity model. Since the expected cash flow of General Motors is set for five years, it will be appropriate to apply the free cash flow to the equity model (FCFE) (Weingartner, 1977). The formula for FCFE = Cash flow from operations-Capital expenditures + (New debt financing-debt repayment).
From the data provided in the Company’s cash flow report, the calculations can be worked using the following figures.
Capital Expenditure = $ (8,086,000)
Cash Flow from operations = $ 10, 605,000
Long term debt issue = $ 1, 412,000
Total debt repaid = $ (5,094,000)
FCFE = 10, 605,000-(8,086,000) + (1, 412,000- (5, 094,000))
= $ 9,025, 000
Due to the expected increase in the rate of returns, it is therefore important to calculate the expected forecast free cash flow to equity of the organization. The calculation will accommodate the following assumptions (Kieso, Weygandt & Warfield 2007). The first assumption is that the increase in the rate for the first year will be 3% due to high share prices and earnings per share. In the next four years, the rate will increase by 4% since the share prices will still increase at a higher rate (White1997). During the sixth year, the rates will increase by 1% constantly since the share prices will have stabilized. Based on the above assumptions, it is therefore important to determine the cost of equity (Fernandez & Campo 2010).
Cost of Equity = Risk free rate + market risk premium
R = Rf + β (Rm-Rf)
The risk-free rate of the stock market is 3.92% while the market risk premium in New York markets can be assumed to be 3.5. General Motors has a Beta value of 1. 71
R = 3.92 + 1.71x 3.5 = 9.905
The value of equity is assumed to be equivalent to the sum of the present value of the cash flow for a period of five years. The same case applies to the terminal value of the organization.
PV=FCFE/ (1 +R) t x1 = 9,025, 000/ (1 +9.95)1x1 + 9,025, 000/ (1 +9.95)2x1+ 9,025, 000/ (1 +9.95)3x1+ 9,025, 000/ (1 +9.95)4x1+ 9,025, 000/ (1 +9.95)5x1
PV= 724, 023,000/0.0995
The value of equity = 724, 023,00o +727.67
The value per market share is given by (724, 023,00o +727.67)/ 0.63 = 8.23 = $ 823
Reconciliation of the Values Obtained
From the above calculations, the NAV method gave a lower value of $ 284. The P/E method gave a higher value of $ 673.1. The DCF approach gave the highest value of $ 823. The NAV approach relies on historical data while DCF and P/E methods use the values derived from the market. The P/E approach is based on the investors’ perception and focuses on the profits of the organization (Kaplan & Ruback 1995). In General Motors’ case the DCF method is more appropriate since it focuses on the cash flows of the organization.
Conclusion
Based on this analysis, it is evident that by using different methods to appraise the value delivered to the shareholders the organization has managed to deliver the value to its shareholders. However, the global financial crisis greatly interfered with the performance of the company’s shares in the stock market. After the crisis, the share prices and earnings per share increased at a constant rate. The good performance is expected to continue for the next five years provided the company can predict the changes in the financial market.
Reference List
Arthur, P 2003. The turning wheel: the story of General Motors through twenty-five years, Doubleday, New York.
Bloomberg Businessweek, 2012. General Motors Company Financials. Web.
Booth, L1999. ‘Estimating the equity risk premium and equity costs: new way of looking at old data’, Journal of Applied Corporate Finance, vol. 12. no. 1, pp.100-112.
Damodaran A 2000. The dark side of valuation: firms with no earnings, no history and comparables. Web.
David, F 2002. Sloan Rules: Alfred P. Sloan and the triumph of General Motors, University of Chicago Press, Chicago.
Fernandez, P & Campo, J. 2010. Market risk premium used in 2010 by Professors: a survey 1, 500 answers, IESE Business School, New York.
Kaplan, S. N & Ruback, R.S. 1995. ‘The valuation of cash flow forecasts: an empirical analysis’, Journal of Finance, Vol. 50. no. 4, pp. 1059-1093.
Kieso, D.E, Weygandt, J.J. & Warfield, T.D. 2007. Intermediate accounting, John Wiley & Sons, New York.
Litzenberger, R.H 1979. ‘The effect of personal taxes and dividends on capital asset prices: theory and empirical evidence’, Journal of Financial Economics, Vol. 7. no. 5, pp. 163-196.
Partch, M.M 1987. ‘The creation of a class of limited voting common stock and shareholder wealth’, Journal of Financial Economics, vol. 18. no. 2, pp. 313-340.
Penman, S. H. 1987. ‘The distribution of earnings news over time and seasonality in aggregate stock returns’, Journal of Financial Economics, vol. 18. no. 2, pp. 199-228.
Statman, M. 2004. ‘Optimistic capital budgeting forecasts: an experiment’, Financial Management, vol. 14, no. 4, pp. 27-33.
Weingartner, H.M. 1977. ‘Capital rationing: authors in search of a plot’, Journal of Finance, vol. no. 32, pp.1403-1432.
White, G.I. 1997. The Analysis and use of financial statements, Wiley & Sons, New York.
William, L. 2010. Practical Financial Management, South-Western College Publisher, Tennessee.