Introduction
Six Sigma refers to a management strategy aimed at enhancing the quality of products and organizational processes. It uses a statistical model to evaluate process variations (Chiarini 2013, p. 19). Moreover, it enables corporate leaders to assess the causes of defects in a process and act accordingly. Manufacturing companies use Six Sigma to improve productivity, manage process changes, and enhance quality (Chiarini 2013, p. 23).
Disciplined application of data, the reinvention of business processes, statistical analysis, understanding of consumer needs, and assiduous management are the forces that drive the success of Six Sigma. This report will discuss the various statistical tools and instruments that organizational leaders use to enhance quality. It will also analyze a case study of an organization that uses Six Sigma to improve its processes and quality.
Aims and Objectives
The objective of this study is to analyze the different statistical tools and techniques that organizations use to enhance quality. The paper also aims at analyzing the application of Six Sigma at Wipro Technologies.
Problem Statement
Six Sigma has enabled organizations to streamline operational processes and enhance quality.
Quality Improvement Statistical Tools and Techniques
Scholars have explored numerous quality enhancement techniques and statistical tools. They include Ishikawa’s seven essential tools, the seven deadly diseases of management, Taguchi methods, Kaizen’s Continuous improvement, and team problem solving among others.
Ishikawa’s Seven Basic Tools
The Ishikawa’s seven essential tools comprise a collection of graphical techniques that facilitate troubleshooting problems associated with quality. The tools can be used by individuals with limited skills in statistics to address quality-related problems. The renowned weapons of Benkei inspired Ishikawa to come up with the seven basic tools (Bilsel & Lin 2012, p. 139). They are check sheet, cause-and-effect diagram, control chart, Pareto chart, histogram, Run chart, and scatter diagram.
Cause-and-Effect Diagram
The cause-and-effect chart is also referred to as the Fishbone diagram. It enables organizational leaders to identify the cause of defects. Managers use the chart to determine if errors arise due to hardware or software malfunctioning. It also helps to assess the contribution of management or employees’ skills to the defects. Bill and Lin (2012, p. 142) argues, “While a scatter diagram describes a particular bivariate relationship in detail, the cause-and-effect diagram identifies all causal factors of a quality characteristic in one chart”. The figure below represents a cause-and-effect diagram.

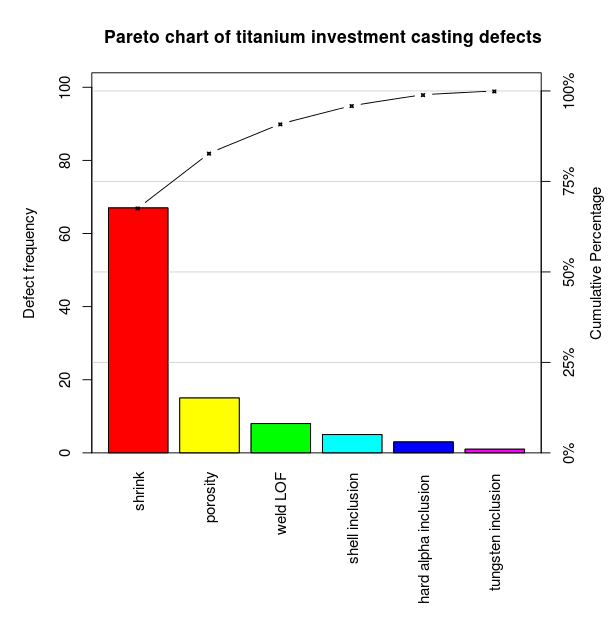
Pareto Chart
A Pareto diagram refers to a frequency chart that comprises bars arranged in descending order. The bars represent the various problems that might contribute to defects. The assumption behind the Pareto diagram is that “most of the quality problems are due to a small percentage of the possible causes” (Bilsel & Lin 2012, p. 143). The diagram organizes the causes according to the rate of recurrence of defects, which allows leaders to identify the factors that contribute to a high number of errors and address them. Below is an example of a Pareto chart.
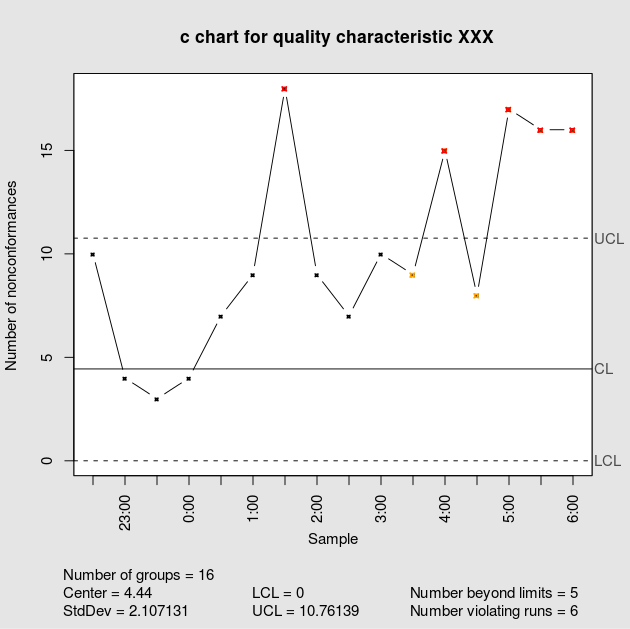
Control Chart
In many cases, it is difficult for organizations to establish standard weights and dimensions of the deliverables. In such situations, they set the lower and upper limits that are tolerable. The organizational stakeholders and project managers are responsible for setting acceptable limits. The control chart contains a line in the middle, which is referred to as the “mean”. Bill and Lin (2012, p. 145) allege that the line represents “the middle of the range of an acceptable variation”. Below is an example of a control chart.
Histogram
A histogram comprises a graphical depiction of frequency counts of particular defects. The Y-axis includes the rate of occurrence of defects while the x-axis contains the unit intervals of a factor such as the seriousness of the errors. The objective of the histogram is to elaborate on the distribution features of a parameter like skewness, central tendency, overall shape, and dispersion (Bilsel & Lin 2012, p. 147). It enables leaders to understand the nature of the problem they are handling. Below is an example of a histogram.

Run Chart
Run chat helps to monitor the behavior of a problem of interest for a given period. In an organizational environment, a run chart contributes to analyzing the trend of a particular process using its historical data (Bilsel & Lin 2012, p. 150). Below is an example of a run chart.
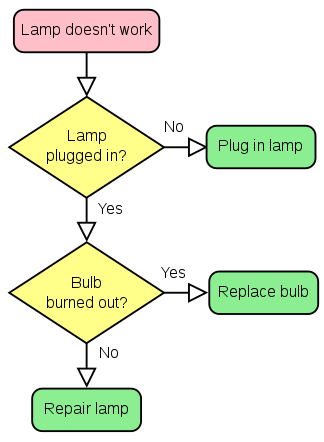
Flow Chart
A flow chart shows how processes or systems run from the start to the end and their correlation. Organizational leaders can use a flow chart to monitor a process and identify possible quality challenges (Bilsel & Lin 2012, p. 151). Below is an example of a flow chart that determines defects in a lamp.
Scatter Diagram
A scatter diagram helps to evaluate the correlation between dependent and independent variables. For instance, it can be used to determine the relationship between two defects. The managers can use a scatter diagram to identify how one form of error leads to the occurrence of another (Bilsel & Lin 2012, p. 151). The figure below represents a scatter diagram for the quality characteristic.

Seven Deadly Diseases of Management
The seven factors that inhibit the success of management are the absence of steadiness of purpose, emphasis on immediate benefits, Assessment of performance, the mobility of management, dependence on visible figures, high medical costs, and high liability costs. Many entrepreneurs do not understand why they are in business (Petit 2012, p. 69). Thus, managers can hardly make an appropriate arrangement to guarantee the success of business in the future. Overemphasis on yearly or quarterly results makes it difficult for managers to lay strategies that can ensure business survival.
American managers value employee appraisal and reward workers based on performance. Such a management strategy inhibits long-term planning, discourages teamwork, and encourages unhealthy competition among workers (Petit 2012, p. 72). It becomes hard for leaders to involve employees in the formulation of mechanisms that can boost cooperation and productivity.
Employees believe that working in teams deny them an opportunity to be noticed and rewarded as it would be difficult for managers to determine the input of individual workers. Rewarding employees based on performance results in the mobility of management and increased turnover. Experienced workers leave a company in search of organizations that appreciate their contributions. It becomes hard for organizations to retain employees who understand the company, its dynamics, and its problems.
Many American managers have a problem with relying on visible figures. They depend on ancient beliefs, which hold that whatever is immeasurable is hard to manage (Petit 2012, p. 75). Today, managers deal with challenges that are incalculable but require managing. For instance, it is hard for them to quantify the impacts of fulfilling consumer demands or the cost of hiring untrained workers. Managers must consider incalculable benefits and costs that affect businesses as they contribute to growth. Excessive medical expenses are challenges that affect managers in contemporary business.
Organizations are required to ensure their workers and pay them for days that they do not work due to injuries that arise in workplaces. Despite the enactment of the Affordable Care Act, organizations continue to incur high medical costs. Petit (2012, p. 76) argues, “Organizations incur excessive costs of liability swelled by lawyers that work on contingency fees”. It has become hard for managers to run obstetric firms due to liabilities attributed to malpractices. Today, there are few obstetricians in eastern North Carolina because lawyers have made it hard for the professionals to work in the area. They cannot afford the cost of malpractice insurance.
Petit (2012, p. 77) outlines strategies of transformational administration that can help to deal with the seven deadly diseases of management. Organizational leaders must establish a constancy of purpose to enhance product development and service delivery. They should also do away with performance appraisal to facilitate the realization of quality. Managers should not consider only prices when awarding the contract to suppliers. Instead, they must work on modalities to reduce costs and deal with single suppliers for individual items (Petit 2012, p. 77). Enhancing the production system can go a long way towards improving quality and efficiency and minimizing operations costs. Organizational leaders should expel fear in the workplace to enable employees to operate efficiently. Cooperation between different departments is paramount to curb potential challenges and enhance productivity. Managers should cease working with numerical goals and do away with quotas.
Experimentation and Taguchi Methods
Taguchi methods refer to statistical techniques that help to enhance the quality of products and services (Krishnaiah & Shahabudeen 2012, p. 43). They are also used in advertising, marketing, engineering, and biotechnology. The methods are credited for three key contributions to statistics. They are loss functions, off-line quality control, and design of experiments. The loss function is premised on the need to ensure that a process achieves the desired outcome. Excessive variations in production lead to the manufacture of poor quality products (Krishnaiah & Shahabudeen 2012, p. 45). Thus, to guarantee excellence, it is imperative to have a clear knowledge of quality costs. The loss function emphasizes the need to consider externalities that prevent organizations from operating smoothly. For example, managers should consider short-term costs like non-conformance that might lead to clients incurring losses due to premature wear-out. It would help to improve brand reputation and generate profit.
According to Krishnaiah and Shahabudeen (2012, p. 47), “the best opportunity to eliminate the variation of quality of the final product is during the design of a product and its manufacturing processes”. Thus, it is imperative to be innovative when developing a system intended to produce a particular product or run a manufacturing process. Moreover, it is crucial to devise parameters that will work with the established system. The parameters should reduce the impacts on performance attributed to environment, variation in the manufacture, and cumulative damage. Once the managers have designed the settings and have explicit knowledge of their effects on performance, they can embark on tolerance design. It entails controlling and minimizing deviation in the vital elements that might affect performance.
Taguchi methods advocate the inclusion of “outer array” in product or service experimentation. According to Krishnaiah and Shahabudeen (2012, p. 51), “the outer array should simulate the random environment in which the product would function”. It would help to identify potential challenges that might arise during the use of the product.
Team Problem Solving and Continuous Improvement
In the organizational setting, team problem-solving entails employees from different departments sharing ideas on how to deal with operational challenges and enhance productivity. It promotes cooperation and helps to minimize risks. The Kaizen model of continuous improvement is premised on teamwork (Singh & Singh 2015, p. 81). Most processes have room for improvement; however, many managers do not think of improving processes that they deem to run smoothly. According to the Kaizen model, all employees should work as a team to determine inefficiencies at different levels within an organization (Singh & Singh 2015, p. 102). Additionally, they should share ideas on how to deal with the inefficiencies. Kaizen approach seeks to enhance safety, productivity, waste reduction, and efficiency.
Causes of Variation in Processes
Organizational processes are prone to changes. A Six Sigma team faces two types of changes, which are the special cause and common cause variations. The common cause variation is also referred to as noise, and it reveals the real capacity of a process. The special cause variations are not common in most processes and arise as a result of errors in the process environment. Organizational leaders ought to focus on special cause variation as they impede the improvement of processes (Bortolotti & Romano 2012, p. 517). Eradicating the change enables leaders to have control of operations and discern potential noise. Variations in processes arise due to poor judgments. Application of personal judgment in a process results in bias, which causes changes in process outcomes (Bortolotti & Romano 2012, p. 519). Automated processes are less prone to variations. In some cases, the causes of changes may be manual. For instance, a person may use the wrong procedures or feed wrong commands to a process.
Process Improvement
Process improvement entails identification, analysis, and enhancement of existing systems to improve quality. Bortolotti and Romano (2012, p. 520) hold, “process improvement often involves a systematic approach, which follows a particular methodology”. Nonetheless, managers can consider various approaches, which include lean manufacturing and benchmarking. Organizations can alter processes, introduce new sub-processes, or remove some procedures for the sake of improvement. Process improvement is an ongoing activity and must be accompanied by an evaluation of particular areas of enhancement. The success of process improvement manifests in the form of quality products, enhanced productivity, customer satisfaction, increased profit, and organizational efficiency.
Six Sigma Implementation
Six Sigma uses numeric and statistical methods to minimize errors in manufacturing processes and enhance quality (Hahn, Doganaksoy & Hoerl 2014, p. 321). Organizations should involve all employees in the implementation of Six Sigma. They should begin with a pilot project before implementing Six Sigma. It helps to identify processes that might cause defects. An individual managing the implementation process must be a “black belt” expert. Thus, it is imperative to train employees if the organization does not have experienced staff. After identifying the black belt expert, an organization should establish a team that will run the implementation process.
The team should comprise workers who participated in the pilot project. The implementation process requires thorough planning. Thus, the established team should institute “an organizational structure that streamlines the target production process to reduce defects” (Hahn, Doganaksoy & Hoerl 2014, p. 324). The project leader should identify problem areas and work with team members to create solutions. Six Sigma is a continuous process; thus the pilot project should establish the foundation for its implementation. After the pilot project, the black belt expert should assume leadership of the implementation process and work with team members to guarantee smooth operations. Evaluation of a pilot project would help to identify the parameters that work well and correct those that fail.
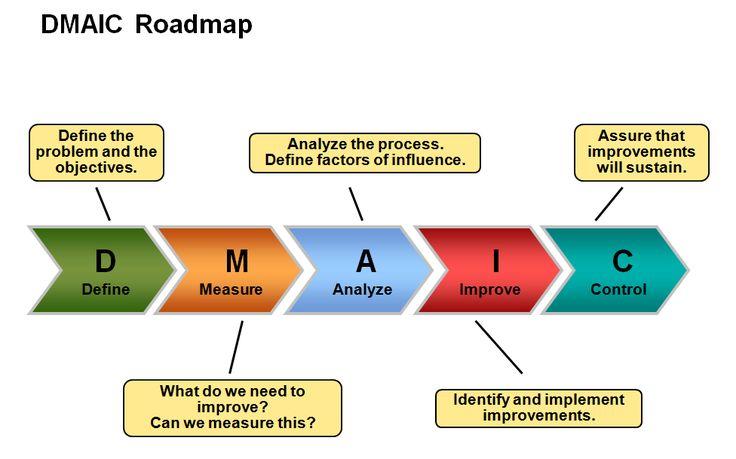
DMAIC Roadmap
DMAIC stands for Define, Measure, Analyze, Improve, and Control, which is a roadmap for process enhancement and problem-solving (Harrison 2012, p. 31). A majority of the organizations use the DMAIC approach to implementing Six Sigma. The define phase entails assembling a team to determine the cause of the problems ailing an organization and looking for ways to address them. The measurement stage involves engaging team members and other workers in collecting baseline measures and clients’ opinions. The measurement phase is quite difficult since employees implement it as they work (Harrison 2012, p. 32). The analysis phase involves the creation of graphs to facilitate the unfolding of the data narrative. The team creates Pareto and trend charts that help to establish the data story. The improvement phase entails using lean principles and instruments to come up with solutions that can address the root causes. The solutions are tested using the PDSA (Plan Do Study Act) instrument. The control phase involves the validation of the established solutions. The team identifies additional control measures to ensure that processes run smoothly. Below is a diagram for the DMAIC roadmap.
Background
Wipro Limited is an Indian company that was established in 1945. Initially, it specialized in the production of vegetable oil. It later ventured into the information technology industry. Currently, the company offers technology-oriented business solutions to numerous customers across the globe. It has at least 40 establishments worldwide. The company offers unique business values to clients through a blend of quality frameworks, process excellence, and service delivery novelty (Sharma, Pandla & Gupta 2012, p. 4).
The demand by an American communication networks company to enhance product performance via the Six Sigma method led to Wipro Limited investing in this model. Moreover, the company wanted to align its operations to consumer needs and to guarantee continuous improvement. Wipro Limited also wanted to “bring in rigor inactive upstream processes of software development life cycle” (Sharma, Pandla & Gupta 2012, p. 4). Today, the company uses Six Sigma to enhance quality and service delivery.
Statistical Tools Used
Wipro Limited uses many statistical tools to implement Six Sigma. They included descriptive statistics and control charts (Gygi et al. 2012, p. 24). The descriptive statistics are critical in the measurement phase. The company uses it to gather data regarding consumer needs and product performance. It computes the central tendency of consumer demand based on the collected information. It also calculates the variability of consumer needs. Descriptive statistics helps the company to come up with explicit knowledge of the desired products. After Wipro Limited develops software aimed at enhancing product performance, it uses control charts to gauge its consistency. It helps to determine if the software will be manageable and function without variations.
Results
The application of Six Sigma has enabled Wipro Limited to enhance its operations and provide quality services to clients. It can quickly collect quantitative information regarding customers’ requirements. The company has managed to minimize defects in software development by enhancing upstream processes. Today, Wipro uses Six Sigma to assist clients to understand their operations and products, own them, and realize sustained growth.
Conclusion
Six Sigma enables organizations to achieve success. It has helped Wipro Limited to enhance internal performance and customer satisfaction. The performance enhancement has contributed to reducing defects, thus producing quality products. The implementation of Six Sigma has enabled the company to manufacture goods and services that satisfy international benchmarks. Additionally, it has guaranteed robustness in the organization, which enables it to fulfill and even surpass consumer prospects. The implementation of Six Sigma has allowed Wipro Limited to embrace a culture of quality.
Recommendation
For Wipro Limited to continue dominating the technology industry, it should use the performance of rival companies as its yardstick. The company should use Six Sigma to come up with original dimensions of quality management. Moreover, it must blend Six Sigma with stretched goals. It should set optimistic and aggressive goals.
Reference List
Bilsel, R & Lin, D 2012, ‘Ishikawa cause and effect diagrams using capture-recapture techniques’, Quality Technology & Quantitative Management, vol. 9, no. 2, pp. 137-152.
Bortolotti, T & Romano, P 2012, ‘Lean first, then automate: a framework for process improvement in pure service companies: a case study’, Production Planning & Control: The Management of Operations, vol. 23, no. 7, pp. 513-522.
Chiarini, A 2013, ‘Relationships between total quality management and six sigma inside European manufacturing companies: a dedicated survey’, International Journal of Productivity and Quality Management, vol. 11, no. 2, pp. 17-29.
Gygi, C, DeCarlo, N, Williams, B & Covey, S 2012, Six sigma for dummies, Wiley Dreamtech, India.
Hahn, J, Doganaksoy, N & Hoerl, R 2014, ‘The evolution of six sigma’, Quality Engineering, vol. 12, no. 3, pp. 317-326.
Harrison, J 2012, ‘Six sigma vs. lean manufacturing: which is right for your company?’ Foundry Management & Technology, vol. 13, no. 7, pp. 31-32.
Krishnaiah, K & Shahabudeen, P 2012, Applied design experiments and Taguchi methods, PHI Learning Private Limited, New Delhi.
Petit, F 2012, ‘Deadly diseases or innovative practices: how Deming would view today’s executive MBA sector’, Journal of Executive Education, vol. 11, no. 1, pp. 67-78.
Sharma, M, Pandla, K & Gupta, P 2012, Case study on six sigma at Wipro Technologies: thrust on quality, Web.
Singh, J & Singh, H 2015, ‘Continuous improvement philosophy – literature review and directions’, Benchmarking: An International Journal, vol. 22, no. 1, pp. 75-119.