Introduction
The focus on growth forecast will be on AGL Energy Limited (AGK). The company is 175 years old, and it is Australia’s principal renewable energy generator. It is also the country’s biggest supplier of energy. AGL Energy Company is known to distribute large quantities of renewable energy to its customers. It aims at providing viable energy for future investors, consumers and the community. The company’s major investments are wind and hydropower.
It is also pursuing developments in landfill gas, biomass among others. The company has over 3million customers (“Annual reports” p.1). It is listed in the Australia Stock Exchange with an investment grade of BBB (“AGL Energy Limited (“AGL Energy Limited (AGK)” p. 1). This is a reputable company with high profits. It also has many investors in its shares. For example, the number of shareholders is over 4 million. It is therefore important to analyse its financials in order to see how forecasting has helped the company in its growth. The forecasting will be for ten years up to 2021.
Growth rate of AGL Energy Limited
Growth is necessary for a given business. In order to achieve growth, planning is necessary. Planning involves anticipating the financial requirements of a given business and identifying the best policy to control the growth. A growth forecast will involve projecting a firm’s future financial position (growth). This is also referred to as modelling (“Word Dynamo: Model” par.1). Models are necessary for forecasting the future of a company.
This is because they represent reality. They can tell if the company is headed for closure or will continue in business. They also help investors to know if they should invest in the company or not. It can be done by use of the sales-driven model and decomposing the “plug”. Forecasting growth entails knowing the following: why a company needs cash (how much it needs and where it goes) and where the company will get the cash from (internal or external sources). The sales-driven model is used for growth forecasts. It is as follows:
Sales Forecasts – Asset Requirements – Financing Requirements.
The tables shown below are the balance sheet and profit and loss statements for AGL Energy Limited (AGK.
In order for AGL Energy Limited (AGK) to increase its sales, it needs to do the following:
It needs to increase the number of energy generation plants such as plant, warehousing capacity, number of service delivery vehicles and administrative staff and offices.
It needs to increase its inventory and the number of employees per production facility in order for the company to serve many customers.
It needs to increase its advertising costs in order to lure many customers.
In the sales forecast, the assumption is that the ratios are stable over the ten-year period.
Forecasting sales for AGL Energy Limited for the next 10 years:
Sales2021= Sales2011 * (1+0.1264)10
=7,072.50*(1.1264)10
=$23,254.09 million
This means that within the next ten years, AGL Energy’s sales will have grown by 228.8%.
Forecasting expenses for AGL Energy Limited for the next 10 years:
Expenses2021= (Expenses/ Sales) * Sales2021
= (6,139.00/7,072.50) * 23,254.09
=0.86800*23,254.09
=$20,184.78million
The general expenses for AGL Energy Limited for the next ten years will also have grown by 228.8%.
Forecasting EBITDA (Profit before net financing costs, depreciation and amortization) for the next 10 years:
EBITDA2021= (EBITDA/Sales)* Sales2021
= (967.10/7072.50)* 23,254.09
= 0.1367* 23,254.09= $3,179.80 million
Therefore, earnings before interest, tax, depreciation, amortisation and financing costs will also rise by 228.8%.
In order to support the forecasted growth, financing is necessary. It is therefore required to forecast financing needs for AGL Energy Limited for the next ten years.
New investment needed to support increased sales will involve both the current and fixed assets.
Total assets2021= (Total Assets/ Sales) * Sales2021
= (9,695.70/ 7072.50) *23,254.09
=1.37090* 23,254.09= $31,879.06 million
Total Assets2011= $9,695.70 million
Required New Investment2021= 31,879.06- 9,695.70= $22,183.36 million
The extra assets (investment) needed to run AGL’s forecasted growth is $22,183.36 million. This is the amount that AGL Energy needs to raise in order to purchase assets needed to support 10-year sales.
There are three sources of financing for the new investment. These are: spontaneous, internal equity and external capital markets. The spontaneous sources are the accounts payable, wages payable, accruals and taxes payable.
AGL’s trade and other payables= 12.06% of sales
Current tax liabilities= 2.36% of sales
Other current liabilities= 0.21% of sales
Total spontaneous sources= 14.63% of sales
Forecasting AGL’S spontaneous sources:
Spontaneous Liabilities2021= (Spontaneous Liabilities/ Sales) * Sales2021
= [(853.1+167.2+15.1)/7072.5] * 23,254.09
= (1035.4/7072.5) * 23,254.09
=0.1464 * 23,254.09=$3,404.35 million
Spontaneous Liabilities2011= $1035.4 million
Spontaneous Financing2021= $3,404.35- $1035.4
=$2,368.95 million
Analysis of all the accounts in the financial statement, compared to the company’s Pro-forma financial statement
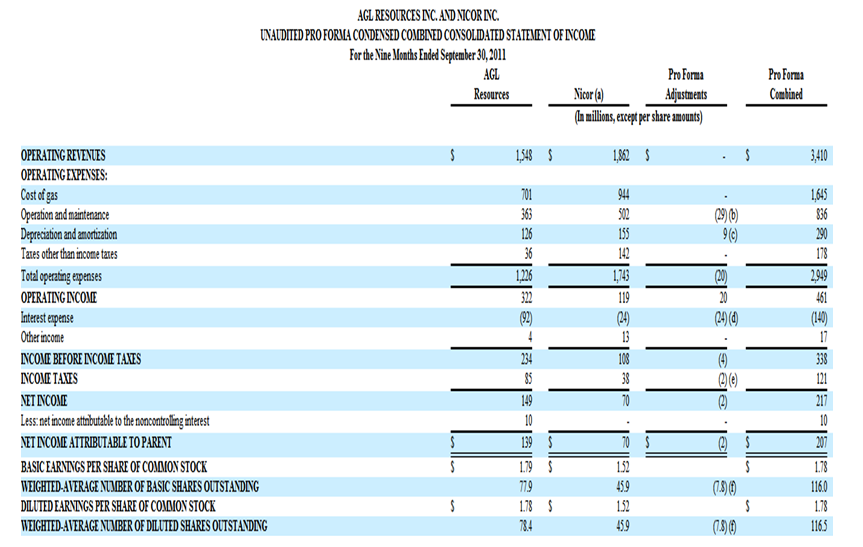
The available Pro-forma financial statements for AGL Energy Limited are for 2011. The table below shows the Pro-forma income statement for the company for the period ended September 30, 2011 (“Unaudited Pro-forma statements” p. 2).
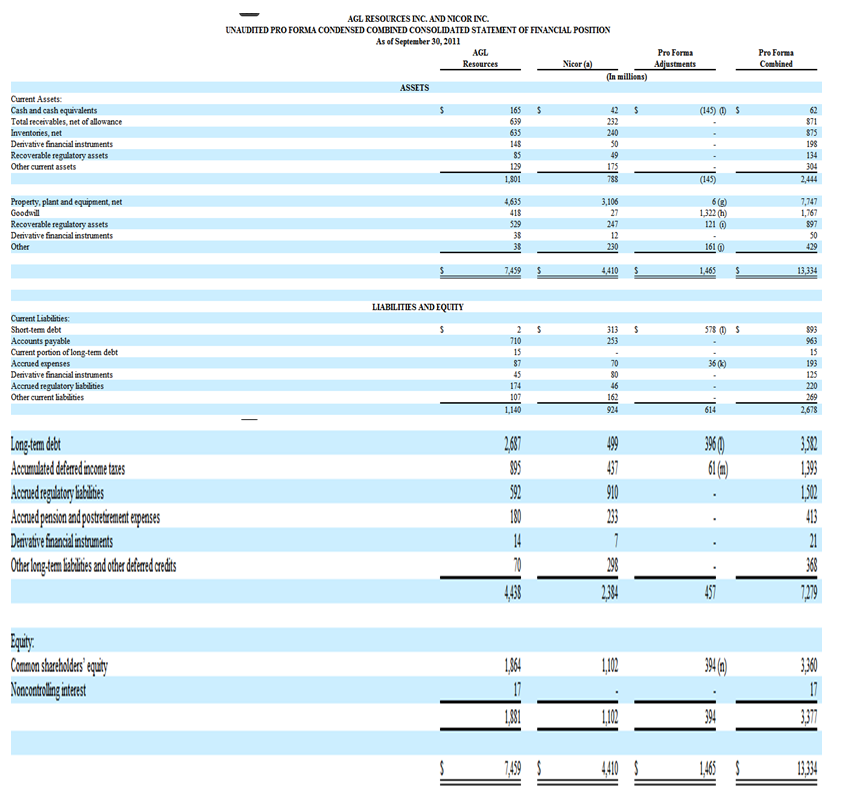
The table below shows the Pro-forma balance sheet for AGL Energy Limited for the year ended September 30, 2011 (“Unaudited Pro-forma statements” p. 4).
The table below shows the forecasted income statement for AGL Energy Limited for the next ten years ended September 30, 2021.
The table below shows the forecasted balance sheet for AGL Energy Limited for the next ten years ended September 30, 2021.
The recommended strategy for dealing with threats facing AGL Energy Limited
AGL Energy Limited is currently facing the threat of poor forecasting. It is, therefore, necessary to advocate for strategies that can be used to control these mistakes from occurring again.
Use of various simulation techniques in forecasting
In order to make more accurate forecasts, AGL Energy should adopt different ways of forecasting. This is because, currently, their actual financial statement figures are very different from their forecasts. Some of the simulation methods that can be used are scenario simulations, Monte Carlo simulation, trend analysis, sales growth forecasts, among others. With many forecasts in place, it is possible to reduce errors. This is because, with various forecasts, the average forecast figures can be obtained. It is important to note that poor forecasting can lead to unfavourable variations in financial figures. Such variations can affect investors’ confidence level as well as the company’s profits.
AGL Energy should aim at adopting risk reduction measures
The level of business risk can affect a business’s performance. For example, it has been observed that AGL’s expenses have been increasing beyond forecasted figures. More specifically, short term debts. In order to solve this problem, it is necessary to assess the level of risk involved in short term external financing. The interest rates, inflation rates as well security requirements for acquiring a loan should be carefully assessed.
Risk managers should compare interest rates offered by various financing firms before settling on a particular loan. Risk can also be reduced by the use of models. For example, standard deviation, variance, covariance and correlation coefficients can be used. These can measure the rate of return of an investment before undertaking the investing. This way, AGL Energy can reduce losses from poor investment decisions. Equity is also a less risky form of financing as compared to long term loans. It is also cheap and flexible.
Undertake internal financing
Internal sources of financing are much cheaper than external ones. Therefore, AGL Energy can aim at increasing the level of equity and retained earnings. Retained earnings are cheap in financing a business because they incur no interest or security. AGL Energy can increase the level of retained earnings by reducing dividend payments. This way, fewer costs can be incurred in financing future investments. Additionally, this can reduce the risk associated with external borrowing.
Scenarios depicting possible outcomes
Forecasting involves modelling. Models are said to represent reality. By forecasting, businesses can reduce risk and losses. AGL Energy uses Pro-forma financial statements to forecast the future. Forecasting can also be done using other measures such as trend analysis. Possible outcomes can be obtained from the projection of different scenarios. With the outcomes, a business can allocate its resources efficiently and effectively. In order to be able to simulate or forecast for risk or possible outcomes, scenario simulation analysis can be used. This involves approximation of the future outcomes and possible outcomes under different scenarios.
Scenario simulation involves various steps
Assume a set of circumstances about a business environment, firm or decisions: This involves projecting future financial values. These can be balance sheets or income statement values.
Building a model: This entails entering values into a simulation table and observing their outcome. The outcome should be greater than or less than the target values. For expenses, the target value should be less than or equal to the outcome. On the contrary, it is favourable if incomes are higher than the outcomes.
Repeat the above steps for a variety of scenarios: The above procedures or processes can be repeated for different scenarios and variables. These variables can be income statements or balance sheet figures.
Example:
If AGL Energy Limited wants to estimate next year’s EBITDA:
Current sales (sales for 2011) = $7,072.50
Expected sales growth2012= Sales2011 * (1+ 0.1264)
=7,072.50*(1.1264) = $7966..46
= [(7966.46-7,072.50)/ 7,072.50] * 100= 12.64%
Expected finance costs= 84% of sales
Next year’s expected EBITDA= 7,072.50* 1.1264* (1-0.84) =$1,274.60
Simulation goes ahead and approximates possible outcomes: Simulation gives outcomes that are both higher and lower than the set targets.
For example:
If the expected growth is expected to be as slow as 9.64% and as rapid as 15.64%, and if it is approximated that finance costs won’t exceed 89% or fall below 79%, the following outcomes would be obtained:
Note: The results have been obtained by use of what-if analysis function of excel
Evaluate the results
By use of Excel’s what-if analysis, it is possible to know the range of possible outcomes from a given scenario. For example, from the above scenario table, the following outcomes for AGL Energy Limited can be deduced (Aseem 1).
Earnings before interest, tax, depreciation and amortisation (EBITDA) will be greater than or equal to $100 million. Additionally, EBITDA will be less than or equal to $200 million.
Works Cited
AGL Energy Limited (AGK). 2012. Web.
Word Dynamo: Model. 2012. Web.
Annual reports. 2012. Web.
Unaudited Pro-forma statements. 2011. Web.
Aseem 2010. How to use Excel’s What-If Analysis. Web.