Almarai Company is one of the world’s largest manufacturers of dairy products and beverages, primarily operating in the Kingdom of Saudi Arabia. The organization was founded in 1977 and gradually expanded the scope of its services (Almarai, 2020). At present, Almarai offers a large variety of goods, including dairy products, juices, bakery, and poultry (Almarai, 2020). Nevertheless, the core source of revenue of the company is fresh dairy products; therefore, it is essential to examine this type of production. Ultimately, the current paper presents a thorough product analysis of milk provided by Almarai Company.
Product Overview
While Almarai Company operates in the Food & Beverage sector, the organization is widely known for its dairy products specifically. Figure 1 below demonstrates the revenue segmentation by product:
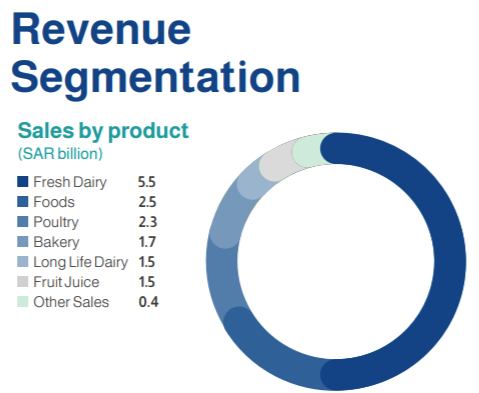
Consequently, among the large variety of dairy products, including yogurts, laban, and milk powders, milk is the core focus of the company. Furthermore, Almarai presents different variations of milk, such as fresh, long life, flavored, and evaporated milk (Almarai, 2021). At present, fresh dairy production is accountable for more than 40% of the total sales and is the core focus of the company (Almarai, 2021). Ultimately, Almarai primarily focuses on dairy production and offers a large variety of high-quality milk.
Product Quality
One of the core objectives of Almarai Company is to meet the expectations of the customers and maintain the highest possible quality of the production and services. This mission is particularly relevant in the food industry due to the exposing risks of food safety and potentially hazardous situations, such as poisoning and infections (Kotsanopoulos & Arvanitoyannis, 2017). In turn, a high-quality production attracts new customers and creates a loyal client base. The motto of the company, “Quality you can trust” transparently reflects the attention to detail during the production process (Almarai, 2020). The company promotes cutting-edge technology manufacturing, 24-hour veterinary care for animals, and nutritious feed to maintain the highest quality of the products (Almarai, 2020). Ultimately, one of the most significant risks in the food industry is the quality of the production, and Almarai Company presents an exemplary performance in this aspect.
Pricing Policy
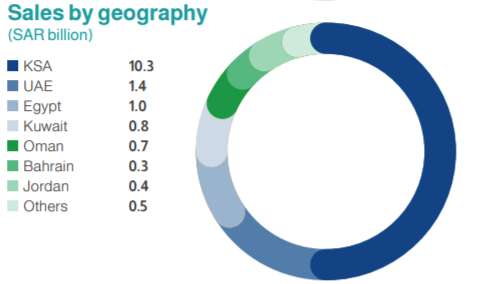
Having summarized the product information and the standards of quality, it is possible to analyze the financial data concerning the production. The international benchmarking demonstrates that the average price of milk for one liter in Saudi Arabia is equal to 4.5 SAR or $1.2 (“Saudi Arabia”, 2021). The statistics demonstrate that the average prices of Milk in Saudi Arabia are within the medium range on an international scale. The Kingdom of Saudi Arabia takes the most extensive share of the sales by a large margin; the geographic revenue segmentation is presented below in Figure 2:
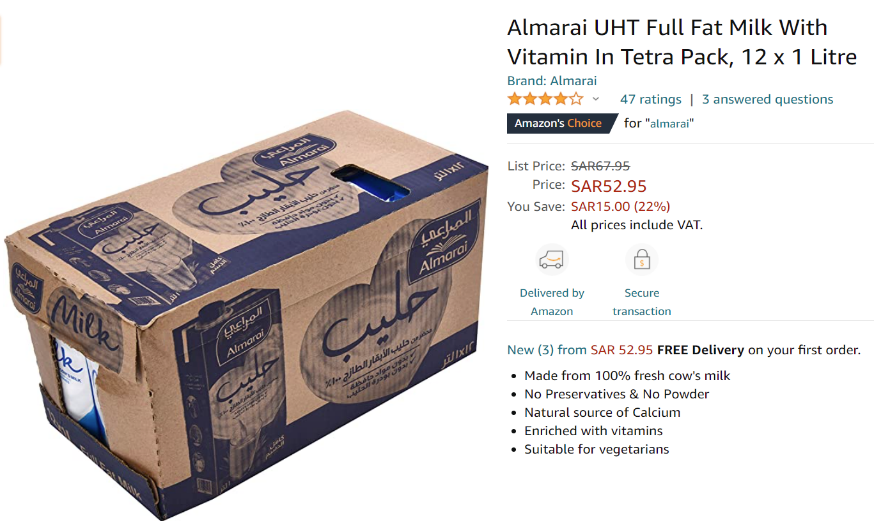
Concerning Almarai, the company offers a slightly higher pricing range of products on the territory of Saudi Arabia. The average price for full-fat 1l milk ranges from 5 to 7 SAR, which can be explained by the vast prominence of Almarai in the country and the highest standards of quality. Nevertheless, the company also offers promotional, seasonal, and wholesale commerce, which allows the customers to save money: for instance, the example of a 12-unit package of full-fat milk with vitamins is presented below in Figure 3:
Ultimately, Almarai Company offers a slightly higher pricing range compared to the average numbers in the country, and this phenomenon is explained in the following sub-chapter.
Factors Affecting Price
One of the most influential factors affecting prices is the focus on the quality of the product. As mentioned briefly before, Almarai Company values the highest standards of quality associated with the latest manufacturing technologies, exclusively nutritious food for farm animals, and 24-hour veterinary care (Almarai, 2020). Evidently, the cost of raw materials, including the maintenance of said technologies, has a correlated positive impact on the total price. Furthermore, Almarai Company is the largest manufacturer of dairy products in the Kingdom of Saudi Arabia and has a significant advantage in reputation and total revenue compared to its competitors. These internal strengths could be used to effectively adjust the pricing strategy without losing the trust of the customers.
Another reason for the increased prices of milk is the economic decision by the Kingdom of Saudi Arabia. The COVID-19 had significantly affected the national economy, and the government implemented a 10% increase in value-added tax (VAT) to mitigate the economic downfall (Almarai, 2020). Nevertheless, despite the downturn, Almarai transparently declared that the company had successfully altered the pricing strategy and mitigated the production costs without causing significant inconvenience to its customers (Almarai 2020). Ultimately, the pricing range of Almarai’s milk is slightly higher than the country average due to the focus on the highest quality and authority to alter the prices without losing the trust of the consumers.
Profits
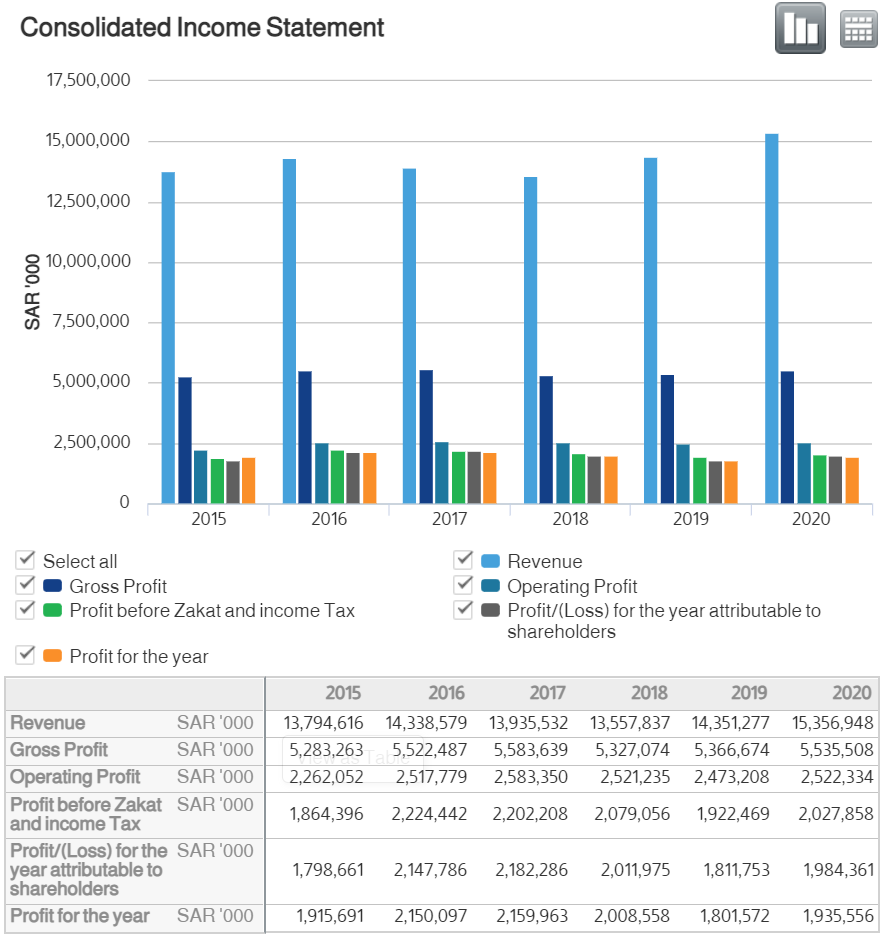
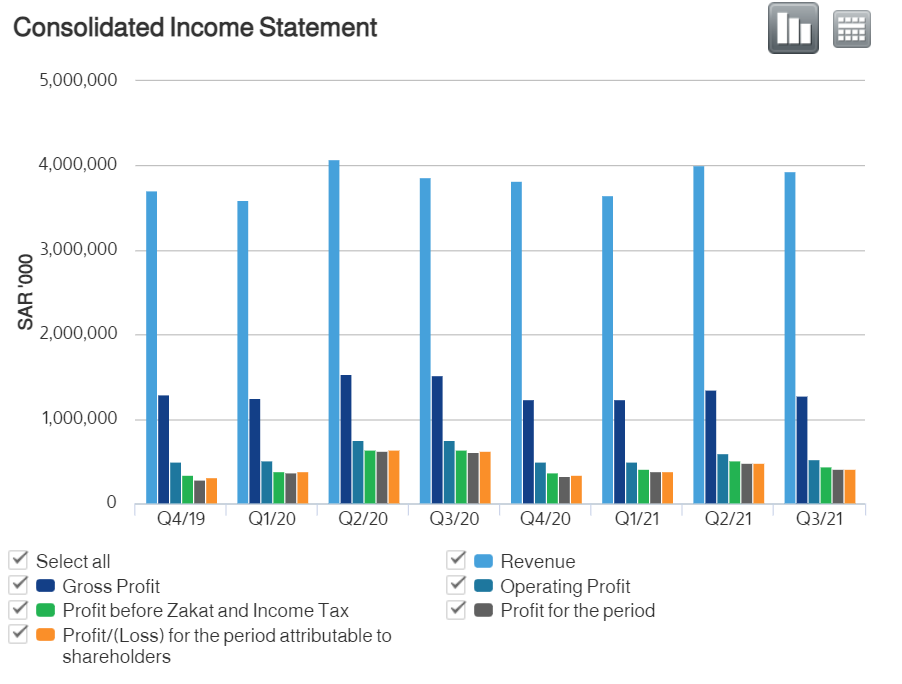
Despite the pandemic restrictions and the increased VAT, Almarai Company achieved exemplary results in 2020. Figures 4 and 5 below demonstrate the profits of the company on an annual and quarterly basis:
The overall profit margin for the year 2020 is equal to:
![]()
Consequently, it is essential to provide the approximate profit margin for milk specifically. Unfortunately, the closest metric for certain products can be found in the quarterly financial statements, which represent the revenue and net profit for dairy products and juice simultaneously. The profits of these segments can be seen below in Figure 6:
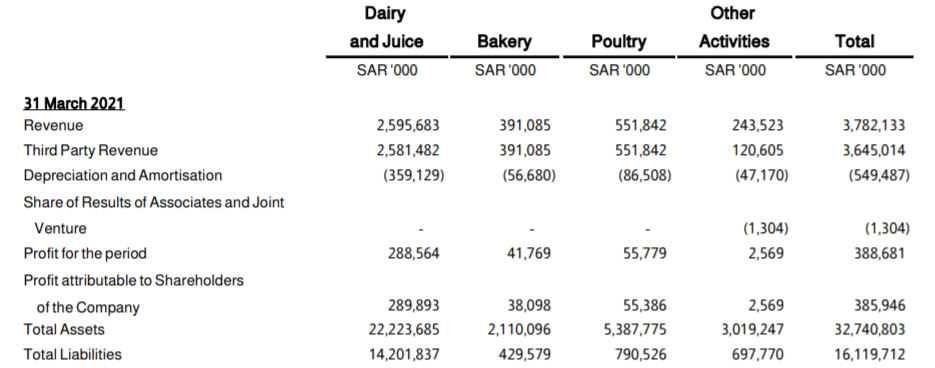
Based on these data, it is possible to calculate the approximate profit margin for dairy products and juice, which roughly correlates with milk specifically:
![]()
While the profit margin for dairy products and juice in Q1 2021 is slightly lower than the average for 2020, this phenomenon can be explained by the fluctuations of overall profits in 2021. As seen from Figure 5, the revenue and profits for Q2 and Q3 2020 significantly exceed those from the consequent year, which indicates the differences in the profit margin. From these considerations, it is safe to assume that the overall net profit margin for milk ranges from 10% to 14%, which is a considerably healthy profit.
Demand Analysis
Consequently, it is impossible to provide a thorough analysis of pricing policies without addressing the demand and supply concepts. In general, demand and supply analysis is an essential metric, which allows the experts to calculate the appropriate quantity and prices of the production. There is a large number of variables that determine the effectiveness of the chosen strategies. Concerning demand analysis, the general framework includes the five determinants, such as the price of products, the income of buyers, costs of interrelated goods, preferences of the customers, and expectations (Amadeo, 2021). In other words, each of these factors directly influences the demand ratio.
Price has an inverted correlation; therefore, if it rises, the demand decreases. Income, preferences, and expectations have a positive correlation; thus, if the quantity of these characteristics rises, so does the demand (Amadeo, 2021). Lastly, the cost of interrelated goods generally has an inverted correlation; however, if the prices of substitutes rise, the demand for the product also rises. For instance, if the prices for yogurts increase, the demand for milk will most likely increase as well. Ultimately, demand analysis is a complex calculation that takes a large number of factors into account.
Demand Function
Since the company does not provide accurate data concerning milk sales, the current analysis utilizes hypothetical information for demand and supply analyses. The demand function is represented by the general formula Qx = f(Px, I, Py,…), where Qx is the quantity of demand, Px – price for one unit of product, Py – the price of interrelated products, and other factors, such as expectations and preferences. For the current analysis, Px is equal to 5SAR and I is the average household monthly income of 14,823SAR, which is counted in thousands (“Household income”, 2019). Lastly, the average price of juice, which is considered a weak substitute for milk, is equal to 4SAR. Therefore, to calculate the correlation between price and quantity, the income and substitute variables are held constant. The estimated quantity of 1l fresh milk demand within a single month is equal to 8. Therefore, the formula is:
![]()
![]()
Since juice is a substituted correlated product, it is associated with a positive dependence. The results are following:
![]()
Therefore, the inverted formula, which represents the demand curve is:
![]()
The graphic illustration of the formula is presented below in Figure 7:
In Figure 7, P1 and Q1 indicate the initial price and quantity per month for one household, which are equal to 5 and 5.86 accordingly. P2 and Q2 are equal to 6 and 5.06 and demonstrate the correlation between the variables after a 20% increase in price. A thorough analysis of the chart is presented in the ‘Elasticity’ chapter.
Changes in Quantity Demanded
Evidently, each of the five demand determinants can cause a significant shift in the demand curve. For instance, in case the average income of the household increases by 10,000, and the price of juice increases by 2 SAR, then the equation would also change (the graphic representation is provided in Figure 8):
![]()
![]()
![]()
In such a case, the quantity demand for milk under the price of 5SAR would increase from approximately 5.86 to 7.1, which is expected due to the increased income of the consumers. Ultimately, the demand analysis using hypothetical data might be significantly different from the real-life scenarios; however, the calculations can transparently reflect the correlation of variables and demand movement.
Quantity Demand Shift
COVID-19 is generally associated with lower demand for elastic products, and this issue is particularly relevant in the food industry due to the substitutability of the products. Furthermore, the mentioned VAT increase in the Kingdom of Saudi Arabia has also negatively affected the quantity of demand. Nevertheless, concerning the empirical data, Almarai Company has successfully overcome these challenges, and the financial report 2020 reflects the positive change (Almarai, 2020). Furthermore, the stable growth of demand indicates the trust of customers in the Almarai brand and the relatively inelastic nature of milk compared to other beverages. As a result, Almarai focuses on the continuous supply process to meet the expectations of the consumers.
Supply Analysis
Supply analysis is another effective instrument to determine the appropriate price and quantity of products. In general, supply indicates the quantity of products that the company wishes to produce and sell (Beggs, 2019). Similar to quantity of demand, there are five primary determinants of supply, including price, cost of materials, existing technologies, expectations, and a number of sellers in the industry (Beggs, 2019). Price, technologies, and quantity of sellers have a positive correlation on the overall supply, while the cost of raw materials demonstrates an inverted correlation (Beggs, 2019). Consequently, similar to demand, expectations affect the quantity of supply individually, depending on the case and the organization.
Supply Function
The example presented in the current sub-chapter utilizes hypothetical data; therefore, the graphic representation of the function might differ significantly from the real-world scenario. Furthermore, Almarai Company produces a large quantity of milk daily; therefore, smaller hypothetical numbers are used to not overcomplicate the graphic. Assume Almarai Company establishes five packages of 1l milk for one household per month as a baseline, while the cost of production of one package is 2 SAR. Then, the supply function would take the following form:
![]()
![]()
![]()
![]()
Based on Figure 9, the quantity of supply Q1 is equal to 9 packages of 1l milk per household each month, while P1 is equal to 5 SAR. Consequently, if the price P2 is increased to 6 SAR, the quantity of supply Q2 will increase to approximately 12.3 packages. While this scenario is hypothetical, it reflects the policy of zero shortage, implemented by Almarai Company.
Shortage of Production
As mentioned before, Almarai Company emphasizes the customer experience as the core focus of the organization. From these considerations, the company makes its best efforts to ensure zero product shortages (Almarai, 2020). Ultimately, even during the peak of COVID-19, there were no instances of product shortages due to the organization’s policies (Almarai, 2020). However, the zero shortage policy cannot be achieved without a certain extent of surplus. Therefore, the objective supply curve of the company should closely resemble Figure 9, which demonstrates the surplus of production.
Marginal Analysis and Equilibrium
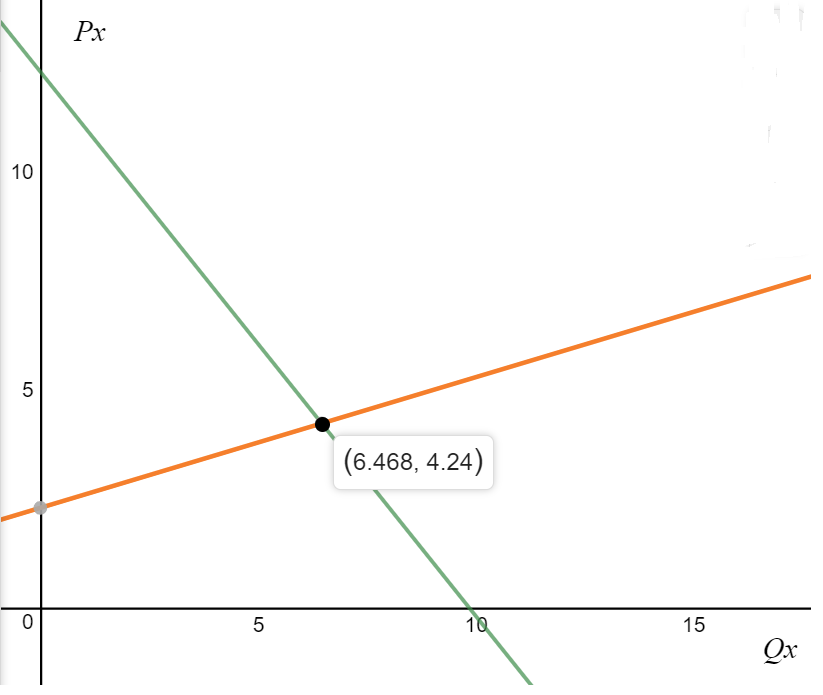
Having provided demand and supply curves, it is possible to discuss the marginal analysis and establish a market equilibrium. In general, market equilibrium concerns a certain point where the quantity of supply perfectly matches the quantity demanded (Reed, 2018). Therefore, the equilibrium point implies zero shortage and zero surplus, which is generally acknowledged as the common objective of the business. In other words, while achieving market equilibrium is a complicated task, most organizations utilize this notion to understand the necessary amount of supply and demand. An example of market equilibrium utilizing demand and supply curves from the previous sub-chapters is presented below in Figure 10:
Furthermore, the companies also utilize marginal analysis to maximize profits. Similar to demand and supply analyses, the marginal analysis generally uses hypothetical data to evaluate the correlation between costs and benefits for any change in the organization (Bhasin, 2020). These differences are further utilized to determine the objective functions of the company and appropriately distribute the funding between manufacturing, marketing, customer relationships, research, and other areas that might increase the overall profits (Shapiro, 2020). Lastly, the organizations use indifference curves to better understand the preferences of the customers and, thus, identify the objective functions of the company. In general, an indifference curve is a graphic representation of the customer’s perceived value of two types of products. For instance, Figure 11 below represents the value of milk and a weak substitute, such as yogurt:
The curve in Figure 11 demonstrates a hypothetical example of an indifference curve, each point of which is a combination of milk and yogurt quantity that would satisfy the customer. Consequently, the orange line or the budget line separates the graph on T and S segments. The area governed by T represents the combinations of two products that simultaneously satisfy the customers and are within the consumers’ budget range. On the other hand, the area governed by S represents the combinations that are not accessible to the customers based on their current income values.
Elasticity
Lastly, it is essential to discuss the notion of elasticity utilizing the demand and supply analysis of Almarai milk. First, the price elasticity of demand (PED) demonstrates the overall elasticity of the product and is calculated as %change in quantity/ %change in price (Agarwal, 2021). Therefore, it is possible to calculate the PED of Almarai milk based on the numbers represented in Figure 7:
PED = -0.8059 < 1
As a result, the PED of milk is inelastic demand, which is an expected outcome for this product. Unlike a large number of beverages, milk has few to no alternatives that have the same vitamins and can be used in a variety of recipes. The inelasticity of milk can also explain the stable demand quantity of the product during the COVID-19 restrictions and economic recession that increased the VAT from 5% to 15% in the Kingdom of Saudi Arabia. All these factors have contributed to the successful policies of Almarai in milk distribution and the growth of revenue.
Consequently, income and cross-price elasticities of demand are useful metrics for most companies. As seen from the name, income elasticity determines the change of quantity demanded based on the income of the consumers, while cross-price elasticity demonstrates the correlation of prices between the product and its alternatives or substitutes. Based on the numbers in Figure 8, the calculations are following, where I is income and Py is the price of a substitute:
IED = ((Q2 – Q1)/Q1)/((I2 – I1)/I1) = ((7.1 – 5.86)/5.86)/((25000 – 14600)/14600) = 0.3
CED = ((Q2 – Q1)/Q1)/((Py2 – Py1)/Py1)) = ((7.1 – 5.86)/5.86)/((6-4)/4) = 0.42
Both variables are > 0 and demonstrate a positive correlation of demand for milk and an increase in income or prices of a substitute. Similar to PED, these findings are expected and follow the standard laws of demand and supply. Ultimately, Almarai company utilized similar analyses to determine the pricing and manufacturing strategies.
Conclusion
The current paper has presented a thorough analysis of milk in the production of Almarai Company. Milk is an inelastic product, which is demanded regardless of economic circumstances. Furthermore, Almarai has built its reputation as the manufacturer of high-quality products with zero shortages. Ultimately, the examination transparently demonstrated why Almarai was able to maintain the stable demand through COVID-19 and economic recession while increasing the total revenue.
References
Agarwal, P. (2021). Price elasticity of demand (PED). Intelligent Economist.
Almarai. (2020). We deliver: Annual report 2020. Web.
Almarai. (2021). Condensed consolidated interim financial statements and review report for the three-month period ended 31 March 2021. Web.
Almarai UHT full fat milk with vitamin in tetra pack. (2021). Amazon.
Amadeo, K. (2021). 5 determinants of demand with examples and formula. The Balance.
Beggs, J. (2019). The determinants of supply. ThoughtCo.
Household income and expenditure survey. (2019). General Authority of Statistics.
Kotsanopoulos, K. V., & Arvanitoyannis, I. S. (2017). The role of auditing, food safety, and food quality standards in the food industry: A review. Comprehensive Reviews in Food Science and Food Safety, 16(5), 760-775.
Milk – prices around the world, March 2021. (2021). GlobalProductPrices.
Saudi Arabia – milk – price, March 2021. (2021). GlobalProductPrices.
Shapiro, J. (2020). Why objective functions matter more as companies pivot in 2021. Forbes.