Introduction
The present report focuses on the financial performance of Ulta Beauty, a successful cosmetics brand from the United States. This company has managed to balance the externally attractive and attention-grabbing displays with ongoing revenue sources and employees’ best interests. Ulta Beauty has identified the priorities of American women purchasing cosmetics despite its lack of outlets in major shopping malls. The company has maintained a stable presence in the market through its customer expertise. It has equally entered several collaborations with prominent cosmetic and salon brands to provide trendy, innovative items. Ulta Beauty’s product assortment was kept fresh and relevant to customers by a dedicated merchandising team that kept track of current fashion trends, historical sales trends, and new product launches. This report provides an extended evaluation of Ulta Beauty’s financial performance statistics.
Company Introduction
Ulta Beauty’s range of products is diverse within its pricing approach, yet its goods may still be categorized successfully. Ulta’s physical presence comprises 847 stores located throughout the U.S. The firm primarily sells colored cosmetics and, therefore, heavily relies on fashion trends. Since cosmetic products are luxury goods, the industry generally showcases instances of high elasticity of demand. This notion concerns the purchasing capacity customers are willing to extend towards beauty shopping and the lack of consistency in their tastes. The industry itself factors brand power and social media marketing into its operational management. Therefore, it is not surprising that Ulta Beauty has invested heavily in online promotion, establishing social media accounts on Instagram and Twitter.
The beauty industry is a competitive and fragmented commercial field, particularly today when the COVID-19 pandemic has reduced the sums people would have as their income or savings. Department stores, specialty-focused retailers, duty-free airport shops, high-class cosmetic boutiques, and even pharmacies might be considered influential, at least to a certain degree. To secure a competitive advantage and follow the aims of its mission, Ulta Beauty fosters engagement with two diverse consumer demographics (David et al., 2021). Hence, the firm’s target audience includes either beauty enthusiasts without caveats or financially constrained beauty enthusiasts (Watanabe et al., 2018). A single-brand entity without corporate ties to multinational organizations should expect complications when competing against the well-established giants of the industry.
The inevitable clashes between human resources specialists and the budgeting department are not worth additional analysis. Ulta’s associate engagement score of 80% was in the top 25% of the world and was higher than the retail industry standard of 72% (Amberg & Fogarassy, 2019). Ulta was committed to investing in their employees’ development and providing possibilities for progress. They used a mix of existing managers, promoted staff, and outside hires to support additional stores. The overall trend, later apparent from the visualization of the current statistics, demonstrates the author’s rapid increase in productivity as of 2021.
Ulta Beauty is fully committed to delivering the best services to its customers, including all customers from all walks of life. The company has the mechanisms and facilities needed to help it grow its brand and reach out to more customers. Based on the financial data posted in the last year, the company has been experiencing a rise. The financial data indicates the recovery path since the pandemic hit, a common occurrence that has been happening in many domains and disciplines. In the recovering post-COVID economy, companies need to develop resilience towards any potential threats that threaten the beauty and cosmetics industry. The past five years will provide a larger dataset to help model progress and stock performance more accurately. Ulta Beauty should explore opportunities for increasing its efficiency in converting leads to sales. Increasing the diversity of techniques used in the business model will improve its appeal to more people, which will bolster Ulta Beauty’s competitive advantage.
Graphical Representations of Data
The data used in this analysis was derived from Yahoo Finance for Ulta Beauty, Inc.’s stock price. Ulta Beauty is listed on the Global Select Market (NASDAQ-QS) as ULTA with a market cap of 20.604 billion USD (“Ulta Beauty, Inc. (ULTA)”, 2021). Figure 1 is a graphical representation of the highest stock prices of ULTA over the last five years. As seen from the graph, Ulta Beauty experienced a decrease in price from $355.36 in August 2019 to $251.76 a month later. For five years, the stock has risen from the highest monthly stock price of $268.78 in October 2016 to the highest value of $392.00 recorded this year.
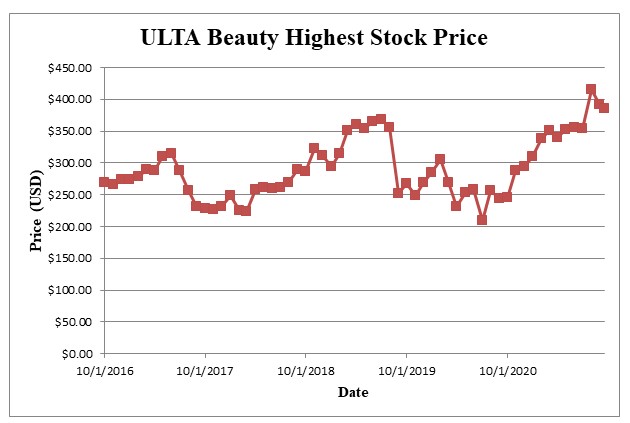
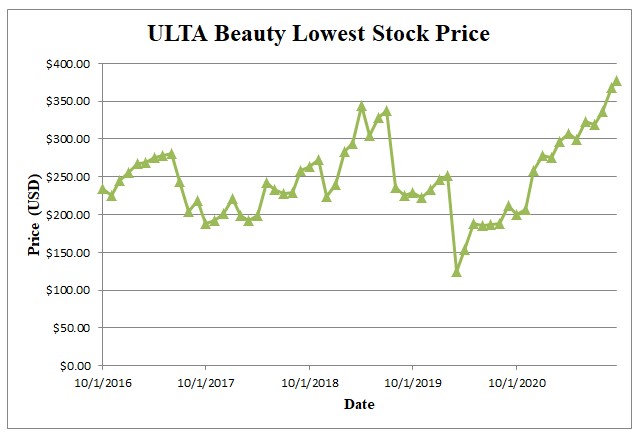
Figure 2 is a visual representation of the lowest stock prices in the last five years. The stock price has not been stable, which indicates the company experienced some challenges in that period. The company’s stock price fluctuates a lot, indicating high volatility. Despite the challenges faced by the company during the fluctuations, Ulta always finds a way to come back stronger economically (Maamoun, 2021). The company hit rock bottom in the share price in March 2020, with the lowest stock price recorded at $124.05. The time when the lowest stock price ever was recorded coincided with the biggest threat of the pandemic when lockdowns had been put in place and movement in most places ceased to help contain the pandemic. It is speculated that the fluctuations in the stock price have been due to uncertainties in the fashion industry coupled with unexpected occurrences that Ulta Beauty, Inc. faced.
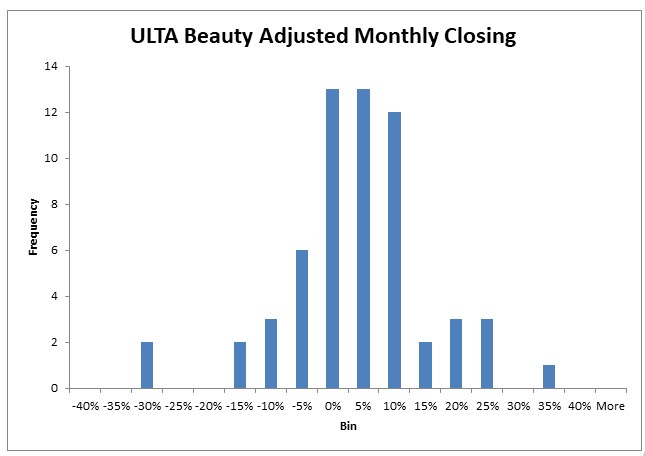
The adjusted closing stock price for Ulta Beauty was fairly distributed. Figure 3 represents the frequency of average monthly returns on Ulta beauty’s stock price. The histogram was plotted with equal intervals for the whole class of data of returns on stock price (Lukić, 2017). In the entire dataset with 61 observations, Ulta Beauty’s stock price recorded negative returns on 13 occasions. Zero returns were recorded on 14 occasions, the joint highest tying with a 5% return on the stock. There were 23 occasions when Ulta Beauty’s stock recorded a return of 10% or more. Overall, a positive net return was recorded on the stock price over 5 years.
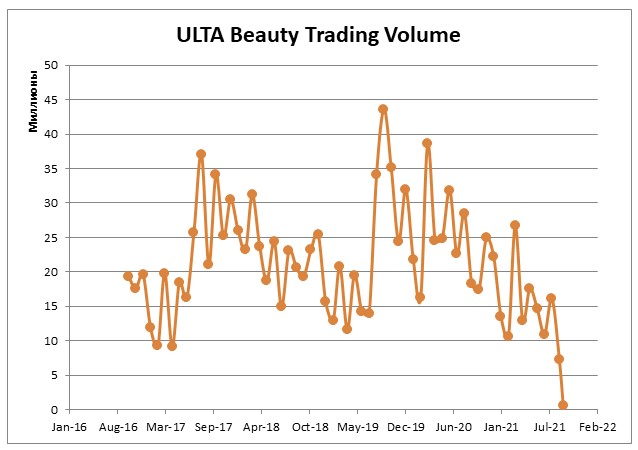
The adjusted trading stock volume for Ulta Beauty is shown in Figure 4. It describes how many shares are traded in a given period. The data provided shows the number of ULTA shares traded monthly on NASDAQ-QS over the last five years. Ulta Beauty consistently posted trading volumes of over 5 million shares monthly in all 60 observations for the 60 months leading to this month, September 2021. The month is not yet over; therefore, the amount of shares traded in this month is incomplete. It is worrying considering the records indicate the company has only registered 629,933 traded shares and yet the month is not over. Nevertheless, there is still time to turn the tide. In 61 observations, there are only three occasions when Ulta Beauty traded less than 10 million shares.
Descriptive Statistics
The descriptive statistics for this dataset are summarized in Table 1. There were 61 entries for the volume of shares traded. After analysis, the dataset was summarized to 60 calculable returns on the shares traded in five years. The mean/averages for the dataset ULTA shares traded monthly was 21,141,249.72, with the lowest at 629933 and the highest at 43627300. The numbers translate to a large value of the range of the data at 42,997,367, which indicates that either there were outliers in the dataset or the shares traded fluctuated highly in the last five years.
The average monthly return in the last five years was 0.014108314 with a standard deviation of 0.114832254. Both traded volume and returns had a higher standard deviation than the mean, which translates to data points being spread further from one another with no clusters in the dataset. The returns had a range of 0.651227, meaning it had outliers on the extremes (Fairhurst, 2017). The minimum return from the dataset is -0.31931 and the highest is 0.331915.
Table 1: Summary of Descriptive Summary Statistics
Conclusion
Ulta Beauty, Inc. is a company that has had a stellar record in the stock market. It is worth noting that the record is not without setbacks and pitfalls along the way but the ULTA stock always found a way to recover and come back stronger. Analysis of the ULTA five-year dataset brought up some interesting insights into the company’s stock performance. The graphical representation of the dataset also had interesting outcomes. Each chart represented a variable effect on the ULTA stock. The graphs plotted in this assignment using Excel and its Data Analysis Tool pack proved various issues about the stock market. First and foremost, evaluating shares requires a close analysis of numerous external features before concluding on the efficiency of an investment opportunity.
The stock price is just an indicator of the price at a given time or specific period on the stock market. They provide significant data on the fluctuations that occur in the stock price; the fluctuations can be used as indicators of possible directions a stock takes afterward to determine if one should buy a stock. Both high and low stock price indicators show a general picture of Ulta Beauty, Inc as a company that has experienced challenges but pulled through them. In all cases, the ULTA stock price shows the company is doing well.
The histogram represents the frequency distribution of the returns on the stock price shows that the company has a net positive return and thus a potential investment opportunity. Most of the classes fall on the positive side of the frequency distribution and that means the frequencies weigh the net return to that side because all classes are of equal intervals. The volume of ULTA shares traded on NASDAQ-QS is big and has been consistently over ten million every month. Currently, the volume of shares traded is low but that does not necessarily mean Ulta Beauty, Inc is having terrible performances that warrant dumping the stock.
References
Amberg, N., & Fogarassy, C. (2019). Green consumer behavior in the cosmetics market. Resources, 8(3), p. 137.
David, F. R., David, F. R., & David, M. E. (2017). Strategic management: concepts and cases: A competitive advantage approach. Pearson.
Fairhurst, D. S. (2017). Financial Modelling in Excel.
Lukić, Z. (2017). The art of company financial modeling. Croatian Operational Research Review, 8(2), 409-427.
Maamoun, A. (2021). Bold and beautiful (1st ed.). SAGE Publications: SAGE Business Cases Originals.
Ulta Beauty, Inc. (ULTA). Finance.yahoo.com. (2021).