The aim of this report is to analyze the website of Apple, an American multinational company developing consumer electronics, online services, and computer software, from an e-marketing perspective. The report will explore the key features of the website, its consumer demographics, and website statistics. Further, search engine optimization and social media use will be analyzed. Finally, recommendations for improvement based on the results of the analysis will be provided.
Description and Demonstration of Website
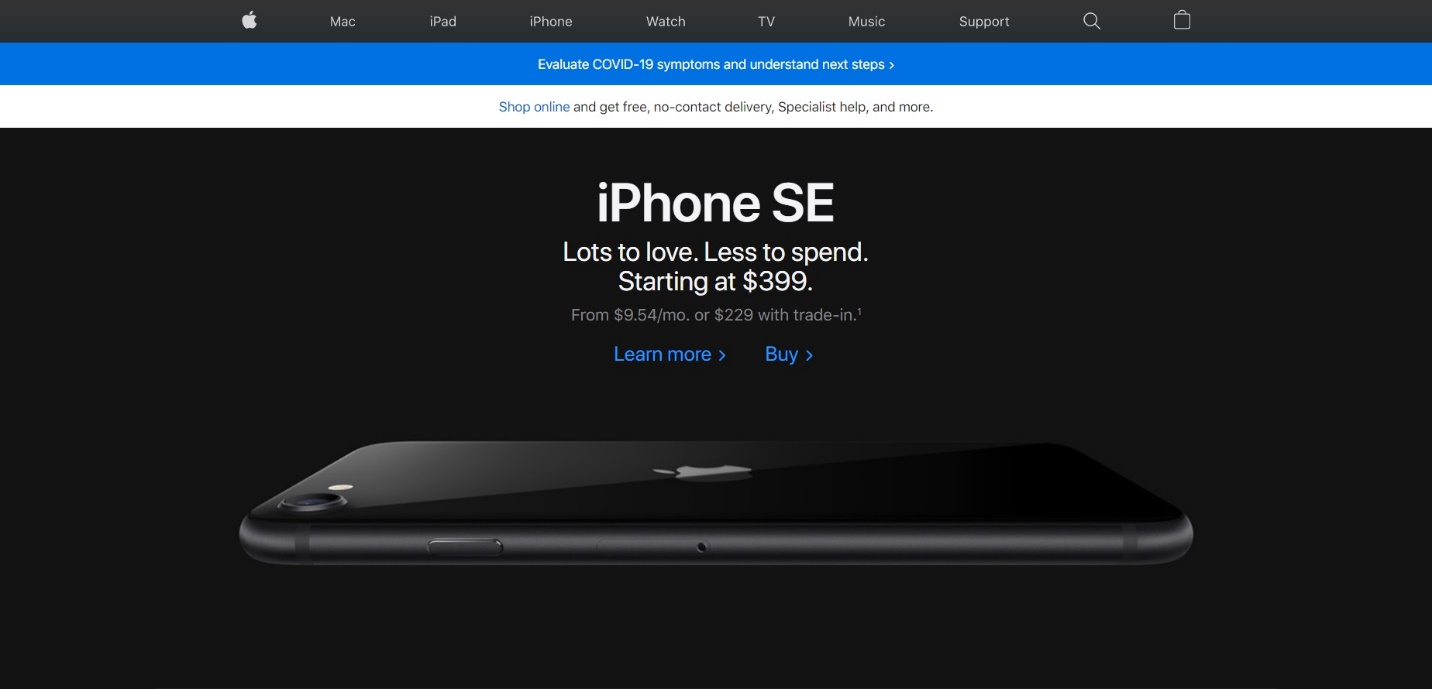
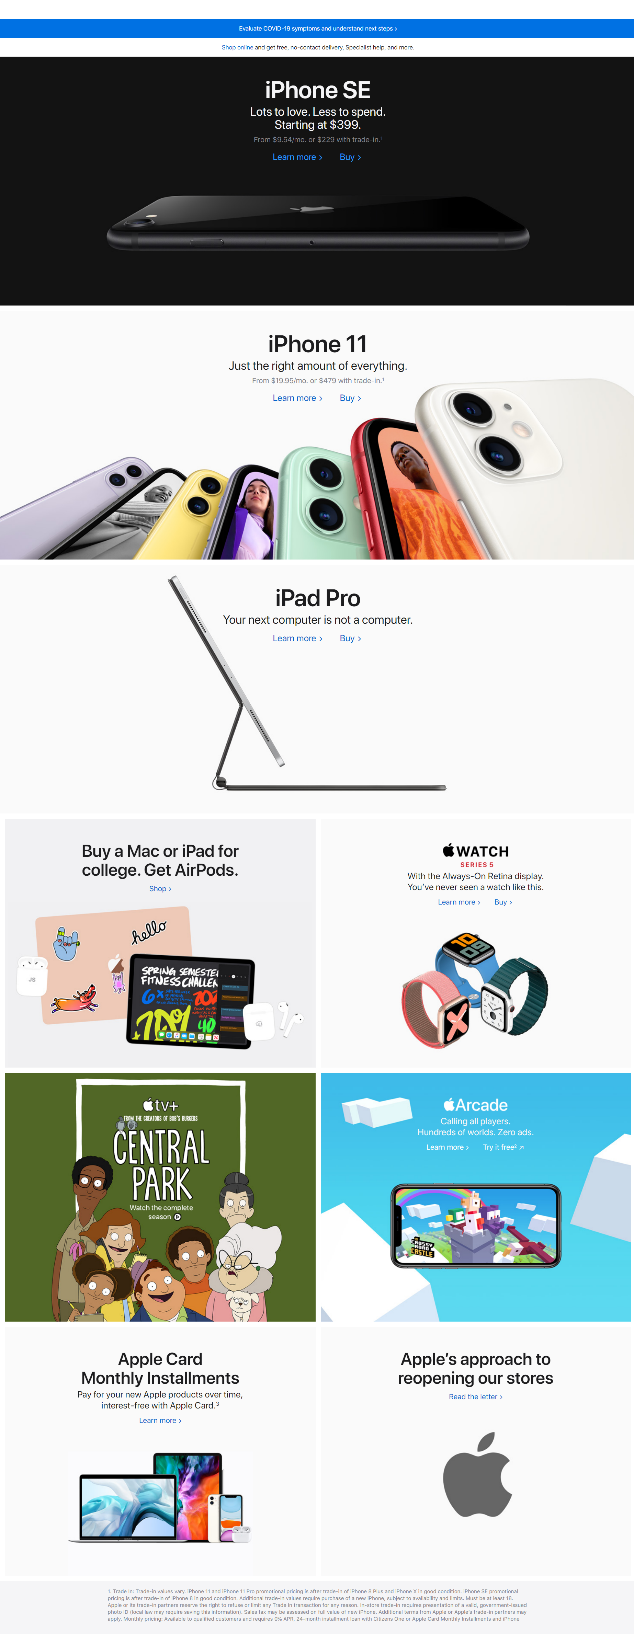
Apple is a large technology company offering its innovative products worldwide, so, presumably, users expect the company’s website to be as outstanding and well-designed as its products. Apple’s website, and its homepage, particularly its first screen, at the time of writing this report looks as shown in Figure 1 (see Appendix A for the view of the full homepage). So, at the homepage of its website, Apple introduces some of its products, such as iPhone SE, iPhone 11, and iPad Pro, to the visitor.
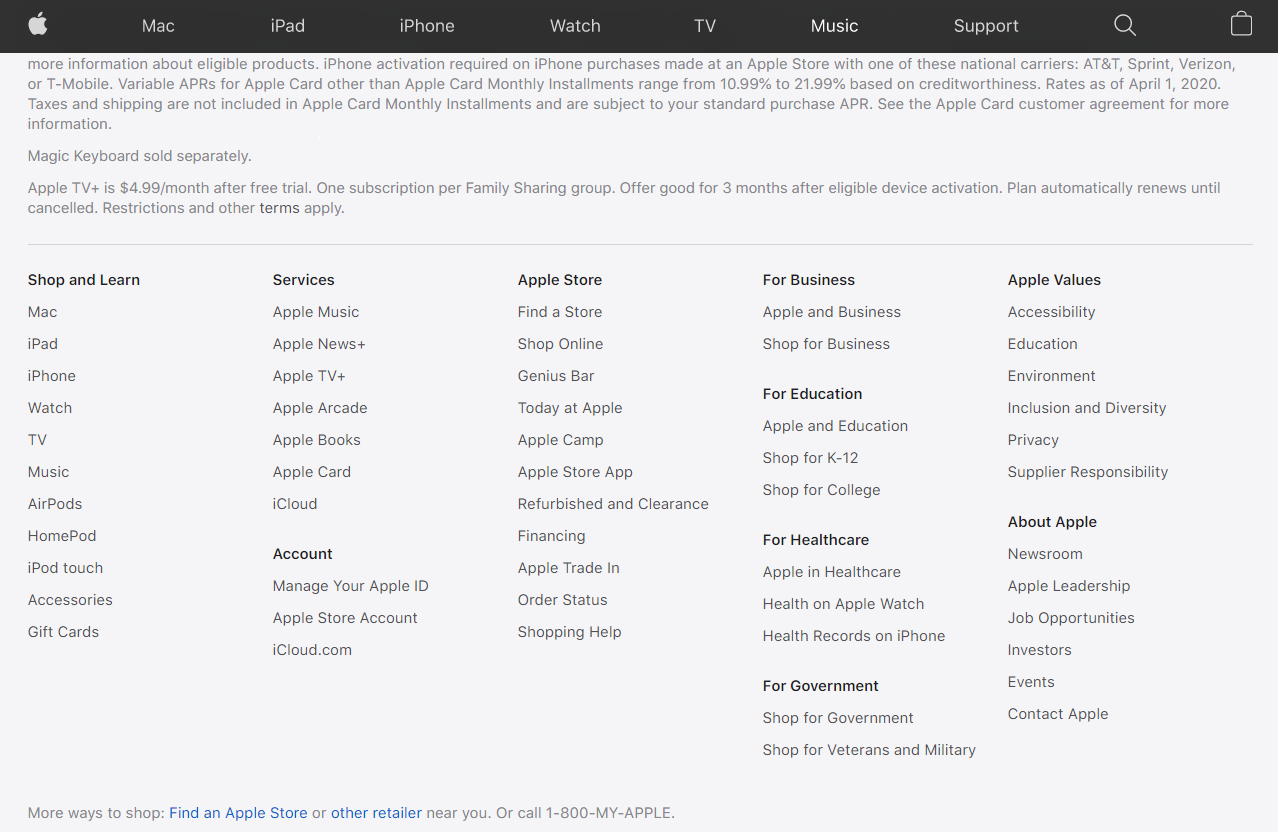
As a rule, webpages of Apple’s website have the same header and footer with menus that help users navigate the website. The top menu includes the homepage button that looks like the company’s logo, and buttons for available product categories: Mac, iPad, iPhone, Watch, TV, and Music (see Figure 1). This menu also contains buttons for support, search through the website, and a customer bag. It remains at the top of the page as the user scrolls down. The bottom menu is much more extensive and includes links to pages with other company’s products and services, as well as the information about the company (see Figure 2).
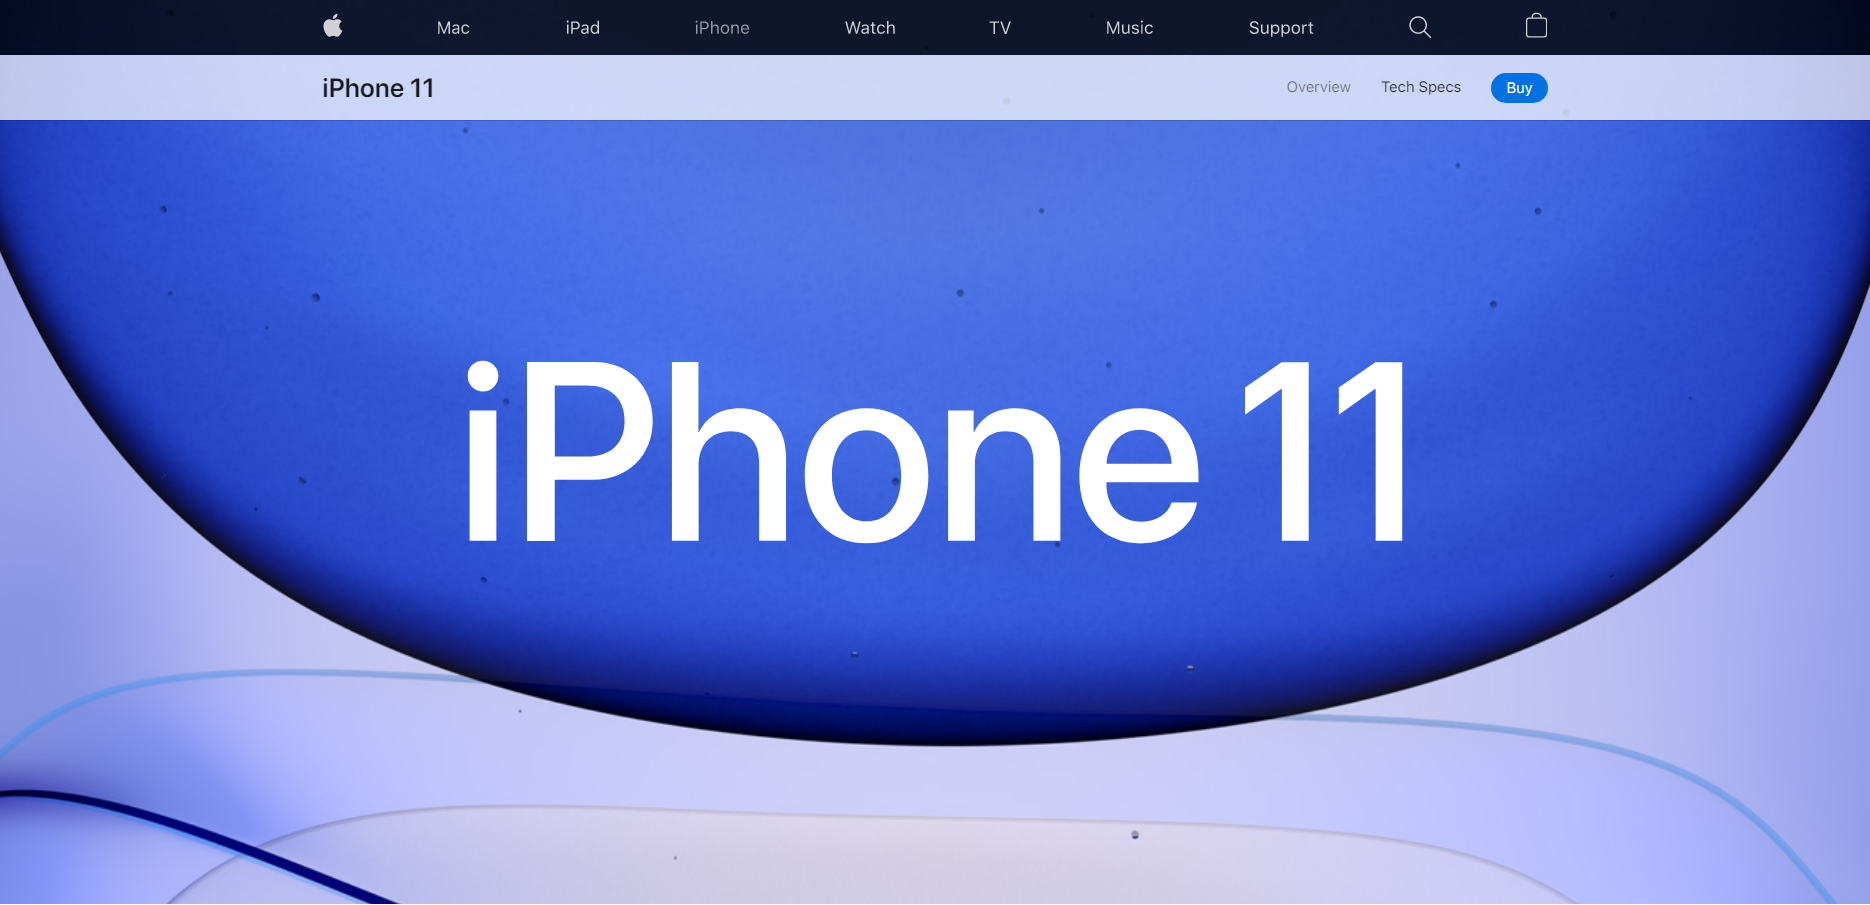
As for the content of the website, its key feature is the use of many visual elements, such as photos, graphics, videos, and animations, as well as compact blocks of text. Webpages with individual products usually have a submenu with three buttons: Overview, Tech Specs, and Buy (see Figure 3). The Overview page is designed to attract customers’ attention with visuals demonstrating features of the product (see Figure 4). The Tech Specs page primarily contains a detailed textual description of product characteristics. The Buy page uses a simple design and offers customers an opportunity to customize the device they are going to buy.
Another feature of Apple’s website is a special design of webpages intended to present the company’s product to the visitor, that is, the Overview pages. Some of these pages look like presentations, in which the images smoothly change each other, and users get the impression that they watch a film as they scroll down the page. One more useful feature of the website is that it allows customers to compare three different products of the same category. The characteristics of the compared products are organized in a three-column table, which makes it convenient for the user to see the differences among them. Overall, Apple’s website is attractive to its target market due to well-designed webpages with high-quality visual elements, the comprehensive information about the company’s products, and the ability to buy products on the official website.

Consumer Demographics, Website Statistics, and Website Evaluation
This section will discuss basic internet marketing variables related to Apple’s website. According to SimilarWeb (2020), the website’s global rank is 84, which is the traffic rank of the site as compared to all other sites in the world. This website was best ranked in the United States, and its country rank is 79 (SimilarWeb, 2020). Apple’s website belongs to the Computer Electronics and Technology category, and its rank in this category is 2 (SimilarWeb, 2020). It is surpassed only by Samsung’s website in its category.
Since the company operates worldwide, its website is visited by users from different parts of the world. The top five countries in terms of customers who visit the site are the US (33.71%), China (6.97%), Japan (6%), the United Kingdom (4.83%), and Canada (3.87%) (SimilarWeb, 2020). Audience interests include computer electronics and technology, programming and developer software, news and media, video games consoles and accessories, and social networks and online communities (SimilarWeb, 2020). Users of Apple’s website also visit such sites as iCloud, Google Play, YouTube, and Gmail (SimilarWeb, 2020). The data about the demographic characteristics of the website’s audience is not available.
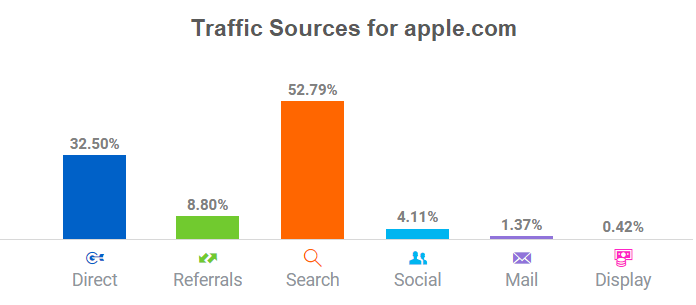
There are many sources that bring visitors to Apple’s website. The most important source of traffic is search, bringing more than half of all website visitors (see Figure 5). It is followed by direct traffic, which is related to visitors that come to the website without clicking on a link on some other site (SimilarWeb, 2020). These visitors may come to the website by directly typing its URL or getting access to it from their bookmarks. The top 5 websites referring to Apple’s website are iCloud, apple.com.cn, Spotify, Genius, and Coursera (SimilarWeb, 2020). Immediately after leaving Apple’s website, users most frequently visit such sites as iCloud, Microsoft, apple.com.cn, and PayPal (SimilarWeb, 2020). Top subdomains are unknown, but it may be concluded that other Apple’s websites, such as iCloud and apple.com.cn, contribute to Apple’s website’s traffic.
The website has average performance indicators in terms of user behavior. The average visit duration is 3 minutes 38 seconds, and consumers view the average of 3.47 website pages per visit (SimilarWeb, 2020). The bounce rate equals to 53.78%, which is considered an average bounce rate, but close to a very good one (SimilarWeb, 2020). The data about the average website load time is not available. Yet, from experience, it may be concluded that even website pages with a lot of high-quality visual elements load fast with a broadband web connection.
After analyzing the key statistics and consumer demographics, the website was evaluated in terms of usability, use of visuals, navigation, staying power, and updates. Apple’s website uses a combination of portfolio and commerce business models. It means that it provides visitors with information about the company and its products, and, at the same time, it allows them to purchase these products. The core functionality is realized exceptionally good since it provides comprehensive information in an accessible way, and the process of purchasing on the website is easy and does not require many actions.
The visuals used on webpages are effective and make the content more comprehensible. However, one issue was found on pages on which images are supposed to smoothly change each other and generate something like a film. Such pages require visitors to adjust their scrolling speed to make the images move smoothly. Apart from that, if users scroll too fast, they are likely to miss some content. At the same time, all images and autoplaying videos are of high quality and load without delays.
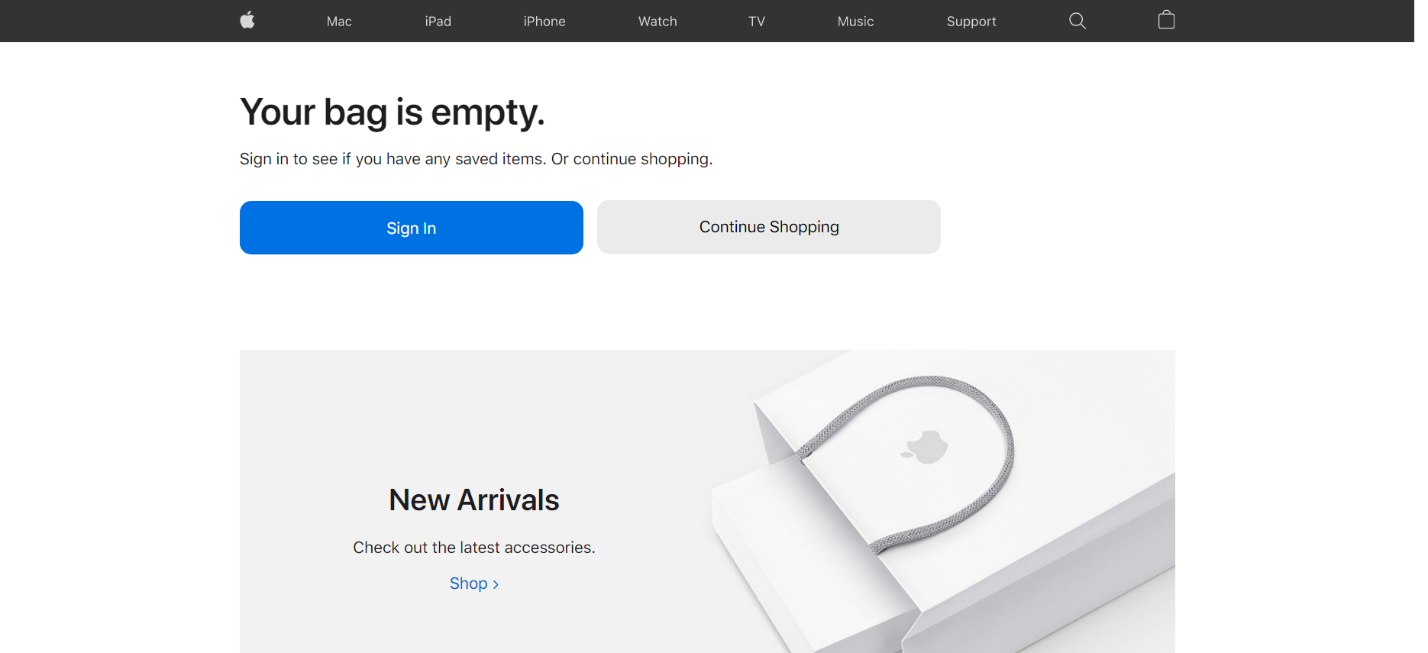
It is quite easy to navigate the site thanks to the top and bottom menus and submenus that are located on every page. The menu button in the form of the company’s logo allows for returning to the homepage. The necessary content is easily found in most cases and is placed in the appropriate categories. The only way to customize user experience is to choose products and go to the Bag page, where the user has an option to sign in to make a purchase (see Figure 6). The website does not have Back to Top buttons, which is not very convenient because the webpages on this website are often very long, and the top menu is replaced with a submenu. As a result, in order to return to the top menu or close a pop-up window with much additional information, the user has to scroll up for a long time.
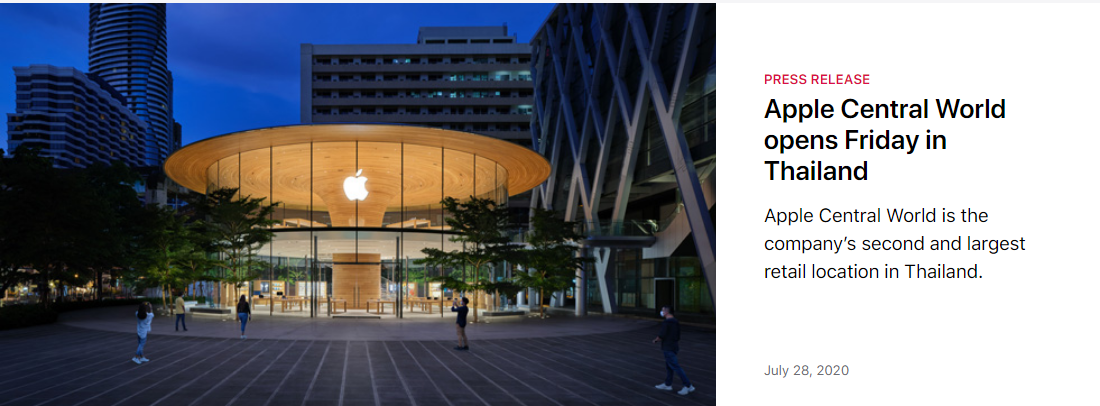
The content on the homepage of the website is new and updated since it introduced currently available offerings to the visitor. Apart from that, the company publishes its news and press releases on its Newsroom page at least once a week (see Appendix B). Thus, it may be concluded that Apple pays great attention to keeping its users up to date with its new products and any relevant new information.
Search Engine Optimization Analysis
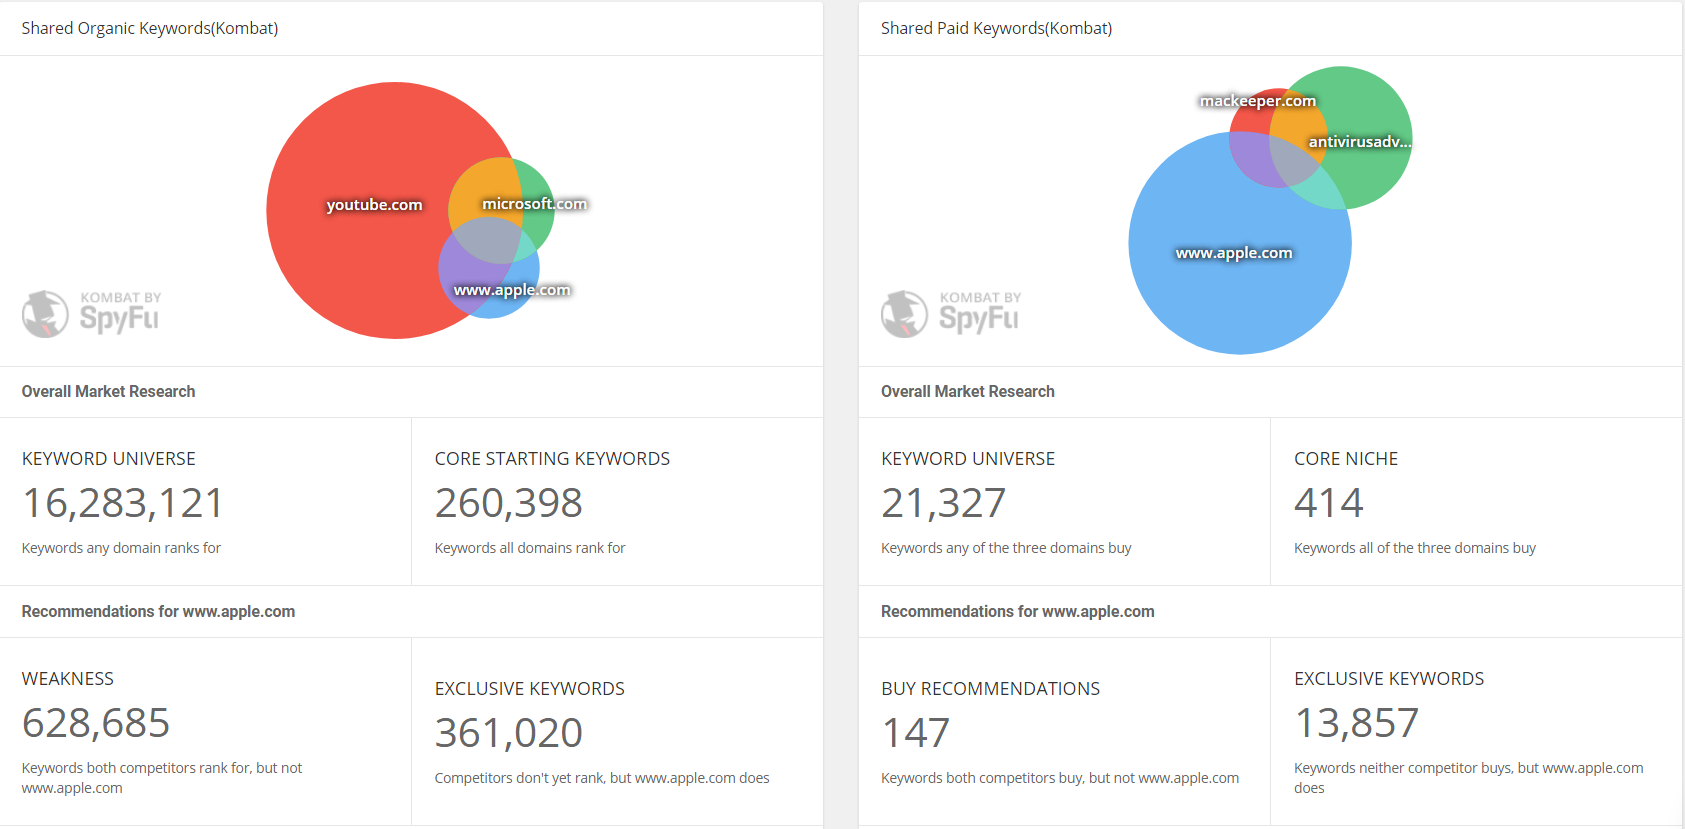
Apple’s website has good performance indicators in terms of search engine optimization. The site relies mainly on SEO rather than paid search. The number of used organic keywords is 1,762,471, and this organic search brings the site 99% of clicks, whereas the number of paid keywords is only 14,787 (SpyFu, n.d.). Among these keywords, 59,469 just made it to the first page, and 47,546 just fell off the first page (SpyFu, n.d.). The top organic keywords are google classrooms, google translator, google-maps, and translate google, and the top paid keywords are apple store, apple watch, mac, apple iphone, and iphone (SpyFu, n.d.). Figure 7 shows how the keywords used for Apple’s website compare to those of competitors. These figures imply that Apple wins the competition in terms of paid keywords since it has more exclusive keywords than its competitors. However, Apple concedes to its rivals in the organic keyword competition since it does not use a large number of keywords that are used by its competitors.
After viewing the overall statistics, the search analysis via Google search was performed (see Appendix C). It has been found that Apple’s website is the first non-sponsored link that comes up during the search for the site name. Not all results appearing on the first page belong to Apple, but none of them is related to Apple’s competitors. There are pages from Wikipedia and other sites focused on evaluating Apple’s business performance. Image and video results contain many items related to Apple, such as its logo, products, and ads. The search for concepts, products, and brands associated with the website revealed that Apple’s website appears on the first page for search terms related to its specific products, such as iPhone, iMac, and Apple Watch. All links worked well and directed the user to the appropriate page. For general categories, such as phones, computers, or earphones, the website does not appear on the first page. Apple’s website also does not appear in the search for competitors’ names. Overall, Apple has good search engine optimization, but there are specific gaps, such as insufficient competitor presence and use of competitor shared keywords.
Social Media Analysis
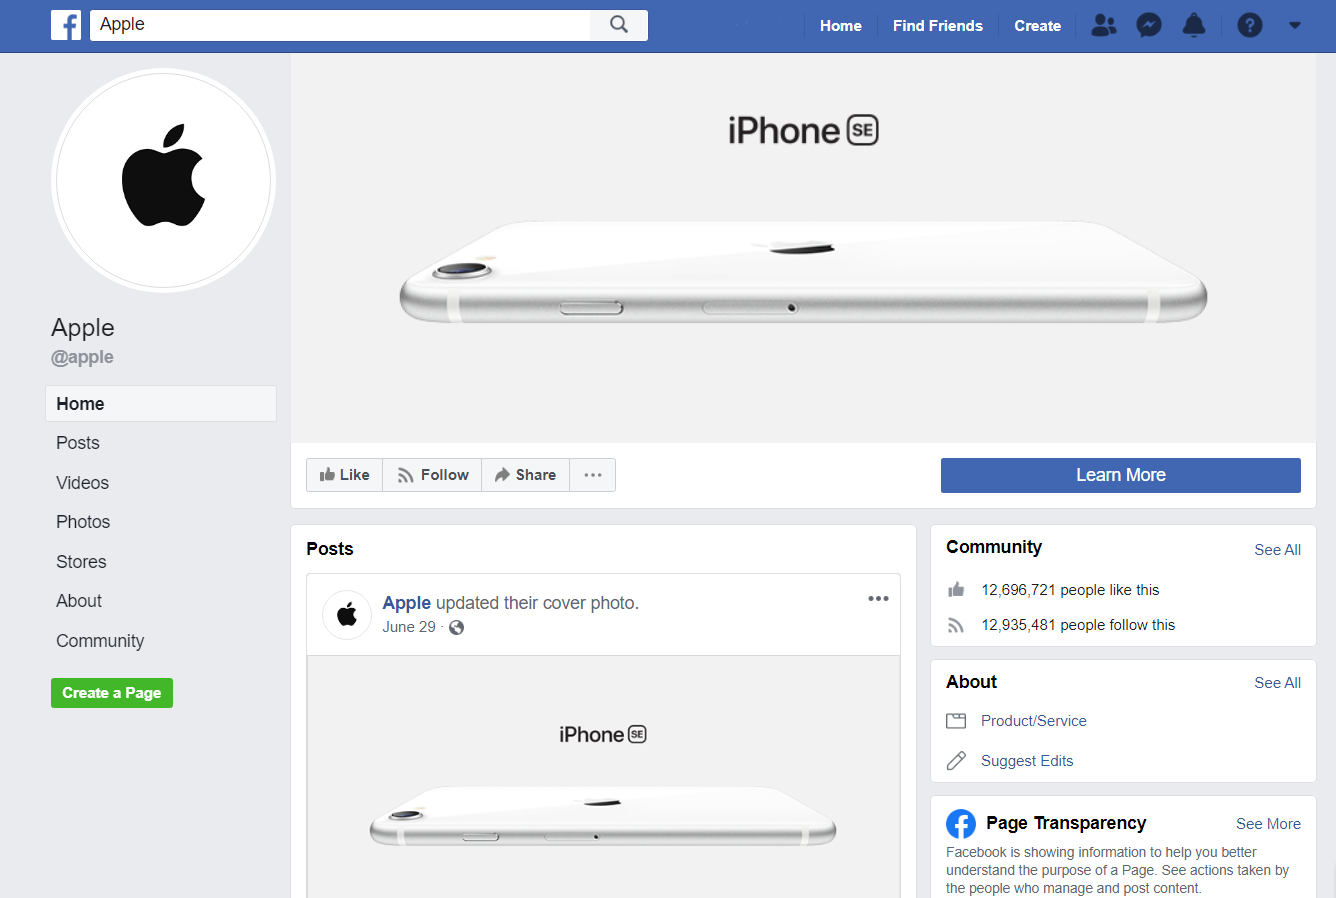
Apple has exceptional social media presence since it has verified accounts in such social networks as Facebook, Twitter, Instagram, YouTube, and LinkedIn. While analyzing Apple’s presence on Facebook, it has been noticed that the first link that appears in Google search results for “Apple Facebook” leads to a not verified page that has over 12 million likes (see Figure 8). This page has only nine posts, provides no link to the website, and does not reply to users’ comments. Although it is a not verified page, users address Apple in comments to posts and seem to believe that the page belongs to the company. Thus, the appearance of this page in the first place in search results may confuse visitors.
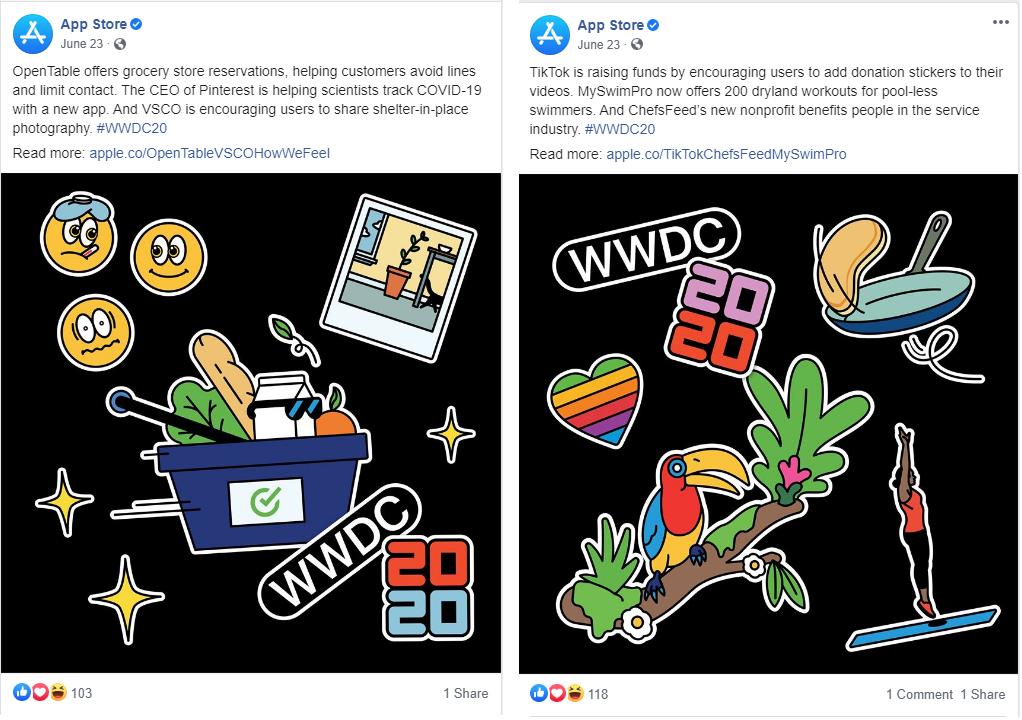
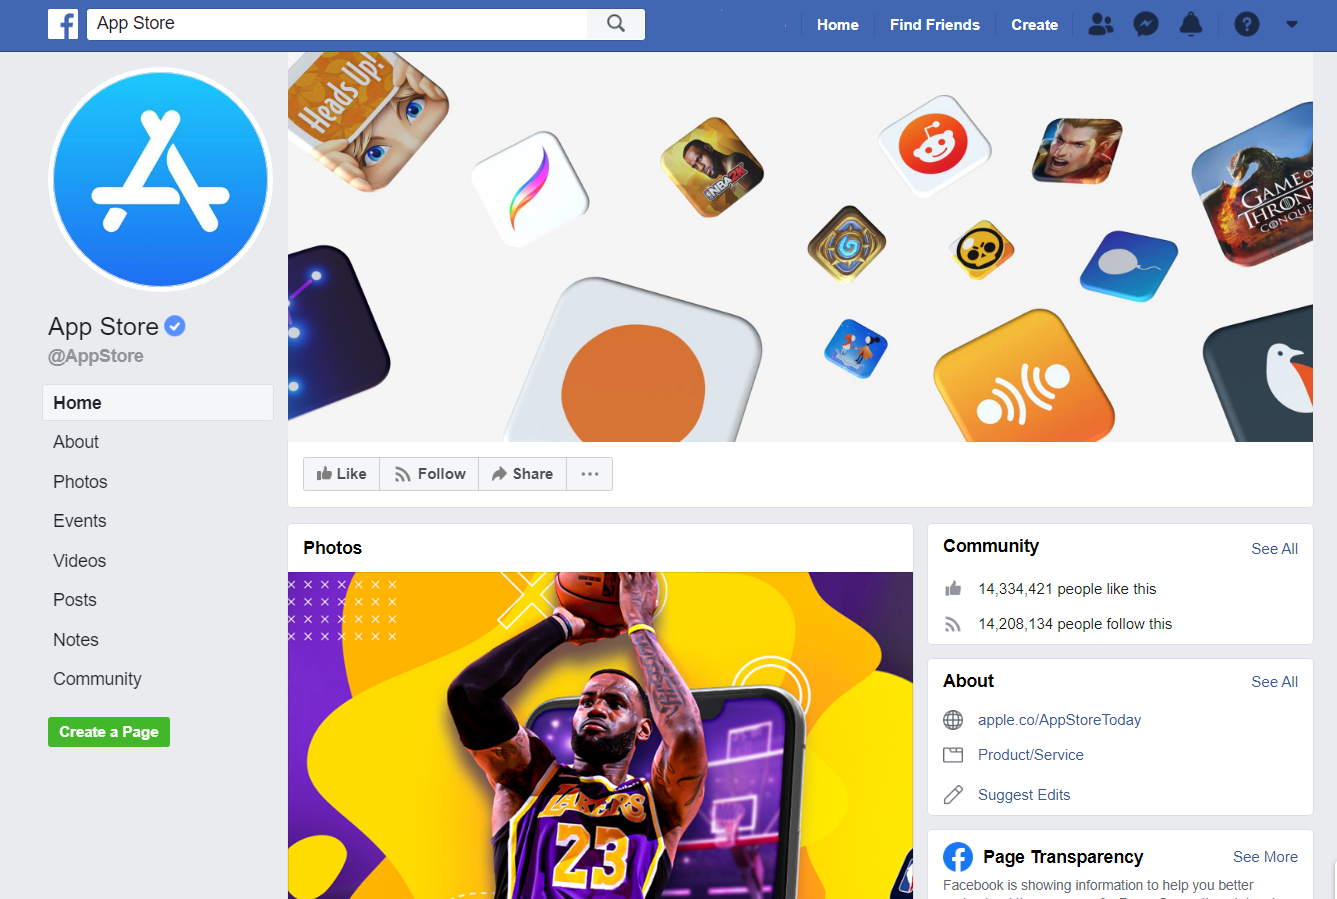
The search on Facebook revealed four verified Apple’s pages: Apple TV, App Store, Apple Music, and Apple Podcasts. Among these pages, only the App Store provides a link to Apple’s website; therefore, this page will be further analyzed (see Figure 9). This Facebook page has over 14 million likes and followers, which is an appropriate number for a company whose website is ranked in the top 100. The page provides a link to the company website not only in the About section but also in posts. It was possible to find a link to the company’s Twitter in the Events section, but it was the only link to other social media.
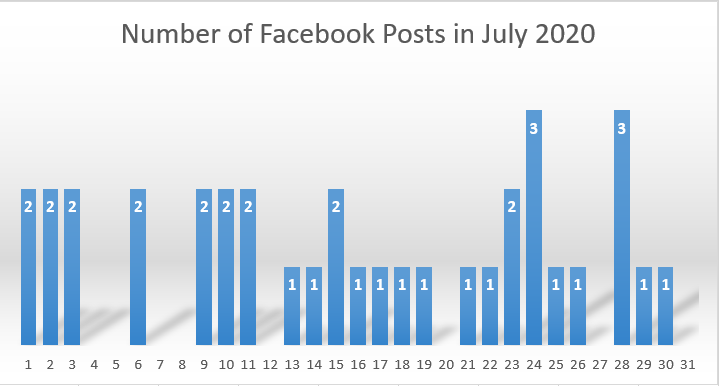
The company is quite active in managing its Facebook page. As seen in Figure 10, Apple publishes 1-2 posts per day on average. There are days on which the company publishes no posts, and the maximum number of posts per day is three. Overall, more than 40 recent posts on this Facebook page were analyzed, and all of them appeared to be rich media, containing either high-quality images or videos and some text. The posts are engaging since people like, comment, and share them. The majority of recent posts have over 100 likes, less than ten comments, and less than 20 shares. At the same time, there are no posts without any likes or shares. The most engaging post appears to be the one announcing the mobile launch of the Crash Bandicoot game, which received more than 1,700 likes, 368 comments, and 272 shares (App Store, 2020). The less engaging posts are those covering corporate world news (see Appendix D). The overall response of the comments is mostly positive. However, no company responses to users’ comments were found, even when people addressed questions to the company in comments.
In general, the posts made by the company are of high quality, but not all of them are engaging. The most engaging ones are those that match the audience interests identified in the Consumer Demographics section. The overall quality of Apple’s social networking is good due to high-quality posts, frequent publishing, and extensive social media presence. However, the company is not engaged in users’ discussions in comments and does not monitor and reply to their questions.
Final Evaluation and Recommendations
Based on the performed analysis, certain recommendations can be given to Apple to improve its website, search results, and social media presence. Apple can facilitate its website navigation by adding a Back to Top button on long web pages. Moreover, it is necessary to make sure that no important information on product overview pages can be missed by users regardless of their scroll speed. As for SEO, the company has exceptional results when users search for company-specific terms. However, it also has to rank for its competitors’ keywords to increase the number of clicks from organic search. For example, it can create webpages that compare a competitor’s product, such as Samsung’s smartphone, to some of its own products.
Finally, Apple has an exceptional social media presence, and its posts are of high quality and published frequently. In order to enhance its social networking, the company should create content that matches the audience’s interests, such as video games, computer electronics, and technology. The news of the business world is not very engaging for the audience. Moreover, Apple should take the time to monitor users’ questions and answer them to become more customer-oriented. Apple should also consider adding social media buttons to its website to provide visitors with links to its official pages on Facebook and other networks.
References
Apple. (n.d.). Home [Facebook page]. Facebook. Web.
App Store. (2020, July 9). This just in! Crash Bandicoot is back and it’s on mobile [Video attached]. Facebook. Web.
App Store. (n.d.). Home [Facebook page]. Facebook. Web.
Bag. (n.d.). Apple. Web.
iPhone 11. (n.d.). Apple. Web.
iPhone SE. (n.d.). Apple. Web.
Newsroom. (n.d.). Apple. Web.
SimilarWeb. (2020). Apple.com. Web.
SpyFu. (n.d.). Monthly domain overview – www.apple.com. Web.
Appendix A
Apple’s Homepage
Appendix B
Updates in the Newsroom on Apple’s Website


Appendix C
Search Terms Used for SEO Analysis
Table 1. Search terms used for Apple’s website’s evaluation:
Note: Data for the search volume retrieved from Wordtracker; data for website’s rank retrieved by the author through Google search.
Appendix D
Selected Posts on App Store Facebook Page