Introduction
General Dynamics is a US-based aerospace and defense company. It is headquartered in West fall, Virginia. The company is the fifth largest defense company in the world which acts as the largest supply of US navy ships. It has expanded to include other segments in the defense industry such as combat systems, information systems and marine systems. The company relies on technology to produce high tech defense products that are recognized globally. The company relies on capital budgeting technics to appraise different projects in order to establish whether they will be profitable. For instance, General Dynamics applies net present value technique to appraise different projects. There are other methods used to appraise capital budgeting projects including internal rate of return, modified internal rate of return and payback period. General Dynamics intends to invest $125,000,000 on it defense project. However, managers are not sure how they can appraise the project. In order to achieve this goal, this paper uses different capital budgeting techniques to help General Dynamic’s management make the best decision that will maximize the wealth of shareholders. Some of this techniques do not give the same accept or reject decision like the net present value model, however, they can help managers to make sound investment decisions.
Regular payback period
Regular payback period is a capital budgeting technique that measures the time taken before a project recovers its initial capital outlay. This model is used to determine the number of years it will take a project to recover the initial investment. In this case, General dynamics intends to spend $125,000,000, which is considered the initial outlay. In order to calculate the number of years it would take to recover this initial investment, this analysis start by establishing the average cash flow from the project. In this case, the average cash flow is 57,291,666.70. The average cash flow is then divided by the initial capital outlay (125, 000,000/57,291,666.7= 2.18 years). As a rule in this project, the investment is acceptable if the payback period is less than 3 years. Therefore, this project should be accepted because the payback period is less than 3 year.
This means that General Dynamics will have recovered it initial outlay of $125,000,000 in two years’ time (Altshuler & Magni, 2015). However, it worth noting that this model is rarely used because it does not give the decision to either accept or reject the project. Moreover, it ignores cash flows after the payback period when making decision. This model is preferred by decision makers because it is easy to use. When compared with other capital budgeting models such as the net present value, payback period is easy to calculate. In fact, establishing the payback period requires only the estimation of cash flow and the initial outlay. Nonfinancial managers mostly use this model because they can be able to calculate the payback period easily. However, financial managers have criticized the model because it does not consider the time value of money and cash flows after the payback period. According to time value of money principle, money receives today is more important than those received next year.
Advantage of payback period
Discounted payback model
The discounted payback model is similar to the payback model. However, it uses a different formula to determine the payback period as shown below.
Year before full recovery + cash balance payback/cash received the following year
The discounted payback period can be calculated as shown below,
4+16250/115000
4 +1.69 = 5.69 years
The payback model calculates the payback period by establishing the cumulative cash flow until the year before payback. It only considers cash flow after and before the payback period. General dynamic’s cash flow payback is in year four. Therefore, the payback period only considers cash flow in year four (89,750,000), and after the payback (115,000,000). The calculations above show that the payback period is 5 years which is higher than 3 years recommended by the company. Therefore, since the payback period is higher than the one set by General Dynamics, the project should be rejected.
There are many similarities between the payback period and the discounted payback model. For instance, the discounted payback model ignores the time value of money. The model also ignores cash flow after the payback period. The major disadvantage of this model is ignoring the time value of money (Peterson & Fabozzi, 2002, p. 34). This model assumes that firms will not reinvest income received before the end of the project. This is a major misconception because in reality many companies reinvest this capital in more profitable ventures in order to generate more income. Many firms do not use the model because it ignores the time value of money. However, it is easy to use it because it only requires the estimation of future cash flow and initial outlay. Decision makers prefer this model because it is easy to use. When compared with other capital budgeting models such as the net present value, the payback period is easy to calculate.
The advantage and disadvantage of discounted payback model
The advantages and disadvantage of discounted payback model are similar to those of the regular payback period.
Net present value model
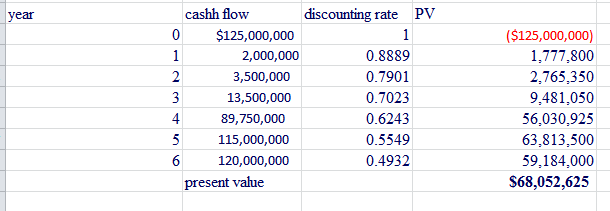
The net present value represents the differences between the present value of cash inflow and cash outflow. The net present value is the most commonly used model because it takes into account the time value of money. Moreover, this model gives a decision rule to accept or reject a project. This model also provides a concrete number that can be used by managers to compare the initial outlay against the present value of cash inflow (Weygandt, Kieso & Kimmel, 2010). The net present value is considered superior to the payback period because it gives a decision rule and takes into account the time value of money. The table below shows the present value of the project.

The initial outlay is $125,000,000 which is considered the cash flow in year zero. The cash flow is discounted using 12.5% as the discounting factor. Since this discounting factor cannot be obtained in the discounting table, it can be calculated using the following formula.
Discounting factors is given by:
1/ (1+0.125) n
N = represent the number of years
The net present value model gives a decision to accept or reject a project. As a rule, a project should be accepted if the net present value is higher than the initial outlay. This means that the present value of the cash inflow must be higher than the present value of cash outflow. If a project has a negative net present value, it should be rejected. A project with a positive net present value should be accepted because it will be profitable. Therefore, General Dynamics should reject the project because it has a negative net present value. The initial outlay (125,000,000) is higher than the present value of cash flow of 68,052,625. The decision rule is to reject the project.
The net present value formula is shown below:

The net present value model has many advantage and disadvantage as shown in the table below.
Internal rate of return
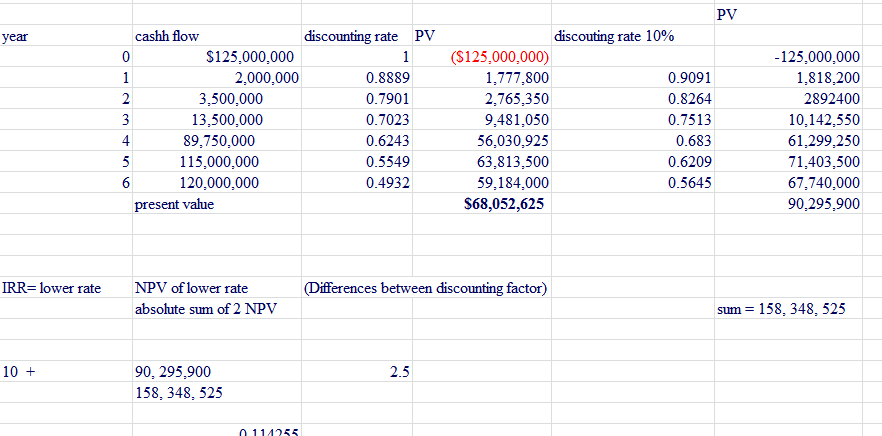
The internal rate of return model is similar to the net present value. In fact, it follows the steps of net present value. The internal rate of return represents a rate of return which gives a zero net present value. In order to calculate the internal rate of return, there must be two discounting factors. Since there is only one discounting factor, it is assumes that the other discounting rate is 10%. The calculations of the internal rate of return are shown in the table below. The result shows that the internal rate of return is 11.42% that will give a zero net present value.

The internal rate of return is used in conjunction with the net present value. The decision rule is based on whether the IRR is higher than NPV (Dhiensiri & Balsara, 2014, p. 111). When the two models are used together, the internal rate of return is chosen if it has a higher rate of return than the NPV model. In this case, the net present value model should be used because the project has a lower internal rate of return (11.4%). The decision rule is similar to that of the net present value. If a project has a negative NPV, it should be rejected. Therefore, General Dynamics should reject the project.
Profitability index
The profitability index is a model that calculates the present value of inflow and compares it with the present value of cash outflow. The present value of cash inflow is divided by the present value of cash outflow which is used to rank projects in relative terms. Therefore, the model is preferred is situations of capital rationing (Saxena, 2015). As a rule, if the profitability index is higher than one, accept the project otherwise reject the project. The project has a profitability index of 0.5; therefore, it should be rejected.
Modified internal rate of return
The modified internal rate of return eliminates the drawbacks of net present value and IRR because sometimes they yield multiple rates of return. The MIRR can be established using the following formula:
MIRR= terminal value/ (1 + MIRR) n
As a rule, if the MIRR is higher than the costs of capital or discounting rate, accept the project otherwise reject the project. Since the MIRR is 10.62%, reject the project because it is lower than the discounting rate of 12.5%.
Conclusion
General Dynamics should accept the project when using the payback period. However, the project should be rejected when using the discounted payback. If the company decides to use the NPV, IRR, PI and MIRR, the project should be rejected because it has a negative net present value. Many managers who are attracted to the payback model do it because it is easy to use and not because it gives a more accurate capital budget decisions. Overall, the project should be rejected because it has a negative net present value cash flow.
References
Altshuler, D., & Magni, C. A. (2015). Introducing Aggregate Return on Investment as a Solution to the Contradiction between Some PME Metrics and IRR. Journal Of Performance Measurement, 20(1), 48-56.
Dayanada, D. (2002). Capital budgeting: financial appraisal of investment projects. Cambridge, UK New York, NY, USA: Cambridge University Press.
Dhiensiri, N., & Balsara, N. (2014). An Introductory Application of Monte Carlo Simulatoin in Capital Budgeting Analysis. Journal Of Financial Education, 40(1/2), 94-114.
Peterson, P. & Fabozzi, F. (2002). Capital budgeting: theory and practice. New York, NY: Wiley.
Saxena, A. K. (2015). Capital budgeting principles: bridging theory and practice. Academy Of Accounting & Financial Studies Journal, 19(3), 283-293.
Weygandt, J., Kieso, D. & Kimmel, P. (2010). Managerial accounting: tools for business decision-making. Hoboken, NJ: Wiley.

