Introduction
The paper evaluates the changes in General Motor’s short-term and long-term liquidities, and its profitability between 2011 and 2012. The importance of the study is to find out the firm’s financial performance after recovering from the financial crisis. The study also seeks to find out if there is an improvement in the firm’s liquidity ratios and profitability ratios. The objective of the study is based on the company’s financial performance on an investor’s perspective. The company was bailed out by the U.S. and Canadian governments after it failed to meet its debt obligations in 2009. General Motors generated profits in the first quarter of 2010. It is the first time the company was reporting profits after the global financial crisis. General Motors had an increase in the current ratio and quick ratio between 2011 and 2012. The current ratio indicates that General Motors had the ability to clear its short-term debts. The long-term liquidity ratios show that the firm’s debt increased against total assets, total capitalization, and stockholders’ equity. The increase in debt increases risk for shareholders because the shareholder earnings are considered after debt service. The firm’s overall sales increased between 2011 and 2012. The firm’s profitability declined between 2011 and 2012. One of the causes of reduced profitability was the increase in the automotive cost of sales. There was an increase in selling, general, and administrative expenses. The firm’s profitability was still unstable in 2012 which was four years after the global financial crisis.
Importance of the study
The importance of the study is to find out the firm’s financial performance by analyzing the liquidity and profitability ratios. Liquidity ratios will indicate the firm’s ability to pay its debt when required (Porter and Norton 733). The liquidity ratios will also show whether the company had become less risky to investors after it was bailed out by the U.S. and Canadian governments in 2009. If the company had become more risk averse, it will be shown by a value larger than one in its current ratio. The paper also seeks to find the causes of the decline or increase in the financial ratios.
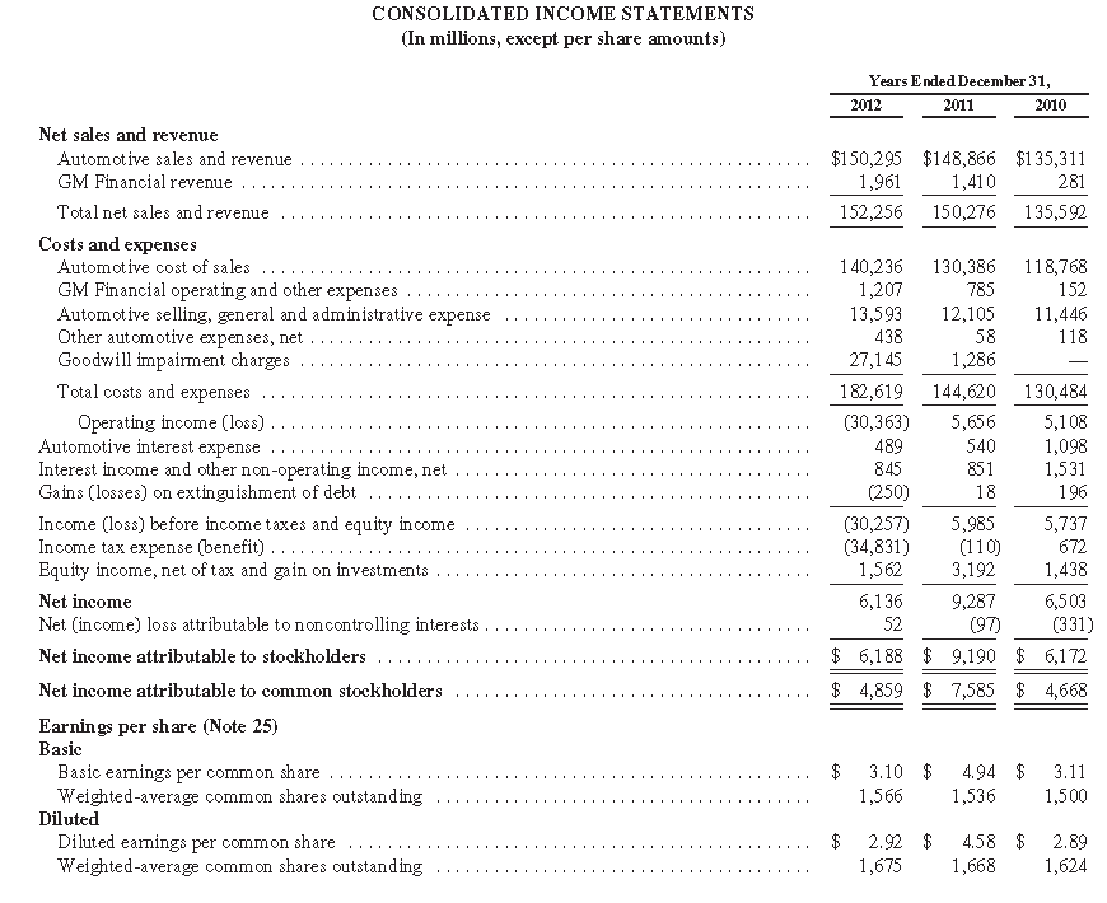
The company was bailed out by the U.S. and Canadian governments after it failed to meet its debt obligations. It was declared bankrupt in June 2009 (Clark par. 4). The two governments invested $61 billion in the company to prevent its complete shut down. The two governments became the major shareholders holding 73% of the company’s stock (Clark par. 4). In the first quarter of 2010, GM reported a profit of $865 million. It was a great improvement compared to the $6 billion loss it reported in the first quarter of 2009 (Clark par. 4). It is the first time the company was reporting profit after the global financial crisis. In 2011, the profitability of the firm was higher than in 2012. GM reported an annual profit of $6.188 billion in 2012, and $9.19 billion in 2011 (“GM Annual Report” 70). The paper evaluates the firm’s financial performance after the global financial crisis.
The firm’s overall sales increased from 9.024 million vehicles to 9.288 million vehicles between 2011 and 2012 (“GM Annual Report” 11). The study seeks to find out if the increase in sales has been converted into increased profits.
Objective of the study
The first objective of the study is to find out if the financial performance of the firm has improved between 2011 and 2012. In 2011, GM showed a great improvement in profitability. An investor would like to know whether GM had completely recovered by looking at the stability of profit margins. Investors would like to know whether there was an improvement in the profit margin. The second objective of the study is to find out if there was increased risk by investing in GM stocks. An increase in debt ratios will be an indication that the risk had increased between 2011 and 2012.
Financial Ratios between 2011 and 2012
Short-term liquidity ratios (amount in $ millions)
Current ratio = current assets/ current liabilities (Porter and Norton 733).
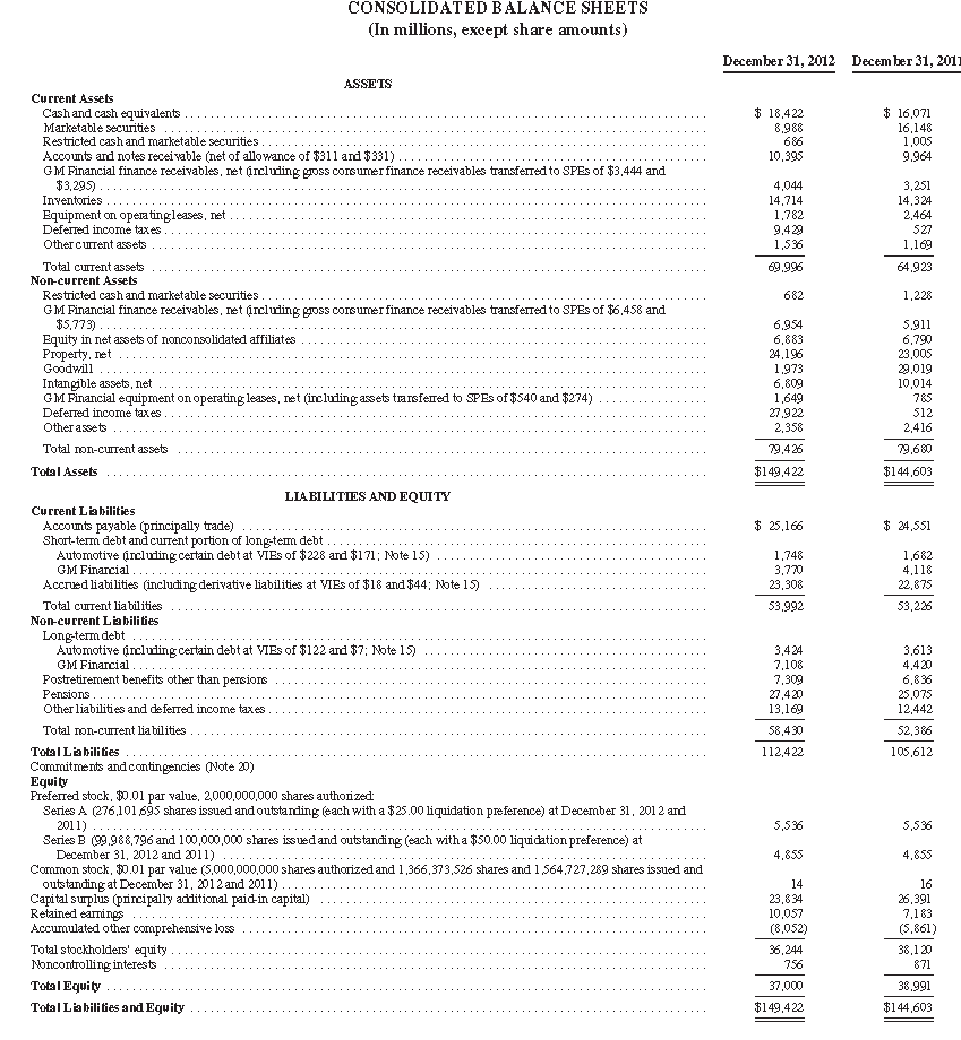
2012 = $69,996 / $53,992 = 1.30
2011 = $64,923 / $53,226 = 1.22
Quick ratio = (current assets – inventory) / current liabilities (Porter and Norton 733).
2012 = (69,996 – 14,714)/ 53,992 = 1.02
2011 = (64,923 – 14,324) / 53,226 = 0.95
Source: “GM Annual report” (72, see Appendix A).
Analysis
The current ratio and the quick ratio are used to show whether current assets are able to cover short-debts when required (Porter and Norton 733). The quick ratio increases certainty that the firm will meet its short-term debt requirements because it eliminates the value of inventories. Inventories may be obsolete or their value may change. Carmichael and Graham explain that “inventories may be removed from realization, or be subject to a loss” (456). GM deals in vehicles which may consist of inventories that may stay for long periods at the dealerships. General Motors shows an increase in the current ratio and quick ratio between 2011 and 2012. GM shows ability to pay out its entire short-term debts when both ratios are put under consideration.
The company’s current ratio and quick ratio show an increase in the value of current assets. Friedlob and Welton (175) discuss that it is necessary to look at the components of current assets and current liabilities separately in order to determine the cause of an increase or decrease in the ratios. Marketable securities decreased by a large margin. They decreased from a value of $16,148 million in 2011 to 8,988 million in 2012 (“GM Annual Report” 72). The other decreases in current assets are relatively minor changes. Components that cause an increase in current liabilities also reduce the current ratio. There are relatively minor increases such as accounts payable from $24,551 million in 2011 to $25,166 million in 2012, and accrued liabilities from $22,875 million to $23,308 million. The firm purchased 200 million of its own common shares worth $5.5 billion in 2012 (“GM Annual Report” 22). It incurred net expenses valued at $0.4 billion as a result of the transaction. Purchasing its own shares has the impact of reducing share dilution. It strengthens the market price of firm’s stocks.
Long-term solvency (amount in $ millions)
Debt ratio = total liabilities/ total assets (Friedlob and Welton 166).
2012 = 112,422/149,422 = 75.2%
2011 = 105,612/ 144,603 = 73.0%
The ratio shows debt as a percentage of assets. The company had increased debts at a higher rate than it had increased assets.
Long-term debt to total capitalization = long-term debt/ (long-term debt + stockholders’ equity (Whittington and Delaney 322). It shows the extent to which a firm has used long-term debts to keep its operations running.
2012 = (3,424 + 7,108)/ (3,424 + 7,108 + 37,000) = 22.2%
2011 = (3,613 + 4,420) / (3,613 + 4,420 + 38,991) = 17.1%
Source: “GM Annual Report” (72).
The firm has increased its long-term debt ratio as a percentage of total capitalization. The impact of increased long-term debt is higher interest rates because of increased risk of default.
Debt to equity ratio = total liabilities/ stockholders’ equity (Whittington and Delaney 322)
2012 = 112,422/ 37,000 = 3.03
2011 = 105,612/ 38,991 = 2.71
Analysis
The three ratios show that the firm’s debt has increased against total assets, total capitalization, and stockholders’ equity. Friedlob and Welton (171) explain that the more a company accumulates debt, the higher the interest rates it will be required to pay. Lenders consider the high risk of lending to a borrower who has more debts than assets. The increase in debt increases risk for shareholders because the shareholder earnings are considered after debt service (Friedlob and Welton 169). However, a company has to use leverage to increase the firm’s capability to generate more profits.
The causes for the increase in the debt ratios are not clearly visible on the balance sheet. The decrease in goodwill from $29,019 to $1,973 has been offset by the increase in deferred income taxes from $512 to $27,922 in the non-current assets section (“GM Annual Report” 72). The company incurred $26.4 billion as goodwill impairment charges in 2012 compared with $1.3 billion in 2011 (“GM Annual Report” 26). The long-term debts increased by $2.7 billion as a result of the firm issuing securitization notes payable, senior notes, and reclassification of a long-term debt to be a current debt (“GM Annual Report” 35). Sometimes an increase in debt is an indication of expansion. GM reported an increase in capital expenditure from $6.2 billion in 2011 to $8.1 billion in 2012 (“GM Annual Report” 5). GM acquired Ally Financial to increase its ability to provide credit to its customers. It also purchased an alliance with PSA worth $0.4 billion (“GM Annual Report” 25). The expansion activities increase profitability capacity. It also demands high financial performance for profits to reach shareholders.
Profitability ratios
Gross profit margin = gross profit/ net sales (Porter and Norton 748).
2012 = 15,086/ 152,256 = 9.91%
2011 = 19,586/ 150,276 = 13.03%
Source: “Bloomberg Businessweek: General Motors Co (GM: New York)” (table, see Appendix B).
Net profit margin = net earnings/ net sales (Porter and Norton 748).
2012 = 6,188/ 152,256 = 4.06%
2011 = 9,190/ 150,276 = 6.12%
Analysis
The profitability of the firm has declined from 6.12% to 4.06% in net earnings. The low gross profit margin is an indication that the firm’s cost of goods sold has increased between 2011 and 2012. The low profitability could also be a sign of the high cost of expenses. Subtracting the net profit margin from the gross profit margin for the two years, it indicates that expenses have decreased by a small margin. The difference is 5.85% (= 9.91% – 4.06%) in 2012, and 6.91% in 2011 (= 13.03% – 6.12%). It shows that the firm’s profitability has declined despite increasing efficiency in its operations. The decline in profitability is not caused by a decline in sales because revenues increased from $150,276 million to $152,256 million (“GM Annual Report” 70).
One of the causes of reduced profitability is the increase in the automotive cost of sales from $130,386 million to $140,236 million (“GM Annual Report” 70). There is an increase in selling, general, and administrative expenses from $12,105 million to $13,593 million. An increase is also visible in total costs and expenses which have gone up from $144,620 million to $182,619 million. Cost and expenses have increased by $37,999 million when revenues have increased only by $1,980 million between the two years. It is clear that the increased cost of sales and other expenses is the main cause of the decline in profitability.
Conclusion
The increase in revenues did not result in an increase in profits. Profitability of the firm decreased because of the increase in cost of sales, and other expenses. GM had recovered from the global financial crisis, but its profitability was still unstable. The firm needs to find raw materials at a lower cost, and increase processing efficiency. The firm’s debt had increased between 2011 and 2012. It was an indication of increased risk for investors. GM’s debt ratio had increased because the company was engaging in expansion activities. There is more capability to generate profits by using debts for expansion. However, it increases risk to stockholders because the firm has to have higher profit margins to clear interest on debts. The value that exceeds debt service can be shared by the stockholders. The current ratio is higher in 2012 than in 2011. It may be an indication that the firm wanted to increase its creditworthiness for short-term debts. The company’s financial performance was better in 2011 than in 2012.
Works Cited
Bloomberg Businessweek: General Motors Co (GM: New York) 2014. Web.
Carmichael, Douglas, and Lynford Graham. Accountants Handbook, Financial Accounting and General Topics, Hoboken: John Wiley & Sons, 2012. Print.
Clark, Andrew. GM Bounces Back into Profit after Coming Close to Oblivion. 2010. Web.
Friedlob, George, and Ralph Welton. Keys to Reading an Annual Report, Hauppage: Barron’s Educational Series, 2008. Print.
GM Annual Report 2012, PDF file. Web.
Porter, Gary, and Curtis Norton. Financial Accounting: The Impact on Decision Makers. 7th ed. 2011. Mason: South-Western Cengage Learning. Print.
Wittington, Ray, and Patrick Delaney. Wiley CPA Exam Review 2009: Financial Accounting and Reporting, Hoboken: John Wiley & Sons, 2009. Print.
Appendices
Appendix A
Appendix B