Executive Summary
This essay analyzed the financial position of a given company based on two financial years, 2013 and 2014. The aim of such analysis was to examine the selected company’s strengths and weaknesses, as well as establish whether or not it could be considered for Financial Services Management. The evaluation cited several weaknesses and strengths. For example, the company has a high capacity to generating high profit margins. Secondly, the company’s future is promising as the company has the ability to use the available assets effectively for the generation of high revenue. Nevertheless, it has several weaknesses including a high debt burden. Based on results of the evaluation, there is a need for the company to put a lot of emphasis on reducing its debt burden.
Introduction
The strengths and weaknesses of any organization play a vital role in the decision making process of the concerned organization. This is attributable to the fact that an organization’s strengths dictate its ability to counter any challenges that might occur as a result of its weaknesses (Latham and Braun 259). The implication from this assertion is that organizations ought to be aware of their strengths and weaknesses, as well as work towards making the best out of their strong areas. In addition, the position of any organization as far as its potential to generate high profit is concerned influences the decisions of any interested party to work with them (Saleem and Rehman 98). For this reason, it is important for managers in any organization to ensure that the available strengths outweigh the weaknesses. Often, financial analysis plays a significant role of an indicator of the position of any organization in terms of its weaknesses and strengths.
This report provides a critical evaluation of the finances of a given organization by pointing out its weaknesses and well as the strengths. In addition, the paper provides justified recommendation based on the company’s weaknesses and strengths regarding its suitability to be considered for a sourcing exercise for Facilities Management Services. As such, the recommendations will focus on any limits which ought to be placed on the financial exposure.
Evaluation
The strengths and the weaknesses of any organization can be identified from its performance over a given period in business. Such a move involves the examination of several financial ratios (Schmidt 22). In this case, the evaluation of the finances of the given organization will include financial ratios such as liquidity ratio analysis, the solvency ratio, the profitability ratio analysis, as well as ratio and financial leverage.
Liquidity Ratio Analysis
Liquidity ratios are used in the examination of the liquidity position of any given organization in the short-run (Martani and Khairurizka 44). As such, the analysis of the liquidity ratios in this case will help to provide clear information on position of the organization as far as its short-term capacity of paying debt obligations is concerned. The current and quick ratios are used in the assessment of a company’s ability to pay its short-term liabilities using its short-term assets (Saleem and Rehman 95). As such, it is expressed as a fraction of the current assets over the current liabilities.
Current ratio = Current Assets/Current Liabilities
In 2014;
Current Ratio = 48,954/43,603 =1.028
In 2013;
Current Ratio = 37,386/36,182 = 1.033
The current ratio during the FY 2013 was 1.033, and hence, it was comparatively high than in the case of the FY 2014, which was 1.028. This is attributable to the fact that the company’s current liabilities increased from 2013 to 2014, while the current assets decreased significantly. The implication is that the ability of the company to pay its current liabilities decreased from 2013 towards 2014. Both the current assets and the current liabilities increased between 2013 and 2014 by 30% and 24% respectively.
The quick ratio, on the other hand, is used as a refinement to the current ratio as it measures the amount of the most liquid current assets that an organization has to use in the case of covering current liabilities.
Quick ratio = (cash & equivalent + short term investments + account receivables)/current liabilities
In 2014
Quick Ratio = 12,979/47,603 = 0.27
In 2013
Quick Ratio = 6,929/36,182 = 0.19
A review of the quick ratio for the two years reveals that it increased from 0.19 in 2013 to 0.27 in 2014. The implication is that the company has a significantly high ability to cater for its current liabilities based on its quick assets. A quick ratio of just over 1 is indicative of a company’s ability to cater for its current liabilities using the current assets without having to sell any of the non-current assets. Based on the organization’s quick ratio of less than 1, it is more likely that it will face numerous challenges paying its current liabilities fully.
Solvency Ratio Analysis
This section provides a comprehensive analysis of the solvency of the given company. Therefore, solvency ratios such as the equity ratio, debt equity ratio, and the total debt ratio are applicable in this case. The analysis focuses at the examination of the company’s ability to carry sustainable operation indefinitely. Solvency ratios are used to determine the capacity of an organization to take care of its long-term debts.
The table below shows that the total debt ratio of the organization increases from 0.90 in 2013 to 0.92 in 2014. Such an increase of 2% is indicative of an increase in the company’s total liabilities relative to its total assets. The implication is that the company is having a deteriorating leverage position. A total debt ratio near 1 is risky as far as the stability of the company is concerned. According to the debt ratio, it can be inferred that the creditors own 90% of the company’s assets. In addition, the review shows that there has been an increase in the liabilities.
The graph below provides a summary of the company’s leverage position with respect to its total debt ratio, debit equity ratio, and equity ratio.
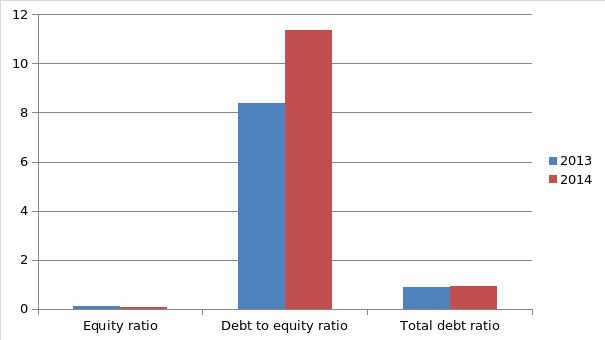
According to the summary above, it is evident that the company’s equity ratio has decreased while dependence on debt has increased. The implication is that the company’s investment has significantly decreased from 10.7% to 8.1% between 2013 and 2014. According to such a decrease, it is arguable that the ratio does not favor the company as it indicates the unsustainability of the company. This is attributable to the fact that the company is not in a position to cater for any more debts in the future.
The debt equity ratio for this company has significantly increased from 8.40 in 2013 to 11.34 in 2014. Such an increase depicts a scenario of increased level of dependence on creditors. In addition, the implication from such a change is that the majority of the finances of the organization are obtained from bank loans as opposed to investors’ financing. A review of the debt to equity ratio reveals that it is quite larger than the expected 1% for companies that have high risk undertakings whereby the investors in such an organization have equal stakes as the creditors. In an event whereby the investors have low investment in an organization, the implication is that the company has low returns on invested capital and hence, has a deteriorating financial health. Therefore, it is evident that this company depends majorly on debt and hence, it is highly risky to make any form of investment in it.
Efficiency Analysis of the Company
This section focuses on the examination of the efficiency of the company as far as its operations are concerned. As such, the efficiency of the company can be measured based on its ability to use the available assets for the purpose of generating income (Chordia and Subrahmanyam 258). In this analysis, a lot of emphasis is given on ratios that can be used to indicate the attractiveness of the organization. Often, investors use efficiency ratios to assess the performance of a given company. On the other hand, the management of any organization relies on these ratios to attract as well as convince investors of the worthiness of the company in terms of generating income from invested capital. The major ratios used in this case include the asset turnover ratio and the inventory turnover.
The inventory turnover can be obtained by working out the ratio between the cost of goods sold and the average inventory. On the other hand, the asset turnover ratio is expressed as a fraction between the net sales and the average total assets.
A comparative analysis of the asset turnover ratio between 2013 and 2014 indicates a marginal increase. Such increase shows that the company has the capacity of generating sales based on its assets. In addition, having a high turnover ratio shows that the company makes effective use of its assets for the purpose of ensuring that its operations as effective.
On the other hand, the analysis shows that the company has a high inventory turnover, which is indicative of success in the managing on the organization’s merchandize. The implication from such a scenario is that all the company’s assets are used purposely to generate income and that no inventory stays for long. As such, it can be argued that the organization is considerably efficient as far as its asset management is concerned. This indicates that the company’s inventory is highly liquid based on its ability to use its assets to make more profits.
Profitability Ratio Analysis
This section analyses the ability of the company to make profit based on its assets and liabilities. The profitability ratios are very important in the assessment of a company’s ability to use available assets to make profit (Hill and Andes 60). As such, these ratios are important in any business as they are used to convince creditors and investors with respect to the potential of any given company to effectively make use of invested capital to generate income.
The profitability ratios examined include the Return on Equity (ROE), Return on Assets (ROA), Net Profit Margin (NPM), and Gross Profit Margin (GPM).The analysis of the company’s profitability shows that its profit margin increased from $25,622 in 2013 to $36,761 in 2014, while the net profit margin increased from $ 1,352 in 2013 to $2,672 in 2014. The implication from such revelation is that the net income that the company had significant increases in the amount of sales made between 2013 and 2014. As such, it can be considered that the organization has been very effective as far as the generation of profit from invested capital is concerned. Such a scenario indicates that the company’s expenses are managed efficiently in relation to the increase in net sales.
The ROE is used for the purpose of establishing the capacity of any given organization of generating profits based on invested capital (Chordia and Subrahmanyam 258). It is expressed as a fraction of organization’s net income over the shareholder’s equity.
On the other hand, the ROA is used in the measurement of the amount of income generated from a company’s assets. The ROA is expressed as a fraction of the net income and average total sales.
The company’s ROE and ROA increase from negative to positive. Such significant change is indicative of the organization’s capacity to effectively manage the invested capital and assets to generate revenue. In most cases, investors use ROE and ROA whenever making their investment decisions regarding any given company. For this reason, positive ROE and ROA attract the majority of investors. In the case of the current organization, the positive trend of the ROA and ROE is indicative of improved organization’s performance.
Other Ratios-Cash Ratios and Financial Leverage
Other than the solvency and profitability ratios, the ratios can also be used to examine an organization’s financial position and performance (Hill and Andes 60). Such ratios include the financial leverage and the cash ratios, which are highlighted below.
The cash ratio significantly increased from 0.1620 in 2013 to 0.2815 in 2014, while the financial ratio changed from 9.578 in 2013 to 12.335 in 2014. An increase in the cash ratio between the two years shows that the organization has been very effective in paying its short-term liability. Such a scenario implies that the company is in a position of maintaining enough cash balances for the purpose of ensuring that its current debts are completely paid. In spite of this, the cash ratio of the company is less than 1 implying that there is need in extra cash that the company has at the moment if it has to completely pay its current debt. Arguably, considering the fact that the cash ratio is very important in the decision-making process of creditors, the organization is required to ensure that its operational performance improves for a chance to generate more revenue in the future. With evidence of the capacity to generate more cash, it is more likely that creditors will be convinced to work with the company based on its potential to pay the current debts easily.
DuPoint Analysis
A review of the company’s financial leverage reveals an increase from 9.6 in 2013 to 12.3 in 2014. Financial leverage is used in the determination of the percentage of equity used in financing an organization’s assets. This ratio is effective in calculating the DuPoint analysis, which is used in indicating the overall capacity of an organization to generate return based on invested capital. According to the DuPoint analysis, it is evident that the company’s capacity to generate high returns has increased between the two years. Thus, there is a high probability that the return on equity of this organization will continue being high, leading to a high asset turnover ratio.
Summary of the Weaknesses and Strengths
According to the evaluation above, there are a number of weakness and strengths for this company. First, the company has the necessary capacity of generating high profit margins based on the performance of previous years. In addition, a review of the company’s return of assets as well as the inventory turnover shows that the company’s future is promising. This can be attributed to its ability to use the available assets effectively for the generation of better revenue.
In spite of the company’s strengths in the generation of high profit margins, it has a number of weak points as well. For example, the company has a lot of debts presently, which act as a hindrance to its ability to attract creditors and investors. Such a high debt burden is a threat to the performance of the company as far as its ability to pay off short-term and long-term debts is concerned. Despite the improvement in liquidity ratios, its debt ratio is significantly high (91.8%). The implication is that creditors own a high percentage of the company’s assets and that over the previous years there has been an increase in its liabilities as compared to the assets. For this reason, the company’s position in terms of debt threatens its solvency in the future.
Justified Recommendations for Facilities Management Services
The current financial position of this company shows that it can be considered for facilities’ management services. Nevertheless, any potential partner ought to be prepared to accommodate the current debt burden since the company has very promising financial indicators.
Conclusion
The evaluation carried out indicates that there is a lot of potential in the company’s ability to generate high profit despite its high debt burden. This can be attributed to improved financial performance between 2013 and 2014, which was indicated by the increase in the cash ratio, efficiency ratios, as well as the profitability ratios. In spite of this, a lot of concern is raised by the company’s current debt position, which is high, implying that it is highly depended on debt financing as opposed to equity financing. Based on such analysis, there is a need for the company to put a lot of emphasis on reducing its debt burden.
Pre-qualification Standards
The company ought to have gone through the necessary registration procedures and met all required quality standards. For it party wishing to engage in any form of trade with this company, it is important to get the necessary feedback about capability, valuation fairness, standardization service, future contracts, satisfaction driven, responsiveness among other factors.
Works Cited
Chordia, Tarun, and Avanidhar Subrahmanyam. “Liquidity and market efficiency.” Journal of Financial Economics, vol. 87, no. 2, 2008, pp. 249-268.
Hill, Nancy, and Steven Andes. “Evaluating firms in financial distress: An event history analysis.” Journal of Applied Business Research, vol. 12, no. 3, 2011, pp. 60-71.
Latham, Scott, and Michael Braun. “Managerial risk, innovation, and organizational decline.” Journal of Management, vol. 35, no. 2, 2009, pp. 258-281.
Martani, Dwi, and Rahfiani Khairurizka. “The effect of financial ratios, firm size, and cash flow from operating activities in the interim report to the stock return.” Chinese Business Review, vol. 8, no. 6, 2009, p. 44.
Saleem, Qasim, and Ramiz Rehman. “Impacts of liquidity ratios on profitability.” Interdisciplinary Journal of Research in Business, vol. 1, no. 7, 2011, pp. 95-98.
Schmidt, Shelton. The measurement of productive efficiency and productivity growth. Oxford University Press, 2008.