Introduction
Present report compares the performance of two companies using standard financial ratios. The two companies under consideration are 1) EOG Resources Inc. and Advantage Oil and 2) Gas Company Ltd (AAV). The analysis data were obtained from the respective companies’ income statements, cash flow, and balance sheets. Following major financial ratios were used as an indicative source of companies’ performance namely:
- liquidity ratios,
- Efficiency ratios,
- Leverage ratios,
- Coverage ratios,
- Profitability ratios,
- Z-score and
- WACC
The analysis is presented is following sections and conclusion is provided using the results from the above indices.
Analysis
Liquidity Ratio
Liquidity ratio shows whether a firm has sufficient cash or asset to pay its debts. It shows cash flow of firm. This ratio is used here to compare the performance of two firms. In this respect, the balance sheet of both companies was used to collect the required data. Liquidity ratio compares current assets with current liability. A positive current ratio of greater than one shows that the company is in good health i.e. the company has enough assets to pay the debts and liabilities. On the other hand, low current ratio signal to liquidity problems in the company.
Current Ratio = ![]()
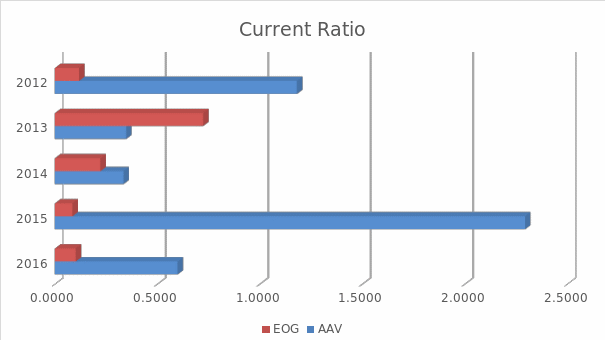
Figure 1 shows that EOG Resources have a constant decline in the current ratio except for the year 2013, where the company’s current ratio was 0.7228. On the other hand, AAV data shows fluctuation in current ratio with an overall increase. Therefore, it can be concluded that AAV is in a better position. However, it should be noted that for current year i.e. 2016 the current ratios of both these companies fall below 1, indicating both companies might face liquidity problems. In addition, the data also shows that AAV is better positioned than EOG which has a very low current ratio of 0.1019.
Table 1: Yearly comparison of the Current Ratio of the two firms.
Efficiency Ratios
Efficiency ratio shows the company’s ability to manage its assets and liabilities. It also shows whether the company’s performance is good or bad. In this respect following ratios are calculated namely asset turnover ratio, receivables day ratio, and payable day ratio.
![]()
Receivable day shows the length of time a customer takes to payback its due to the business.
![]()
Payable day shows the length of time a business takes to payback its dues.
![]()
Table 2: Asset Ratio of AAV and EOG Resources, Inc from the year 2012-2016.
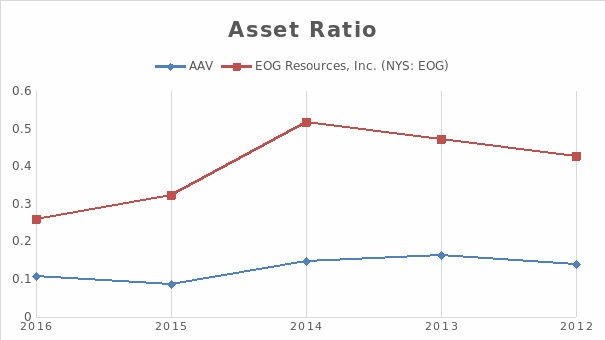
Table 3 shows that the both companies have similar receivable days in the year 2016 i.e. 59 days and 58 days. Table 4 shows that both the firms take far too long to pay back the money to their respective investors. Upon comparing the payback days of both companies the data shows that AAV takes much more time to pay back in comparison to EOG. For example, statistics of 2016 shows that the payback period of AAV and EOG are 543 and 405 days respectively. Therefore, it can be concluded that AAV needs to focus on paying back its debts and liabilities on time to gain the trust of its investors.
Table 3: Number of days each of these firms take to receive the payment from its customers.
Table 4: Amount of days taken by both firms to pay back to its loyal supporters.
Leverage Ratios
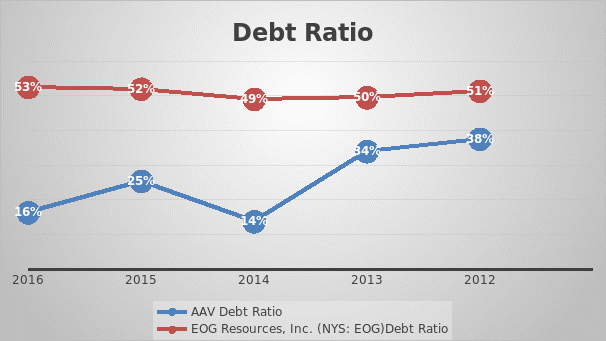
Leverage ratio helps in assessment of the risks associated with a firm in long-term. It is useful for investors and company managers. In this respect, the debt ratio is the most important type of leverage ratio. Debt ratio shows the portion of company’s asset that is in debt or financed externally and the company is due to pay. Table 5 clearly shows that in the year 2016 only 16% of AAV’s assets were in debt, while the Table 6 shows that more than half of the EOG’s asset is in debt. In addition, Figure 3 shows distribution and trend of debt ratio for both the companies over last 5 years.
![]()
The trend line shows that the debt ratio of AAV has decreased over the last 5 years to 16% in the year 2016 from 38% in the year 2012. On the other hand, the debt ratio of EOG has remained almost constant with the debt ratio keeping up the half mark. This shows that EOG is highly debt company in comparison to AAV.
Table 5: Debt ratio of AAV from the year 2012-2016
Table 6: Debt ratio of EOG from the year 2012-2016
Coverage Ratios
Coverage ratio measures a firm’s cash generating abilities. There are three important ratios under the coverage ratio namely the debt to total ratio, times interest earned, and cash debt coverage ratio. This study looks at company’s power to pay all its liabilities from cash operation. It is the ratio between the cash from operating activities and total current liabilities.
![]()
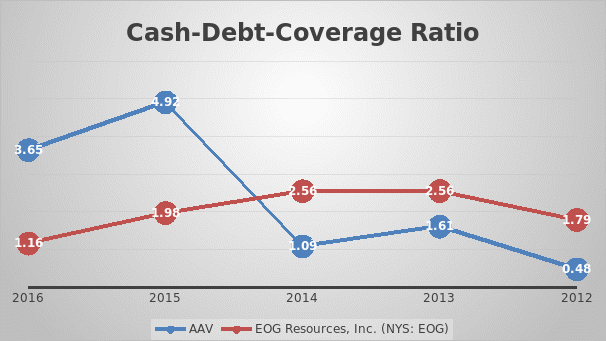
Figure 4 shows the trend of Coverage ratio for AAV and EOG. The coverage ratio has constantly increased for AAA, while the coverage ratio has decreased for EOG. On the positive side, the results show that both the companies have positive cash flow to pay back their current liabilities. However, AAV has 3.65 times cash flow in comparison to its liabilities, while EOG has 1.16 times the cash flow to its liabilities.
Profitability Ratio
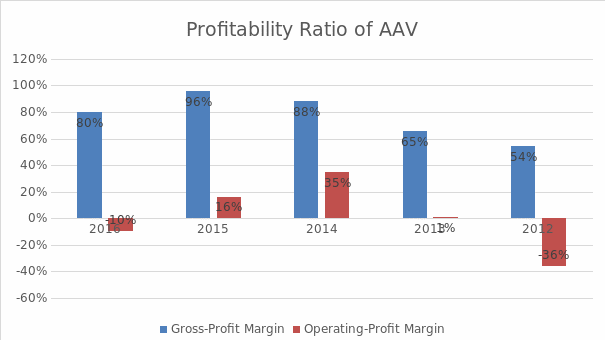
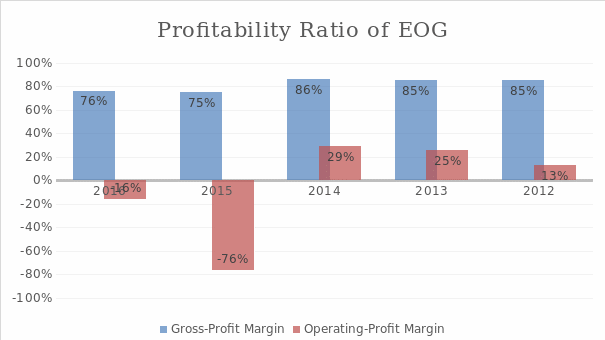
Profitability ratio looks at business returns. In this respect, this report looks at two important type of profitability ratios namely Gross-Profit Margin and Operating Profit Margin. Figure 5 and Figure 6 shows the trend in profitability ratios of AAV and EOG respectively over the years from 2012-2016. Results show that for the year 2016 AAV and EOG registered gross profit margin of 80% and 76% respectively. However, when business overheads are considered and the operating profit is calculated, the picture looks completely different. Results show that both AAV and EOG have a negative operating profit margin of 10% and 16% respectively. This shows that both companies are having larger overhead, which reduces its net profit.
Z-Score
Z-score is calculated by considering multiple financial ratios together. A Z-score above 2.99 is considered safe for companies i.e. company will not be bankrupt in next two years. On the other handm, a Z-score between 1.8 and 2.99 is shows that the company will go bankrupt in coming two years. Further, a Z-score of 1.8 and less is considered highly volatile stage for the company. In this respect, this report shows the Z-score of AAV and EOG respectively to judge their probability of going bankrupt.
![]()
Table 7 shows that Z-score of both companies is below 2.99. The Z-Score of EOG Resources, Inc is below 1.8 stating that the company is in a stressed situation and presently facing bankruptcy. On the other hand, AAV is safer with higher value of Z-Score being 2.59. The investors and management of AAV need to take immediate measures to save the company from bankruptcy in coming two years. It should be noted that EOG needs immediate attention to overcome its stressed financial situation.
Table 7: Z-Score of AAV and EOG Resources for the year 2016.
Weighted Average Cost of Capital
Weighted Average Cost of Capital (WACC) shows companies relationship with investors and bank with respect to its total share of investment. Equation 8 can be used for calculating WACC of the company. Upon application of this equation WACC were calculated for both the companies. Table 8 shows that the WACC of EOG and AAV is 11% and 13% respectively.
![]()
Here:
- E = Market value of the firm’s equity
- D = Market value of firm’s debt.
- V= Total market value of the firm’s financing
- Re = Cost of Equity
- Rd = Cost of Debt
- Tc = Corporate Tax
Table 8: WACC of EOG Resources, INC. and AAV based on assumed values of cost of equity, cost of debt and corporate tax rate.
Conclusion
Results show that AAV is a safer company to invest, when compared with EOG. For example, the liquidity ratio of AAV in the year is 0.5 while the liquidity ratio of EOG was only 0.1. This indicates that EOG is more likely to face cash problem. Further, the debt ratio shows that AAV has far less asset under debt in comparison to the EOG. The debt ratio of EOG was 53% in the year 2016, while the debt ratio of AAV was lower. Nevertheless, both companies are facing difficulty in paying back investment and debts, as their payback period was found to be lengthy. Results also show that both the companies are having larger overhead, which reduces its net profit. In the end, the Z-score also shows that EOG is facing a serious stressful situation, while AAV is still stale. However, the Z-score of AAV is indicating that management and investor must focus on improving its performance in coming two years.
Recommendations
Based on the results this report recommends investing in AAV and focus on improving its performance in coming two years. On the other hand, EOG needs serious investment to overcome its bankruptcy situation. Further, this report was successfully able to use the financial ratios help in gauging the health of companies.
Limitations
Present study focused on the performance of two companies based on the data provided. Major finical ratios were calculated using Excel. In future work, this report recommends the use of cleaner data sheet, as most of the data in the balance sheet and income sheet required careful observation and shorting.

