Introduction
Home Depot is the larger of the two firms with $315 billion as a market capitalization. The company had net sales of $151 billion in the financial year 2022 and more than 3371 outlets in all the 50 states comprising Canada, the United States, and Mexico. In the financial year ended 2022, Lowe had net sales of $89 billion and a market capitalization of $135.95 billion. It has over 2000 stores in Canada and the US. According to the housing market perspectives, comparing both firms from 2018 shows increasing trends from 2018 to 2019 and in 2020 because of the COVID-19 pandemic the firms showed downwards trends (WSJ, 2022). In 2022, the companies have continued to show decreasing trends.
Stock comparison
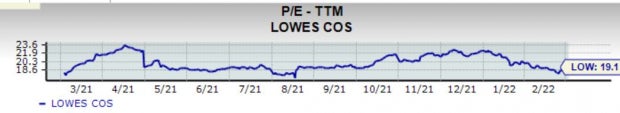
In the first quarter of 2022, Lowe’s presents an impressive market capitalization of $153 billion and trades with a beta of 1.34. A recent earning report in the year 2022 for Lowe displays a 3.5% earning beat. Quarterly earnings per share (EPS) was $1.78 as compared to the industry at $1.72. Lowe’s current earnings multiple is 19.1 times close to 19 percent of its high at 23.6 times in 2021, December (Fig 1). The share price of Lowe’s drops approximately 12 percent year-to-date (WSJ, 2022). Lowe’s generated revenue of $96 billion for the last one year making it ranked number eight out of 261 firms in the industry.
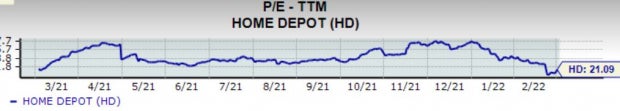
On the contrary, Home Depot’s market capitalization currently sits higher at approximately $341 billion trading at a beta of 1.06. In the past four years, the company has reported positive EPS surprises and increased its EPS to $3.21 in 2022. Home Depot’s present P/E ratio is at 21.1times, approximately 23 percent lower than its high of 27.6 times last year(Fig 2). The company’s forward earnings multiple has risen 5% from its low of 19.9 times in February implying that the share price is increasing at a higher rate than EPS (WSJ, 2022). Home Depot is ranked number six in the industry reporting a high rating.
In conclusion, because of the larger Home Depot market capitalization and it has benefited from higher profits margins, a higher P/E ratio than Lower for the past five years, which implies upward trends than the Lowe. Lowe has experienced a better stock performance and faster sales growth in the past few years than Home Depot.
Comparison of Incomes Statement for Most Recent Year (2021) of Home Depot and Lowe
Lowe’s common size Income Statement
Home Depot’s common size Income Statement
The cost of producing the products sold in Home Depot is efficient as compared to Lowe’s. Home Depot’s Gross profit is higher because of its efficiently producing the goods. The selling, administrative, and general expenses are higher in Lowe because of spending more on selling goods and offices (WSJ, 2022). Home Depot presents a higher interest expense by a smaller variation as compared to Lowe’s. The consolidated net income for Home Depot is higher than that of Lowe’s.
Comparison of Growth Rates in Sales and Earnings for the Past Five Years
From 2018 to 2022 the trends in sales growth for Lowe have been increasing and decreasing at the same time. In 2019, sales growth was 3.92% and decline to 1.18% in 2020. Then sales growth increased from 1.18 % in 2020 to 24.19% in 2021. Again in 2022 sales growth has dropped to 7.43% (WSJ, 2022). In the case of Home Depot, sales growth was at 7.23% in 2019 while in 2020 dropped to 1.87%. Again, in 2021, sales growth increased to 19.85% but in 2022 sales growth has declined to 14.42% (WSJ, 2022). It, therefore, implies Home Depot has reported a higher sales growth almost twice that of Lowe’s in 2022 despite all of them having an irregular trend in sales growth.
Lowe’s reported a drop in net income growth in 2019 of -32.86% but in 2020, it increased to 85%. In 2021, the company’s earnings declined to 36.15% only to increase slightly in 2022 to 44.71%. However, Home Depot has never reported negative growth in earnings. In 2019, the company registered a net income growth of 28.86% while in 2020 decreased to 1.09 because of the COVID-19 pandemic. Again, in 2021 increased to 14.45% and has continued to increase in 2022 reporting 27.72% net income growth (WSJ, 2022). Lowe’s shows a higher growth in earnings in 2022 than Home Depot.
Home Depot is considered the most productive given the square footage information. From 2010 to 2022, Home Depot has increased its average annual sales average. This is contributed to by both inorganic and organic growth, this progression in the company’s top line changed into ever growth in NOPAT (Non-operating Profit after tax). The company maintained a return on invested capital of more than 19 percent during the period showing a significant value creation. The company has also experienced strong growth in sales per square foot, demonstrating an effective usage of its non-current assets. In 2020, average sales per square foot were $543 as compared to Lowe’s sales per square foot averaged $431 (Simionato, 2022). This implies that Home Depot is the most productive in the industry based on sales per square foot.
Dividend Policies for both Chains
Lowe’s enjoys rewarding its investors with dividends and in this current year, the annual dividend yield for the firm’s shares is at 1.4%. Lowe’s has had five dividend increases for the past six years and it boasts of better five-year annualized growth in dividend at a rate of 5%. On the contrary, Home Depot’s annual dividend yield is 2% and has attained a favorable five-year annualized growth in dividend rate at 18.7%. Home Depot has higher dividend yield than Lowe’s because it has better dividend policies and higher financial metrics.
Summarize HOME DEPOT’S Cash Flows and Lowe’s Review
The company’s operating cash flow has increased from 2019 to 2022 to $16,571,000. Home Depot investing cash flow has declined from -$2, 416,000 in 2019 to -$2969, 000 in 2022. Financing cash flow has also declined from -$12,420,000 in 2019 to -$19,120,000 in 2022. However, the company’s end cash position has remained relatively stable from $1,778,000 in 2019 to $2,343,000 in 2022. Lowe’s cash flow from financing activities, investing activities, and cash position are relatively lower than Home depot’s (Yahoo, 2022). This indicates that Home Depot has cash position is stable and sustainable. The company increased its forecast for the fiscal year 2022 now it projects between $97 billion and $99 billion (Repko, 2022). Lower review shows that it has grown in sales with a 5% in its fourth quarter of the fiscal year.
References
Repko, M. (2022). Lowe’s raises forecast as it grabs a bigger share of home pro spending, navigates supply chain bottlenecks. CNBC.
Simionato, C. (2022). Home Depot and Lowe’s: sales per square foot 2020. Statista.
WSJ. (2022). LOW | Lowe’s Cos. Annual cash flow – WSJ. The Wall Street Journal – Breaking News, Business, Financial & Economic News, World News and Video.
WSJ. (2022). HD | Home Depot Inc. Stock price & news.
Yahoo. (2022). The Home Depot, Inc. (HD). Yahoo Finance – Stock Market Live, Quotes, Business & Finance News.